Geoscience References
Search Platforms
Maps
| Description | Image | Source |
|---|---|---|
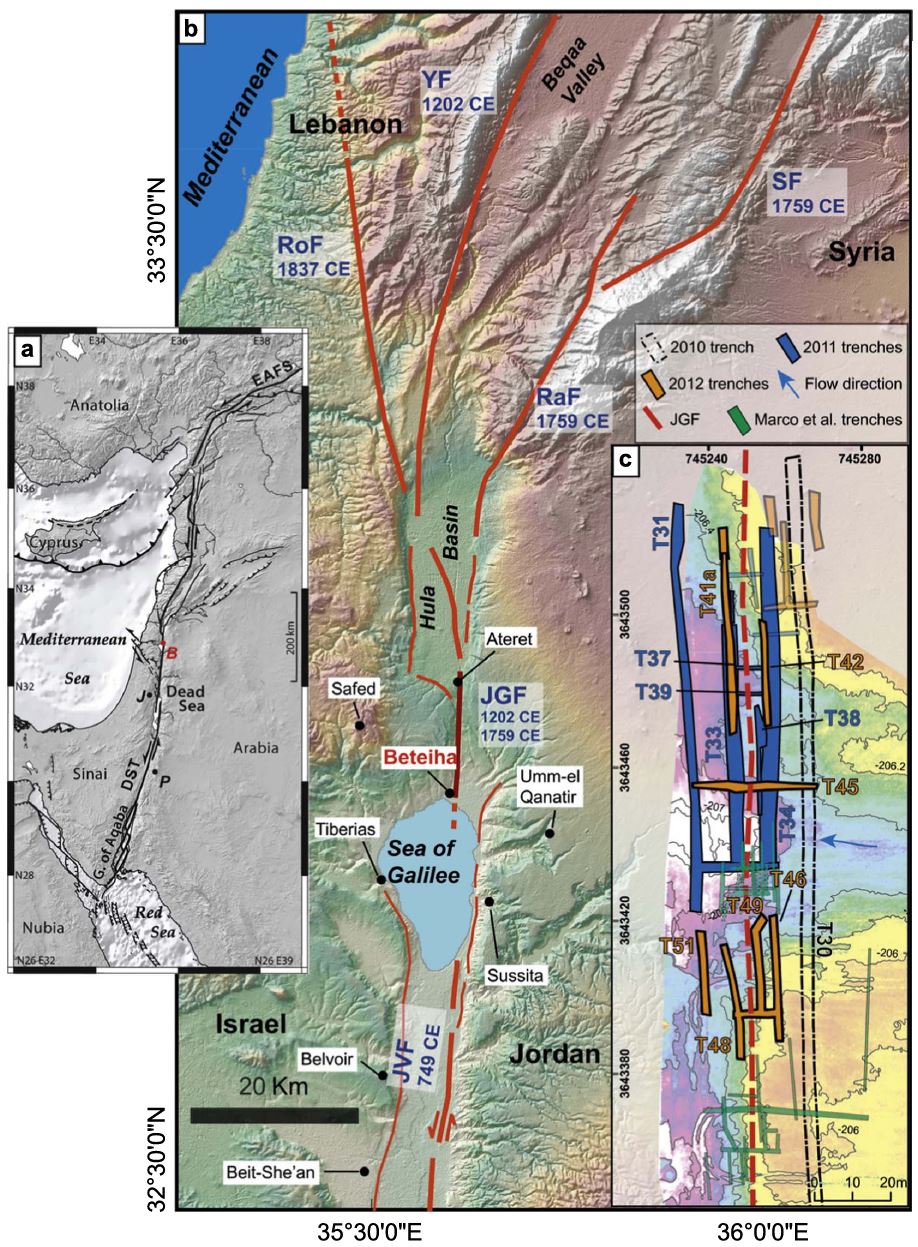
 Figure 1b
Structural framework of the Tiberias area Quaternary faults in the central part of the DSF, modified after Sneh and Weinberger (2014), Sagy et al. (2016), Hamiel et al. (2016) and Sharon et al. (2018, 2020); the red rectangle is the area enlarged in 1c.
Ferrario et al (2020) |
Faults in Jordan River Valley and SOG | Fig 1b - Ferrario et al (2020) |
 Figure 1c
Structural framework of the Tiberias area Simplified geologic map (after Bogoch & Sneh, 2008; Sneh, 2008), epicenters of Mw > 3.0 events since 1980 (data from Geophysical Institute of Israel) and focal mechanism of the 2018 Mw 4.5 event after Wetzler et al (2019) Ferrario et al (2020) |
Faults around SOG | Fig 1c - Ferrario et al (2020) |
 Figure 1B
Main faults and shaded relief of the Dead Sea–Sea of Galilee (Kinneret) area (after Hall, 1994; Ben-Avraham et al., 1996). Hazan et al (2004) |
Faults around SOG | Fig 1b - Hazan et al (2004) |
a) Plate tectonic settings of the Middle East, with major faults.
Wechsler et al (2018) |
Faults N of SOG | Fig. 1 - Wechsler et al (2018) |
 Figure 6
Neotectonic map of the Sea of Galilee compiled using available geophysical data; all faults (thick red lines) have a sinistral strike-slip component; main epicentres of the July 2018 earthquake sequence (> Mw 3.5) are indicated by blue circles, with yellow pattern boundings the 250–300 events isoline. Inset: orientation and relative motion of observed strain patterns in our study area in comparison with a reference strain ellipse. CCA 4.0. Gasperini et al (2020) |
Neotectonic map of SOG | Fig. 6 - Gasperini et al (2020) |
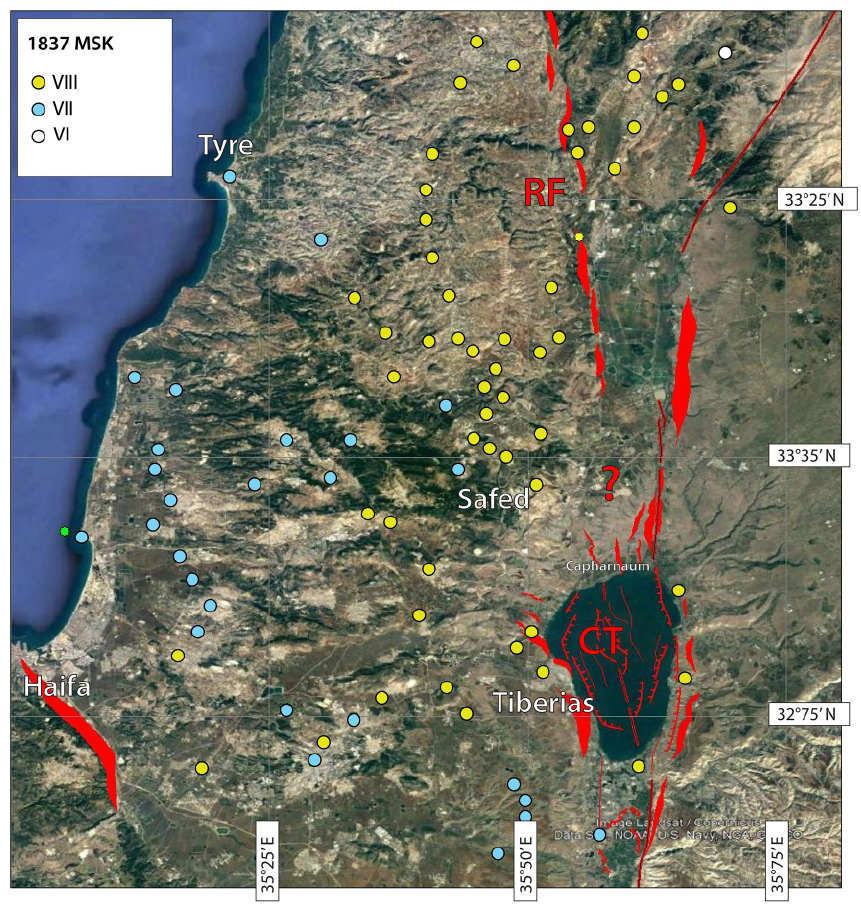
Tectonic map of the Sea of Galilee area including regional tectonic lineaments from previous studies Whiticar (1999) "Carbon and hydrogen isotope systematics of bacterial formation and oxidation of methane.", Ben-Avraham and Hall (1977) "Geophysical survey of Mount Carmel structure and its extension into the eastern Mediterranean.", and Nur and Ben-Avraham (1978) "The Eastern Mediterranean and the levant: tectonics of continental collision." and those derived from this work. Coloured circles represent intensity distribution of the AD 1837 earthquake according to Ambraseys (1997) "The earthquake of 1 January 1837 in southern Lebanon and northern Israel." (see legend for MSK intensities). We note that maximum intensities (yellow circles) align with structures located to the west of the SoG. Data available to date could not allow us to determine whether a connection between CT (Capharnaum Though) and RF (Roum Fault) could eventually exist. Satellite image is from Google Earth; Map data: Google, Data SIO, NOAA, U.S: Navy, NGA, GEBCO, Image Landsat/Copernicus). CCA 4.0. Gasperini et al (2020) |
Tectonic map of SOG | Fig. 2 - Gasperini et al (2020) |
 Figure 2
Different tectonic models proposed by various authors for the Sea of Galilee . CCA 4.0. Gasperini et al (2020) |
Tectonic models for SOG | Fig. 2 - Gasperini et al (2020) |
 Fig. 31.1
Location of faults near Megiddo and recent earthquake epicentres in the vicinity of the Carmel Fault.
Marco et al (2006) |
Carmel & Gilboa Faults | Fig. 31.1 - Marco et al (2006) |
| Description | Image | Source |
|---|---|---|
 Figure 1
Mapped faults and salt bodies, DSB (after Neev and Hall (1979), ten Brink and Ben-Avraham (1989), and Ben-Avraham et al. (1993)). Wetzler et al (2012) |
Dead Sea | Fig 1 - Wetzler et al (2012) |
 Figure 1
Map of the 11/2/2004 earthquake sequence and the associated events during the time period 1/1/2003-30/9/2004 (GII catalog), superimposed on the geological map (Sneh et al., 1998). Note that most of the activity is concentrated along the northeastern margins of the Dead Sea. EMSC and USGS main shock epicenter locations are also shown. Potentially Active Faults (PAF) relate only to the western side of the Dead Sea while the eastern side has not been yet mapped. Salamon (2004) |
PAF - W side of Dead Sea |
Fig 1 - Salamon (2004) |
 Figure 17.4a
Location map showing the location of the En Geddi, Lisan and Sedom diapirs. Faults are marked as heavy lines (dashed where inferred) (after Ben-Avraham, 1997). Seismic profiles are indicated by thin dotted lines. Ben-Avraham et al (2012) |
Tectonic Map Dead Sea |
Fig 17.4a - Ben-Avraham et al (2012) |
 Fig. 2.6
Map of Dead Sea area showing major faults. The Dead Sea Graben or trough has downdropped between the Western and Eastern Border Faults as much as 10 km since Miocene time. Cross-faults such as the Kerak Graben are sites where enhanced erosion has produced features such as the Wadi Kerak. Rast and Schaub (2003) |
Dead Sea Faults | Fig. 2.6 - Rast and Schaub (2003) |
| Description | Image | Source |
|---|---|---|
 Figure 7
Quaternary fault map of Israel. Colours indicate the corresponding criterion for each fault. Inferred subsurface faults are marked by dashed lines. Abbreviations are for the main strike-slip segments of the DST. Sharon et al (2020) |
Quaternary Fault Map | Fig 7 - Sharon et al (2020) |
 Map of Active and Potentially Active Faults in Israel
Geologic Survey of Israel |
Active and Potentially Active Fault Map | Geologic Survey of Israel |
| Description | Image | Source |
|---|---|---|
| Segmented Faults in Jordan River Valley |
 Figure 1b
Detailed map of the JVF (Jordan Valley Fault) segment between the Sea of Galilee and the Dead Sea. The segment itself is organized as six 15-km to 30-km-long right-stepping sub segments limited by 2 km to 3 km wide transpressive relay zones. The active trace of the JVF (Jordan Valley Fault) continues for a further ~10 km northward into the Sea of Galilee (SG) and ~20 km southward into the northern Dead Sea (DS). Ferry et al (2011) |
Fig 1b - Ferry et al (2011) |
| Segmented Faults in Jordan River Valley |
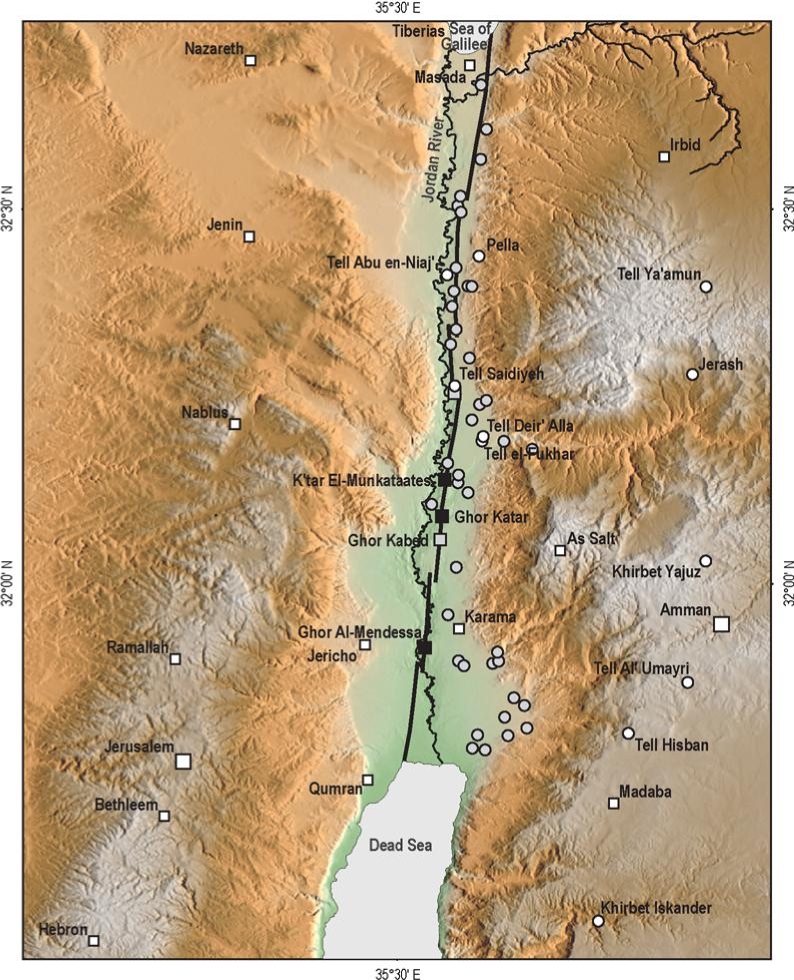 Figure 6
Archaeology of the Jordan Valley. White squares, main populated areas cited in historical documents; white dots, archaeological sites visited and reappraised in this study; gray dots are archaeological sites not studied here (lack of evidence and/or available literature) but of potential interest for future studies; gray squares, paleoseismic sites; black squares, geomorphological sites studied by Ferry et al. (2007). Ferry et al (2011) |
Fig 6 - Ferry et al (2011) |
| Segmented Faults in Jordan River Valley |

a) Location of the Dead Sea fault (black line) in the Jordan Valley between the Sea of Galilee and the Dead Sea. The fault rupture appears to be subdivided into fault sub-segments by prominent pressure ridges at Tell Arba'een, Tell Al-Qarn and Karameh. Inset shows plate tectonics in the eastern Mediterranean with GPS velocities (McClusky et al., 2003). Shaded topography is from 90-m-resolution SRTM3f data. b) Geomorphological map of the Jordan Valley around Karameh. Most prominent units include the badland-type Ghor areas, which contain a dense network of deeply incised streams and that separate the flat top surface of Lisan and Damya units and the flood plain of the present-day Jordan River. The Ghor area exhibits numerous natural outcrops and provides favourable fault mapping conditions. Ferry et al (2007) |
Fig 1 - Ferry (2007) |
| Closeup of Faulting at Ghor Khabed |
 Fig. 3
Aerial photograph (original scale of 1:20,000) of the area between Ghor Kabed and Wadi Russayf. The conspicuous fault trace displays en-echelon features, pull-apart basins and left- laterally offset drainage systems. See Fig. 1b for location. Ferry et al (2007) |
Fig 3 - Ferry (2007) |
| Seismotectonic Map Jordan Valley |
 Figure 2
Seismotectonic sketch of the Jordan Valley region - symbols as in Figure 1 (JW:see Araba Valley Table) and satellite view of the Wadi Araba-Jordan Valley Fault (AJF) area (Landsat-Spot combination, from an original 1:150,00 scale image; open arrows indicate the AJF trace). Inset A is a detailed map of the Jacob Ford area. Galli (1999) |
Fig 2 - Galli (1999) |
| Dead Sea Faults |
Fig. 2.6 Map of Dead Sea area showing major faults. The Dead Sea Graben or trough has downdropped between the Western and Eastern Border Faults as much as 10 km since Miocene time. Cross-faults such as the Kerak Graben are sites where enhanced erosion has produced features such as the Wadi Kerak. Rast and Schaub (2003) |
Fig. 2.6 - Rast and Schaub (2003) |
| Segmented Faults in Araba Valley |
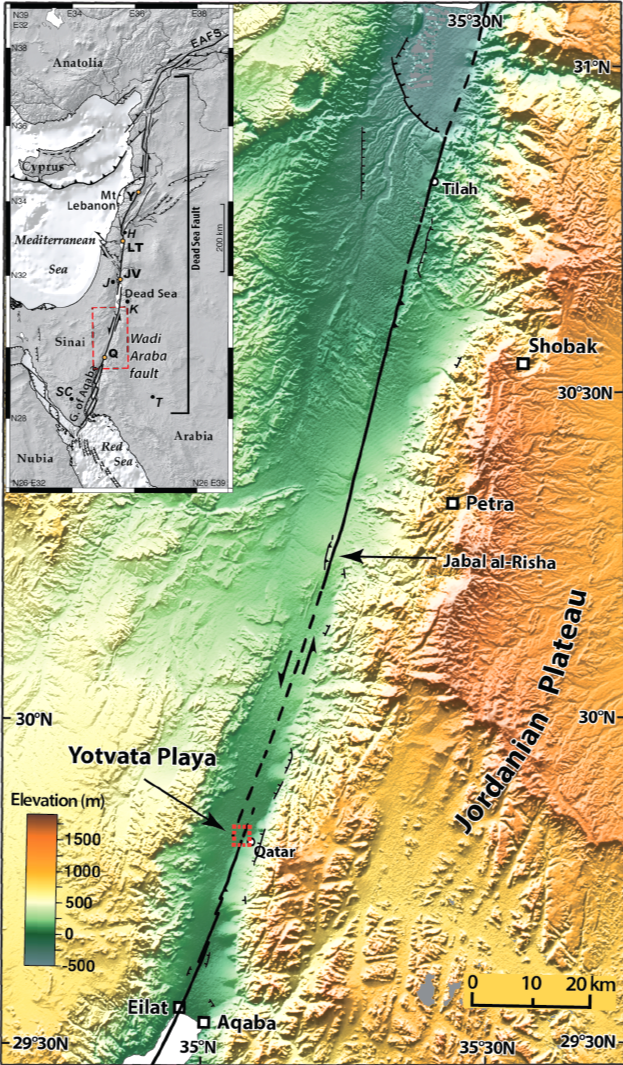 Figure 1
Inset map shows the entire Dead Sea fault, including major relay zones of the Dead Sea basin and the Lebanese bend.
Klinger et al (2015) |
Fig 1 - Klinger et. al. (2015) |
| Closeup of Yotvata Extension jog |
 Figure 2
Satellite image of the Qatar trench site (29° 48" 46.4' N 35° 04" 26.3' E) at the Yotvata extensional jog. The push-ups are well visible at the southern tip of the relay zone, deforming the toe of alluvial fans. North of the trench, the fault can be located only from the pressure ridges (Fig. 3) that mark the flat playa deposits, and the offset shoreline. To the southwest the depression is limited by normal faults with minor vertical throw. Background image is submetric pixel size imagery from Digitalglobe (GoogleEarth extract). Klinger et al (2015) |
Fig 2 - Klinger et. al. (2015) |
| Morphotectonic Map Araba Valley |
 Figure 3a
Morphotectonic map and drainage network of the Wadi Araba. Box shows location of Figure 3b. Boxes show location of detailed morphotectonic maps of the large abandoned alluvial fans. Question marks indicate uncertain correlations of alluvial surfaces far from any absolute age constraints. Le Béon et al (2012) |
Fig 3a - Le Béon et al (2012) |
| Morphotectonic Map N Araba Valley |
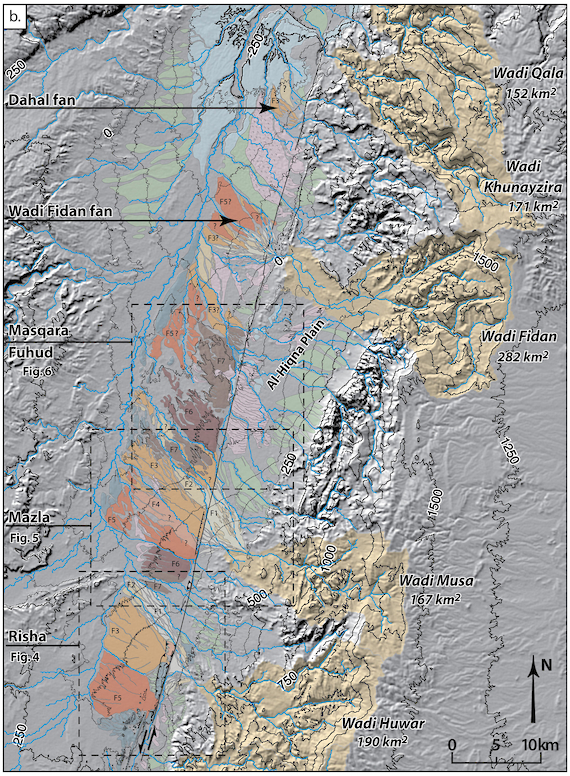 Figure 3b
Morphotectonic map of the northern Wadi Araba. See legend on Figure 3a. Boxes show location of detailed morphotectonic maps of the large abandoned alluvial fans. Question marks indicate uncertain correlations of alluvial surfaces far from any absolute age constraints. Le Béon et al (2012) |
Fig 3b - Le Béon et al (2012) |
| Seismotectonic Map Araba Valley |
 Figure 1
Seismotectonic sketch of the Wadi Araba region. Inset A shows the regional tectonics of the Dead Sea Rift; the black arrow indicate plate direction and velocities of Africa and Arabia relative to Eurasia. Inset B shows the seismicity distribution (Mo) along the Dead Sea Rift from Aqaba Gulf to Lebanon (period 31 B.C. to 1994 A.D.) Galli (1999) |
Fig 1 - Galli (1999) |
| Geologic Map N Araba |
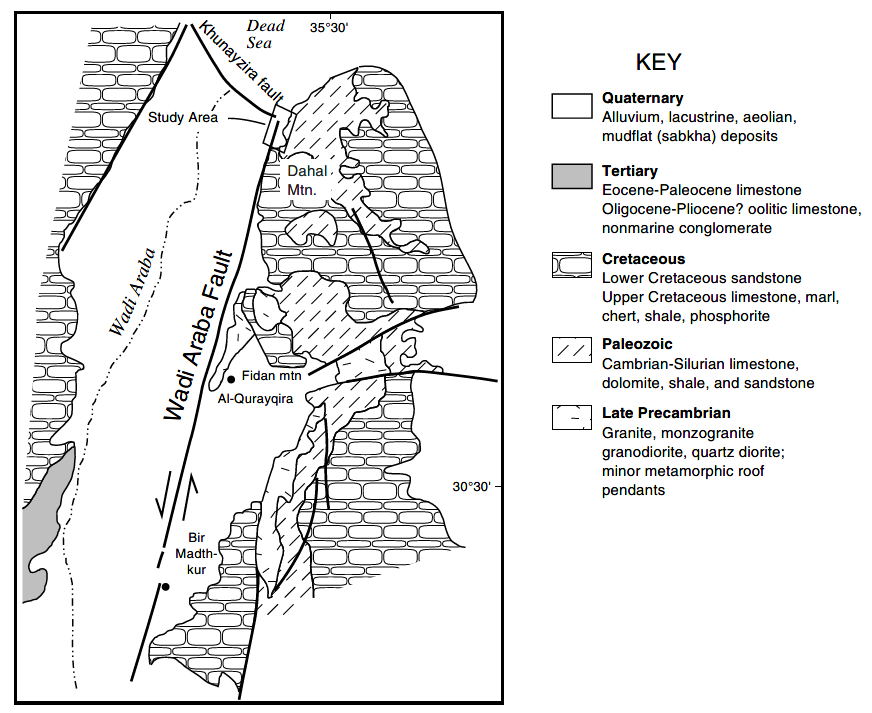 Figure 2
Generalized geologic map of Wadi Araba showing juxtaposition of different bedrock lithologies across the valley. The Wadi Araba fault is an active, strike-slip fault of the DST. The study area is located at the intersection of the Wadi Araba fault and the Khunayzira normal fault. Map modified after Bender, 1975. JW: Khunayzira normal fault is also known as the Amatzyahu fault Atallah (2002) |
Fig 2 - Atallah (2002) |
| Geologic Map N Araba tighter scale |
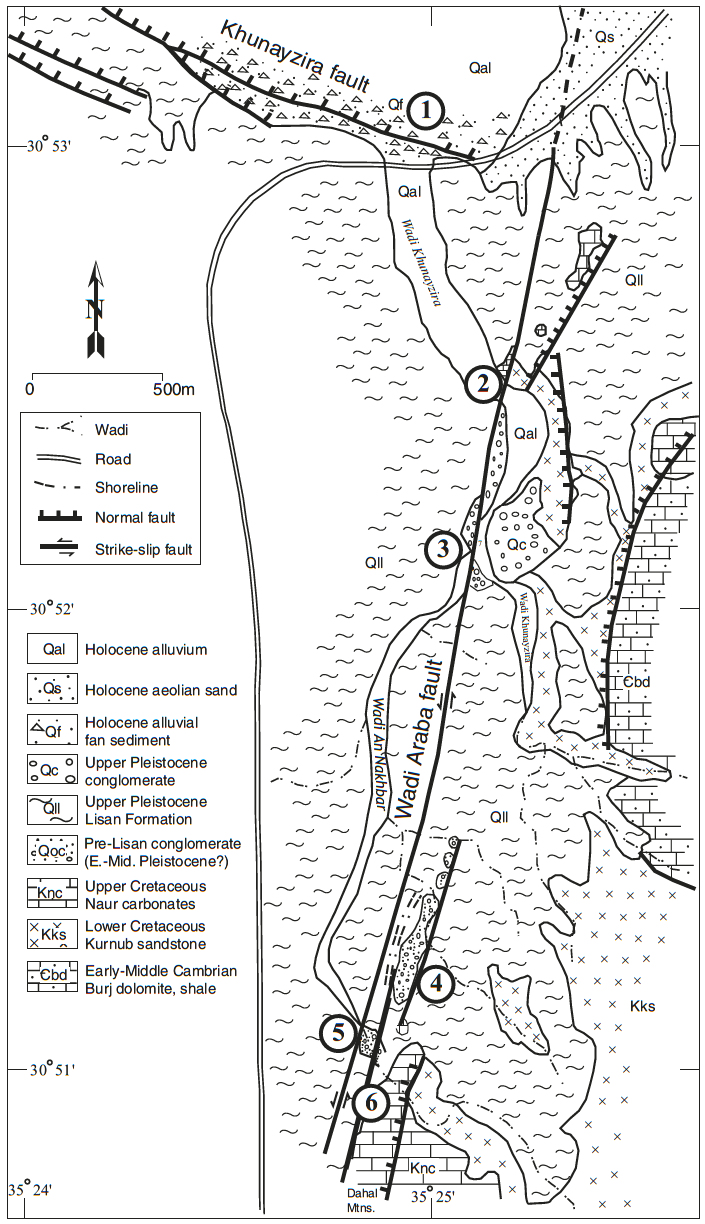 Figure 3
Geologic map of the study area constructed from interpretation of 1:10000 scale black and white air photos from 1978 and field mapping. Atallah (2002) |
Fig 3 - Atallah (2002) |
| Dead Sea Transform |
 Figure 1
The Dead Sea Transform (DST) is the plate boundary fault system that separates the Sinai and Arabian plates (after Garfunkel,1981). G: Ghab fault Y: Yammouneh fault R: Rachaiya fault E: Ed Damor fault CN-S: Central Negev-Sinai shear belt. Atallah (2002) |
Fig 1 - Atallah (2002) |
| Main transform faults GOA |
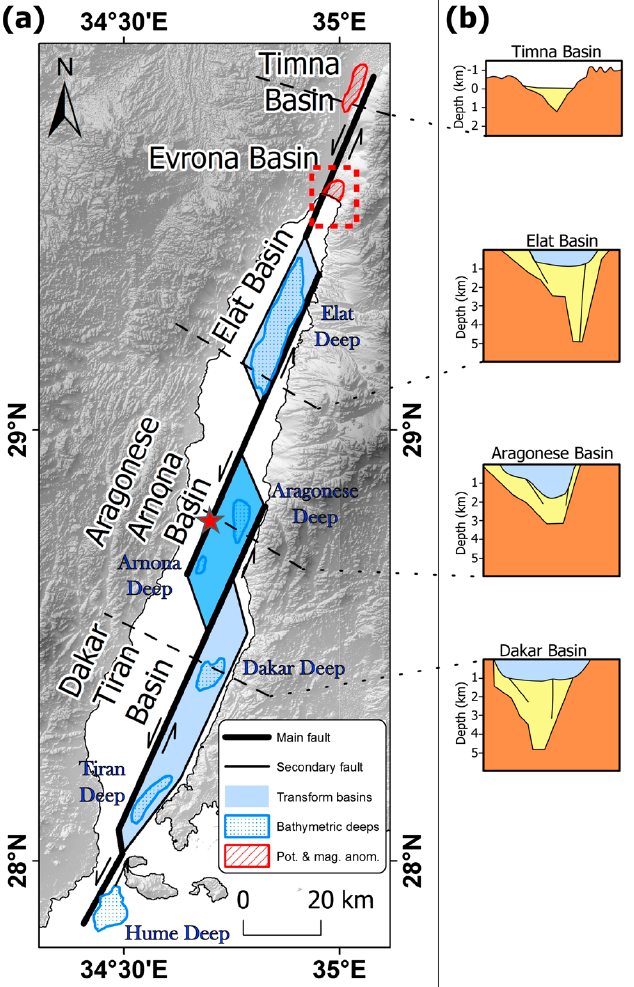
(a)Generalized tectonic settings of the GEA (modified after Ben Avraham [1985]). The main transform fault segments as suggested by Ben Avraham [1985] are marked with thick lines. The bathymetric deeps of the GEA are circled and noted. The GEA contains three transform basins (marked by light blue), of which the Aragonese-Arnona Basin is bound by strike-slip faults as a true pull-apart basin (marked by darker blue). Note that the main transform fault is marked on the eastern side of the asymmetric Elat Basin. The main transform fault north of the Elat Basin is mapped as suggested by Ben Avraham and Tibor [1993] and Ehrhardt et al. [2005]. The Evrona and Timna basins are mapped from gravimetric and magnetic data [ten Brink et al., 1999; Frieslander, 2000; ten Brink et al., 2007]. The red dashed box at the northern GEA outlines the study area. The red star marks the epicenter of the 1995 Mw 7.2 Nuweiba earthquake [Hofstetter et al., 2003]. (b) Schematic models of the deep section of the basins (modified after Ben Avraham [1985] and ten Brink et al.[1999]). The marine basins of the GEA are deeper (3–5 km) than the on-land basins of the southern Arava Valley (LT 1 km). Hartman at al (2014) |
Fig 2 - Hartman at al (2014) |
| Geologic Map N GOA |
 Figure 3
Geological map of the study area overlaid with the outline of major faults suggested in previous studies(modiied after Garfunkel [1970], Reches et al.[1987], Ben Avraham and Tibor [1993], Frieslander [2000], Niemi andSmith [1999], Slater and Niemi, [2003], Shaked et al. [2004], Ehrhardt et al. [2005], and Makovsky et al. [2008]). AF = Aragonese fault. Hartman at al (2014) |
Fig 3 - Hartman at al (2014) |
| Faults N GOA |
 Figure 7
Interpreted faults along the northern shelf of the Gulf of Elat/Aqaba. The location of each fault was picked from the seismic profiles, and each fault interpretation is marked by a grey dot. The fault lines were interpolated between these data points and projected onto the bathymetric image of the seafloor. Hartman at al (2014) |
Fig 7 - Hartman at al (2014) |
| Main transform faults GOA |

A map of the major faults (black lines) that divide the northern GEA and their estimated slip rates (internal frames), overlaid on the curvature of the seafloor. Faults are marked by solid lines where they were interpreted from the seismic data across the shelf. The continuation of the faults southward is suggested based on their extrapolation from the curvature analysis of the bathymetric data and in similarity to the fault outlines that were previously suggested [Recheset al., 1987; Ben Avraham and Tibor, 1993; Ehrhardt et al., 2005; Tibor et al., 2010]. Their continuation northward is suggested based on their extrapolation from presettlement (1945) aerial photographs. The graphs of average slip rates and tilt rates as a function of the averaging time-span are shown for their relevant faults. Average slip rates are marked by black lines and calculated uncertainty indicated by gray boxes. Hartman at al (2014) |
Fig 15 - Hartman at al (2014) |
| Seismicity & Faults GOA |
 Figure 2
Historical and seismicity map of Gulf of Aqaba. Salama et al (2021) |
Fig 2 - Salama et al (2021) |

(A) Tectonic setting of the sinistral strike-slip Dead Sea Fault (DSF). Seismicity from the ISC earthquake catalogue 1964 - 2015 (http://www.isc.ac.uk). The DSF connects to the North to the East Anatolian Fault System (EAFS) and to the South to the Red Sea ridge (modified from Le Béon et al., (2008)) GA: Gulf of Aqaba, ST: Strait of Tiran.
(B) Multibeam bathymetric map of GA and ST with the main active faults, combining R/V Thuwal (2018), F/S Meteor (1999) and Hall & Ben Avraham (1978) datasets. The main strike-slip faults are in red while normal faults are in black. Fault traces have been simplified for clarity. The grey focal mechanisms corresponding to the successive sub-events for the, Mw 7.3, 1995 earthquake, and location of the seismic swarms in 1983, 1990, 1993 and other focal mechanisms after Klinger et al., (1999). Grey background is Landsat 8 Imagery, courtesy of the U.S. Geological Survey (2018).
- ArF: Arnona Fault
- AF: Aragonese Fault
- DF: Dakar Fault
- EF: Eilat Fault
- HF: Haql Fault
- TF: Tiran Fault
 Figure 2
- Bathymetric map of the Gulf of Aqaba combining R/V Thuwal (2018), F/S Meteor (1999) and Hall & Ben Avraham (1978) datasets
- Shade bathymetry of the Gulf of Aqaba with an azimuth of 315N and a sun angle of 25°
- Slope map of the Gulf of Aqaba from low slope angle (white: 0°) to high slope angle (black: >45°)
Matthieu et al. (2021)

- Zoom-in of the northern part of the Gulf of Aqaba, along the morphological trace of the Haql fault (see location on Figure 2) with location of the cross sections shown in (B). The fault lines are more detailed than in Figure 1. Red lines represent the main strike-slip faults, black lines the main normal faults. Along the Eilat fault, a long-term displaced channel as well as the left-lateral displacement of a small hill confirm the strike-slip character of the Eilat fault.
- Cross-sections along the longitudinal shape of the alluvial fans, North of the city of Haql. No vertical offsets are visible on these cross-sections, with the exception of a possible knickpoint along profile D-D’. The continuous convex shape of the fans suggests no recent activity of the Haql fault.
- The trace of the Haql fault is buried by fans coming from the coastal plain, with no visible recent perturbations of the fans at this location. Nevertheless, the high relief shows the long-term normal or oblique character of the Haql fault. In few places, the shaded topography suggests that a small part of strike-slip motion is also accommodated along the Haql fault.
- At the southern termination of the Haql fault, discontinuous small scarps across the fans suggest that this section of the fault might have been activated recently.
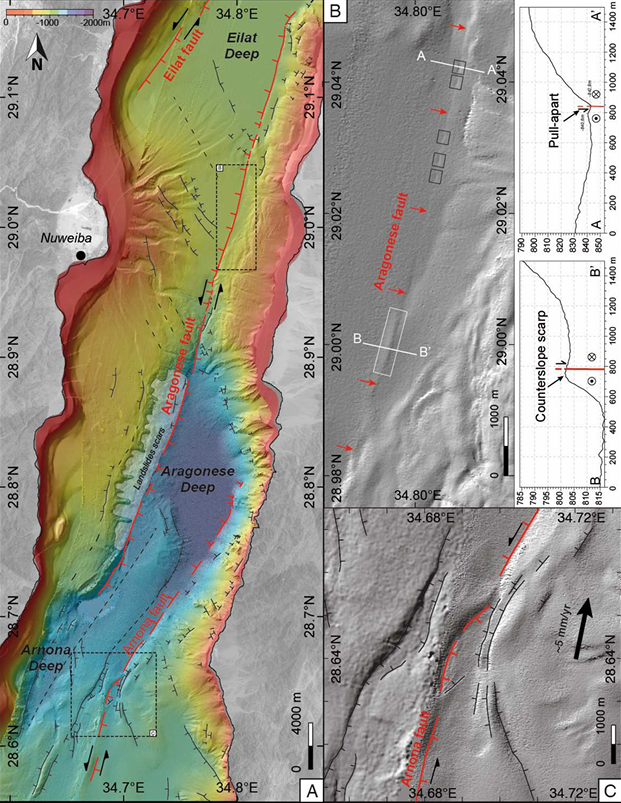 Figure 4
- Detailed fault map of the sinistral strike-slip fault system in the central GA. Direct evidence of surface rupture associated to the main subevent (see Fig. 2) of the 1995 Mw = 7.3 Nuweiba earthquake are found in box B.
- Sharp fault morphology suggesting very recent fault activation. Small changes of geometry along the Aragonese fault are responsible for small pull-apart (black squares) and counterslope scarp (white square).
- Detail of the fault zone between Aragonese Deep and Arnona Deep resulting from a complexity in the geometry of the Arnona fault. The red line represents the main active strike slip fault.
 Figure 5
- Southern part of the Gulf of Aqaba (see location on Figure 2). Dakar and Tiran Deeps are located between the sinistral strike-slip Arnona fault (red line) and the normal Dakar fault (bold black lines). The location of the main strike-slip fault is partly masked by diapiric foldings (black arrows) and secondary faulting (thin black and dashed black lines) associated with the destabilization of large salt deposits moving down from the Dahab plateau.
- Cross-sections across the Dahab plateau showing the eastward sloping and the topographic drop from the Dahab plateau toward the Dakar and Tiran deeps.
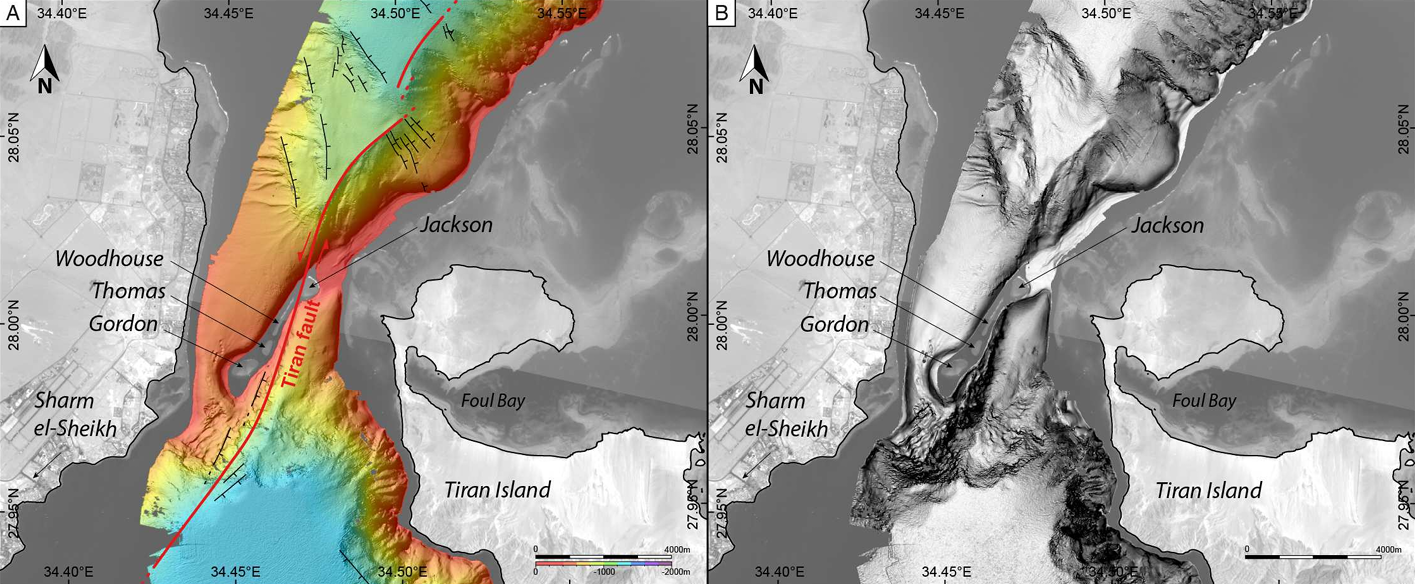 Figure 6
Strait of Tiran (see location on Figure 2).
- The sinistral strike-slip Tiran Fault is located between the Woodhouse and Jackson reefs. The sharp bathymetry to the North and to the South of the reef emphasizes the location of the fault. Red lines represent the main strike slip faults, black lines represent the main normal faults.
- Slope map of the Strait of Tiran, from low slope angle (white: 0°) to high slope angle (black: >45°).
| Description | Image | Source |
|---|---|---|
| Major Faults |
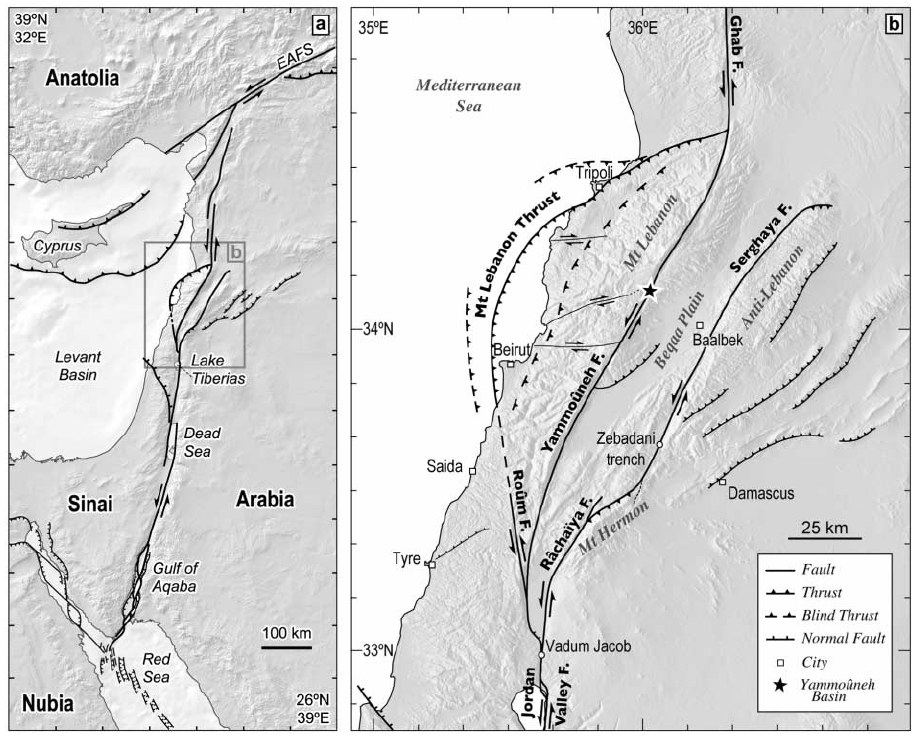 Figure 1
Regional tectonic setting.
Daeron et al (2007) |
Fig 1- Daeron et al (2007) |
| Tectonic Map of DSF |
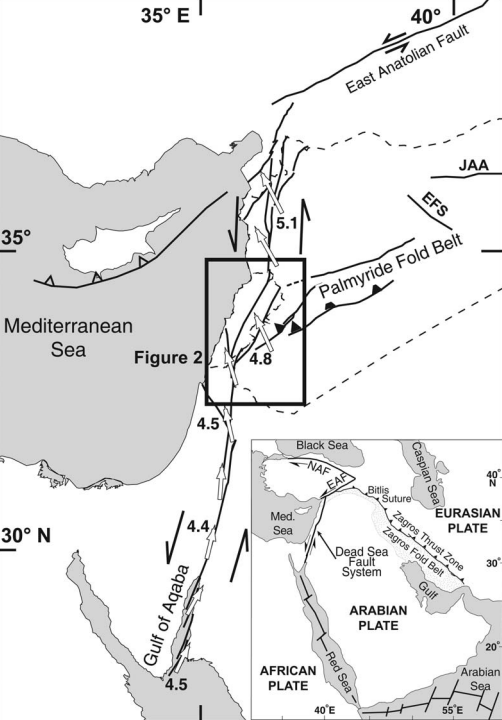 Figure 1
Regional tectonic map of the Dead Sea fault system. Directions (white arrows) and rates (mm/a) of motion of the Arabian plate relative to the Sinai plate are based on the plate model of Reilinger et al. (2006). Abbreviations:
Gomez et al (2007) |
Fig 1- Gomez et al (2007) |
| Topography of LRB |
 Figure 2a
Map showing the topography of the Lebanese restraining bend from a 20-metre-pixel, InSAR-derived DEM (Gomez et al. 2006). Gomez et al (2007) |
Fig 2a- Gomez et al (2007) |
| Geology of LRB |
 Figure 2b
Map showing general geology (simplified from Dubertret 1955) and the structure of the restraining bend (simplified from Gomez et al. 2006). Arrows indicate velocities of continuous GPS sites (red circles) in an Arabia-fixed reference frame (Reilinger et al. 2006). GPS velocities depict the net left-lateral shear across the Dead Sea fault system in this area. White line = location of the cross-section in Figure 3. Abbreviations
Gomez et al (2007) |
Fig 2b- Gomez et al (2007) |
| Roum Fault |

Nemer and Meghraoui (2006) |
Fig 4 - Nemer and Meghraoui (2006) |
| DST in Lebanon |

(a) The left-lateral Dead Sea Transform Fault extending from the Gulf of Aqaba to southeast Turkey. Modified from McBride et al. [1990] with permission from Elsevier. Box shows location of Figure 1b. White arrows indicate the GPS velocities (mm/a) of the Arabian plate relative to Africa after Gomez et al. [2006]. (b) Shuttle Radar Topography Mission 90-m-resolution digital elevation model of the Lebanese restraining bend showing the main units and structures:
Nemer et al (2008) |
Fig 1 - Nemer et al (2008) |
| DST in Lebanon |

(a) The Dead Sea Transform Fault extending from the Gulf of Aqaba to southeast Turkey. It is a left-lateral transform fault with a general NeS trend except in Lebanon where it bends rightward to form a restraining bend. Modified from McBride et al. (1990). Box shows location of b. White arrows indicate the GPS velocities of the Arabian plate relative to adjacent plates after McClusky et al. (2003). (b) Shuttle Radar Topography Mission 90-m-resolution digital elevation model of the Lebanese restraining bend showing the main units and structures:
Nemer and Meghraoui (2006) |
Fig 1 - Nemer and Meghraoui (2006) |
| Active Faults of Lebanon |
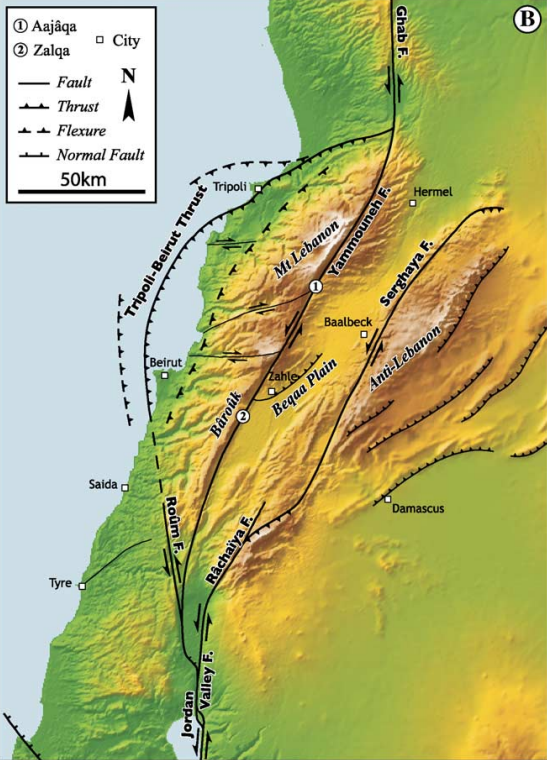 Fig. 1b
Active faults of Lebanese re-straining bend. Circled numbers mark locations of studied sites: Aajaˆqa (1) and Zalqa (2). Daëron et al (2004) |
Fig 1b - Daëron et al (2004) |
| Rachaya Serghaya Fault Area |
Fig. 2b (a) Digital elevation model of the RcF-SF area (location on Figure 1b) showing the different places referred to throughout the text. White boxes indicate the locations of subsequent figures. White arrows indicate the slope break at the base of the northern flank of Mount Hermon. Probable faulting (broken line southwest and northeast) of SF is after Gomez et al. [2003]. Nemer et al (2008) |
Fig 2 - Nemer et al (2008) |
| Major Faults |

Structural map of Lebanon Restraining bend.
|
Fig 1 - Fedorik et al (2022) |
| Geotectonic Map |
 Figure 1a
Location map of the Levant area with major faults and the modeled area (magenta rectangle); the Harrat Ash-Shaam volcanic field (gray polygon) and the direction of the relative regional plate motions (black arrows). Light red polygons mark uplifted regions, and yellow polygons mark subsided regions. Wetzler et al. (2022) |
Fig 1a - Wetzler et al. (2022) |
| Tectonic and Fault Map |
 Figure 1b
Tectonic map of the model area with major faults (Segev et al., 2021; Styron and Pagani, 2020). Coordinate system are UTM zone 36 N (external) and WGS84 (internal). Wetzler et al. (2022) |
Fig 1b - Wetzler et al. (2022) |
| Description | Image | Source |
|---|---|---|
| Mount Lebanon Thrust |
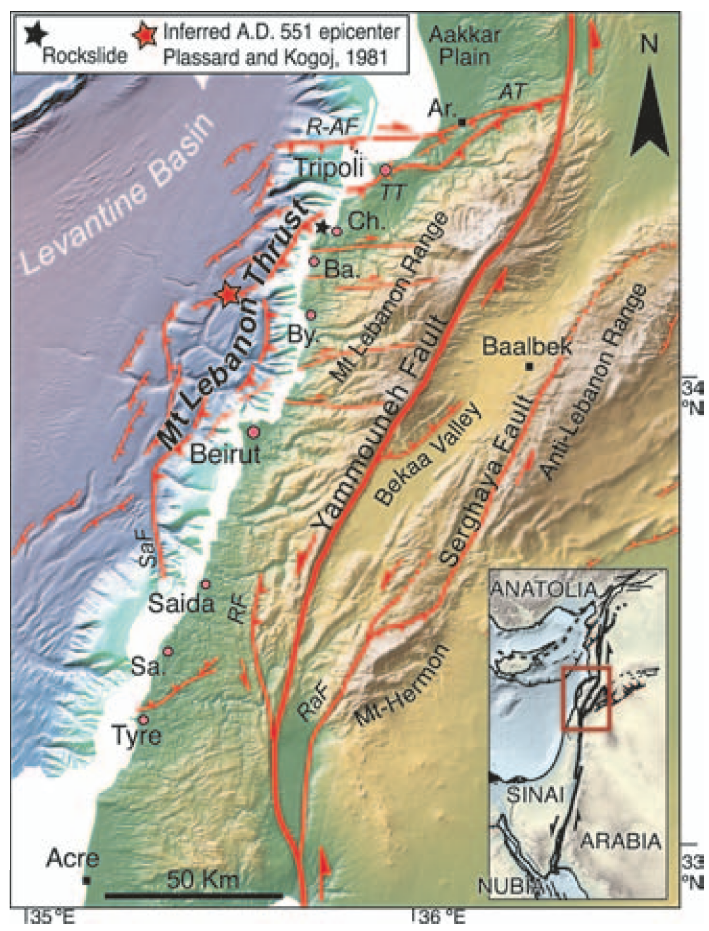 Figure 1
Active faults of Lebanese restraining bend. Map projected upon Shuttle Radar Topography Mission relief and new SHALIMAR EM300 bathymetry. Hitherto unknown thrust system (Mount Lebanon thrust) hugs continental slope base offshore Mount Lebanon. Red box in inset shows location of Lebanese bend along Levant fault system. Red circles are coastal cities that suffered Tsunami effects during the 551 A.D. event. City abbreviations:
Elias et al (2007) |
Fig 1- Elias et al (2007) |
| Historical Earthquakes in Lebanon |
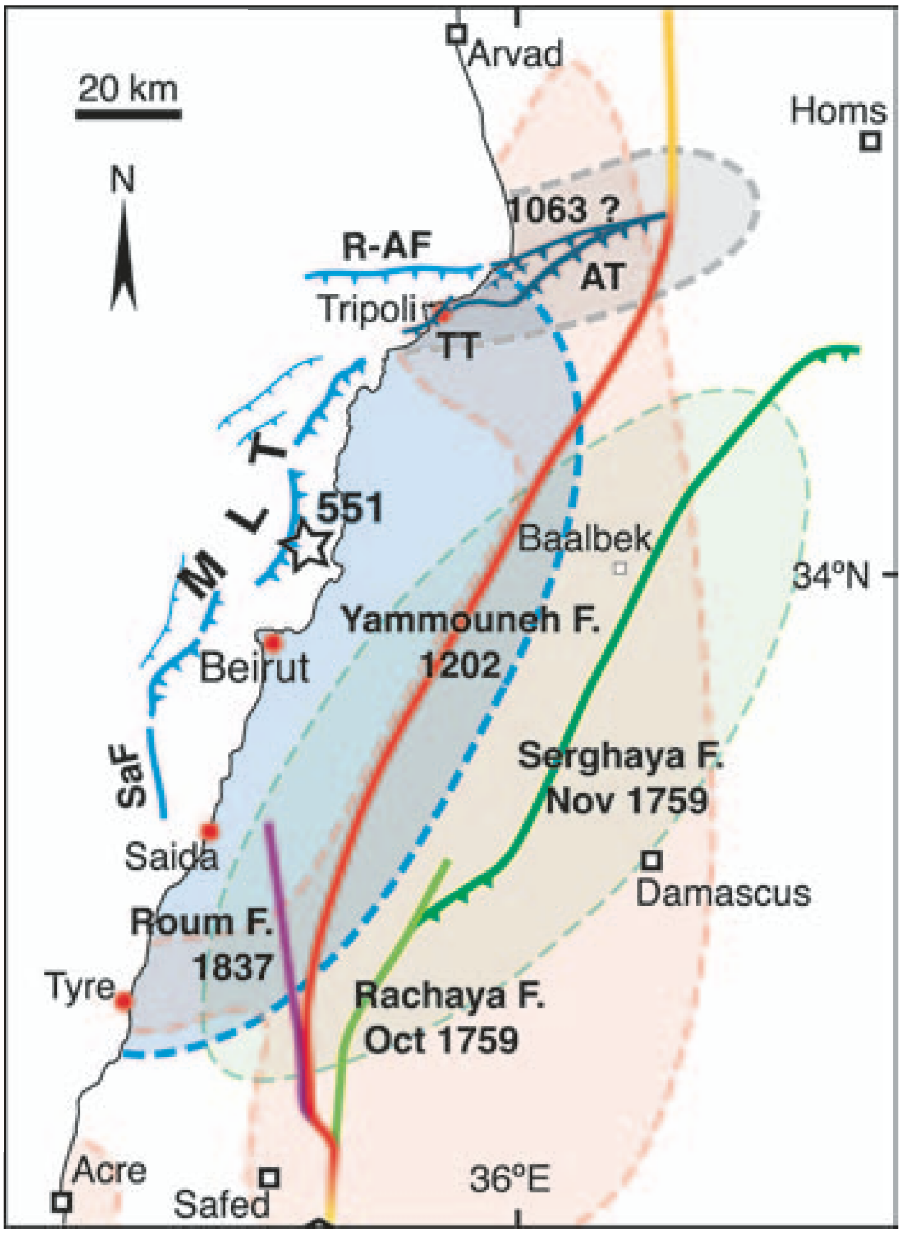 Figure 4
Most likely sources of A.D. 551 (open star—inferred epicenter, this study) and other large historical earthquakes in Lebanon (modified from Daëron et al., 2005). Colored patches enclose areas where macro-seismic intensities > VIII were reported. Blue color corresponds to A.D. 551. (VIII isoseismal from Sieberg, 1932). Elias et al (2007) |
Fig 4- Elias et al (2007) |
| Description | Image | Source |
|---|---|---|
| Region of Tripoli |
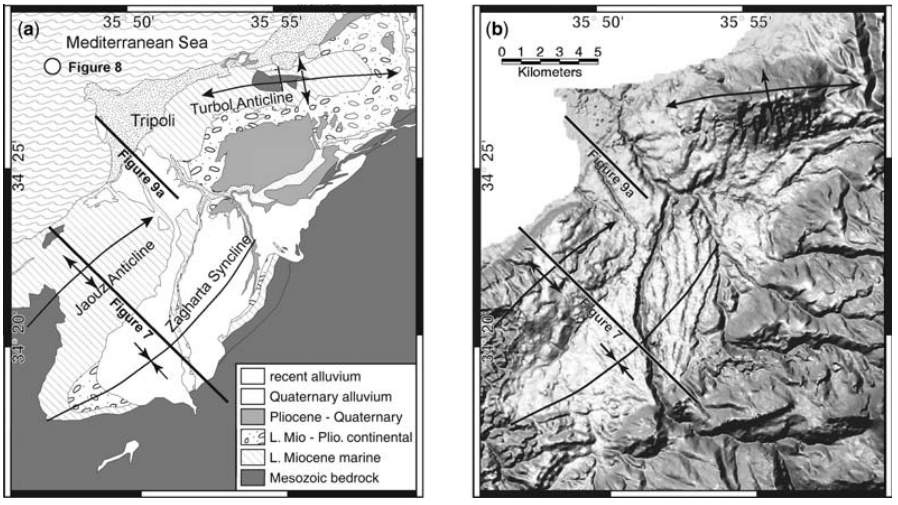 Figure 6
(a) Map showing simplified geology (from Dubertret 1955) (b) map of topography in the region of Tripoli (based on Gomez et al. 2006). Locations of the profiles in Figures 7 & 9a are shown, as well as the location of the photograph in Figure 8. Gomez et al (2007) |
Fig 6- Gomez et al (2007) |
| Description | Image | Source |
|---|---|---|
| Southern Bekaa Valley |
 Fig. 12a
Shaded relief of the southern Bekaa Valley. See Figure 3 for location.
Gomez et al (2006) |
Fig. 12a - Gomez et al (2006) |
- from Nemer et al. (2023)
 Fig. 1
- Regional map of the Middle East showing the eastern Mediterranean area and the Arabian, African, and Anatolian plates; dashed box is the location of (b)
- Digital elevation model (Shuttle Radar Topography Mission, 90-m resolution) of the eastern Mediterranean region showing the different segments of the Dead Sea Transform Fault; box shows the location of the Lebanese Restraining Bend (c)
- Digital elevation model (Shuttle Radar Topography Mission, 90-m resolution) of the Lebanese Restraining Bend showing the main units, structures, and places that are referred to throughout the text
- from Nemer et al. (2023)
 Fig. 2
The study area with:
- main faults (red)
- folds (green)
- seismogenic zones (blue outlines, cf. Fig. 4)
- estimated epicentral locations (black squares annotated by date and magnitude) of the major historical earthquakes of the Lebanese Restraining Bend (e.g. Sbeinati et al., 2005)
- instrumental seismicity earthquakes with magnitudes ≥ 4
- from Nemer et al. (2023)

The study area with
- main faults (red)
- folds (green)
- seismogenic zones (blue outlines and labels) associated with their focal mechanism solutions
- after Pondrelli et al. (2002) (light blue), Salamon et al. (2003) (green), Hofstetter et al. (2007) (yellow), Abdul-Wahed et al. (2011) (orange)
- after Meirova and Hofstetter (2013) (pink)
- after Palano et al. (2013) (red)
- from Table 1
- F fault
- Fl flexure
- M middle
- N northern
- S southern
- St structure
 Focal Mechanisms vs. Fault Type
Wikipedia
Mikenorton - CC BY-SA 3.0
 Development of the Focal
Mechanism Beach Ball
Wikipedia
Mikenorton - CC BY-SA 3.0
- from Nemer et al. (2023)
 Fig. 5
- The study area with regional polygons that delimit the velocity structural models (differentiated by colors)
- Geological map of the study area after Dubertret (1962)
- from Nemer et al. (2023)
 Fig. 5b
Geological map of the study area after Dubertret (1962)
Nemer et al. (2023)
| Description | Image | Source |
|---|---|---|
| Regional tectonic map |
 Figure 1
Regional tectonic map of the northern Arabian Plate and the surrounding regions, showing the proximity of Syria to many active plate boundaries.
The yellow square shows the area in Figures 2, 3, 4 and 5. Abdul-Wahed and Ibrahim (2010) |
Fig 1 - Abdul-Wahed and Ibrahim (2010) |
| Tectonic Zones |
 Figure 2
Tectonic zones of Syria (modified from Brew et al. (2001). Abdul-Wahed et al (2018) |
Fig 2 - Abdul-Wahed et al (2018) |
| Principal Faults |
 Figure 3
Map showing geographical distribution of the Syrian National Seismological Network (▲) and the principal faults. Fault geometry is summarized from Brew et al. (2001). Abbreviations: fault (F.), basin (B.). Abdul-Wahed et al (2018) |
Fig 3 - Abdul-Wahed et al (2018) |
| Principal Faults |
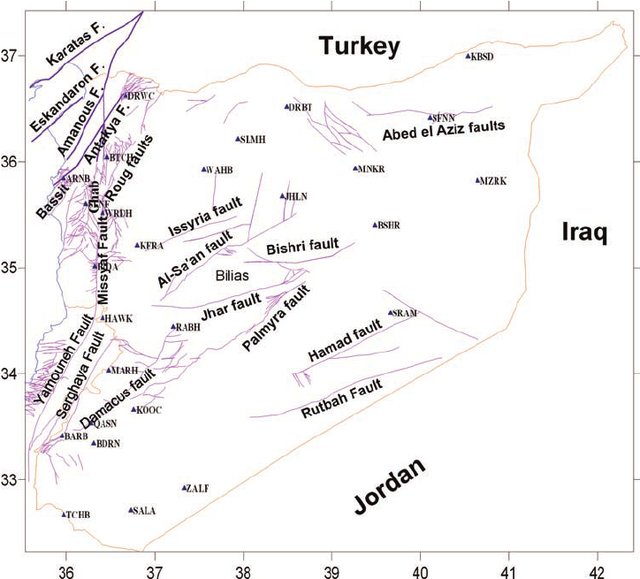 Figure 2
Map of the geographical distribution of the Syrian National Seismological Network ( ▲ ) and the principal faults in this area. Abdul-Wahed and Ibrahim (2010) |
Fig 2 - Abdul-Wahed and Ibrahim (2010) |
| Seismicity |
 Figure 5
Earthquake activity in Syria and nearby countries recorded by Syrian National Seismological Network from 1995 to 2012. Abdul-Wahed et al (2018) |
Fig 5 - Abdul-Wahed et al (2018) |
| Focal Mechanisms |
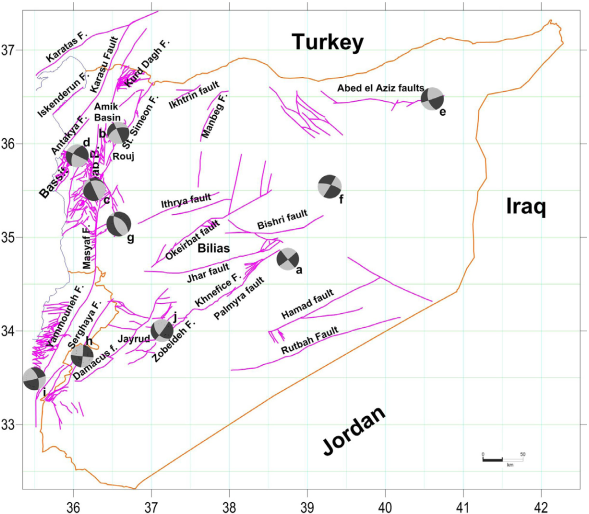
The focal mechanisms map of some largest events
Abdul-Wahed et al (2018) |
Fig 7 - Abdul-Wahed et al (2018) |
| Focal Mechanisms |
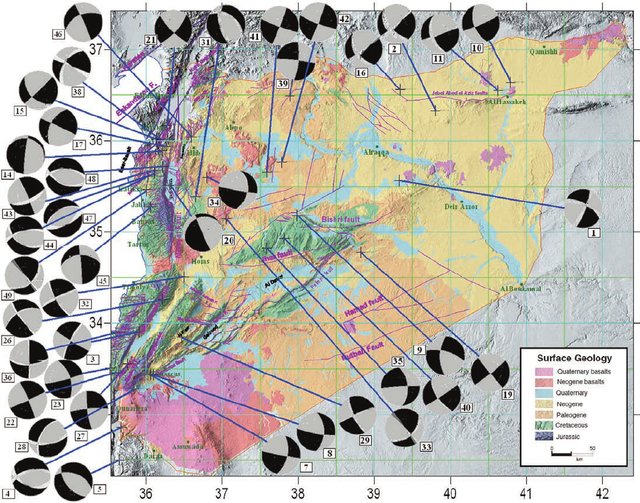 Figure 4
The focal mechanisms of the main events recorded over the last ten years in Syria and its nearby regions. The adjacent numbers indicate the event numbers in Appendix 1. The fault plane solutions are presented with lower-hemisphere, equal-area projections: white quadrants for dilatation, and black for compression. The base map showing the surface geology was modified by Brew et al. [2001], from Dubertret [1955], Ponikarov [1966] and Devyatkin et al. [1997]. Abdul-Wahed and Ibrahim (2010) |
Fig 4 - Abdul-Wahed and Ibrahim (2010) |
| Simplified Focal Mechanisms |

Simplified interpretation of the focal mechanisms over the last decade for the largest events in Syria. The active faults proposed to be generating these events were:
|
Fig 5 - Abdul-Wahed and Ibrahim (2010) |
| Epicentral Map Damascus |
 Figure 8
Detailed epicenters map of some important seismic activities observed in Damascus region. Abdul-Wahed et al (2018) |
Fig 8 - Abdul-Wahed et al (2018) |
| Detailed Epicentral Map Damascus |
 Figure 10
Detailed epicenters map of the seismic activity observed in Damascus region during the period 1995-2012. Abdul-Wahed et al (2018) |
Fig 10 - Abdul-Wahed et al (2018) |
| Epicentral Map Central Syria |
 Figure 9
Detailed epicenters map of the seismic activity recorded in central part of Syria. Abdul-Wahed et al (2018) |
Fig 9 - Abdul-Wahed et al (2018) |
| Epicentral Map N Aleppo |
 Figure 11
Detailed epicenters map of northern Aleppo. Abdul-Wahed et al (2018) |
Fig 11 - Abdul-Wahed et al (2018) |
| Missyaf fault segment |
 Fig. 7
Missyaf fault segment (yellow arrows) limited by the El Boquea and Ghab pull-apart basins, to the south and north,respectively (Meghraoui et al. 2003). Topography data is from SRTM (3-arc-second) Meghraoui (2015) |
Fig 7 - Meghraoui (2015) |
| Active Faults Syria |
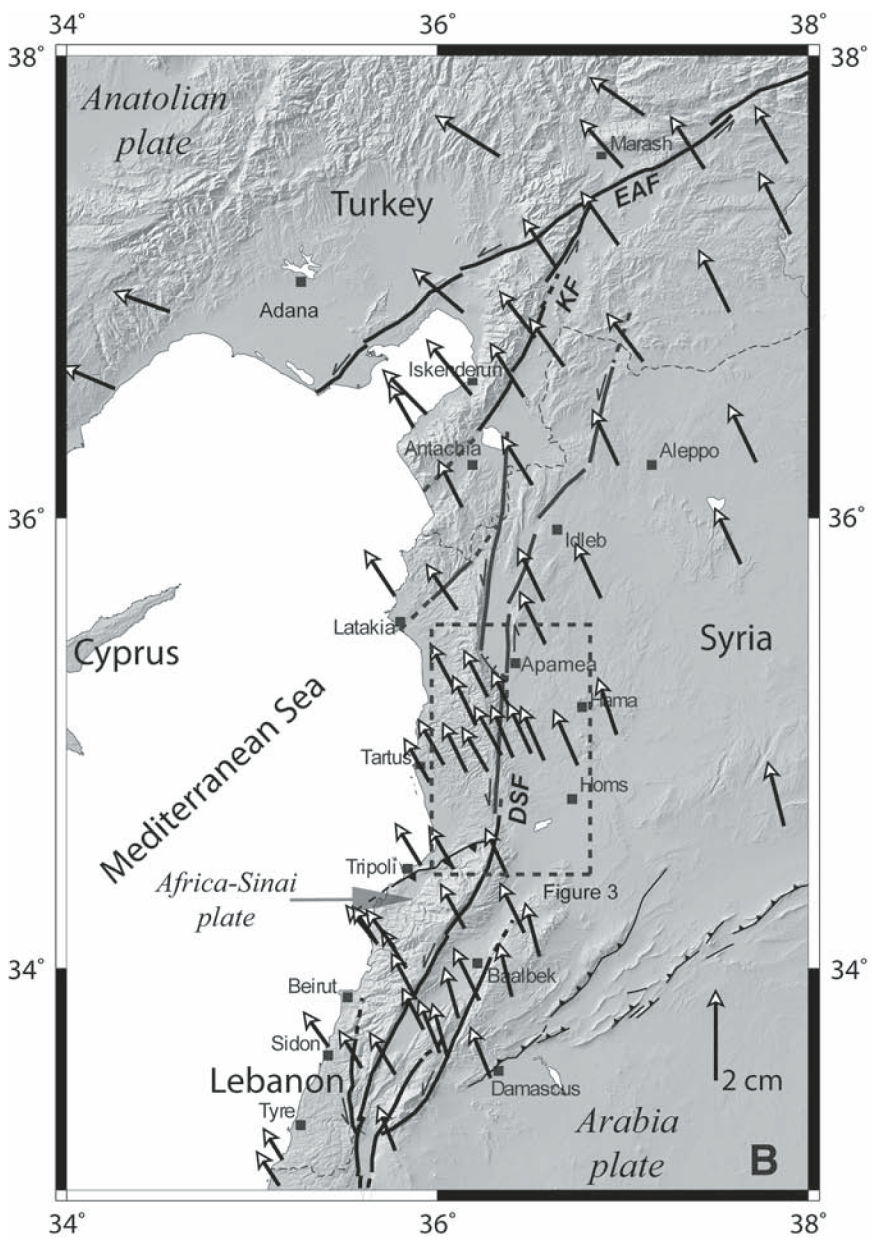 Fig. 1B
Fault zone (black line; Meghraoui et al., 2003; Gomez et al., 2003; Elias, 2006; Nemer et al., 2008) and global positioning system (GPS) velocities (Eurasia fixed; Reilinger et al., 2006; Gomez et al., 2007; Le Beon et al., 2008; Alchalbi et al., 2009) emphasizing the left-lateral movements between the Sinai block and Arabia plate. Thick line is strike-slip fault; thin line is thrust fault.
Sbeinati et al (2010) |
Fig 1B - Sbeinati et al (2010) |
| Major Historical Earthquakes |
 Fig. 2
Major historical earthquakes (white dots) and areas of maximum damage (shaded) for the 29 June 1170 earthquake (Io = IX using EMS98 intensity definition of Grünthal, 1998) as recorded along the northern Dead Sea fault (local intensities are from Guidoboni et al., 2004b; Sbeinati et al., 2005). The shaded area of maximum damage (Io = IX) for the A.D. 1170 large earthquake is along the Missyaf fault segment and Ghab Basin (see also Figs. 1B and 3 for legend) and overlaps with the maximum intensity VIII (MSK, black dashed line) as drawn by Ambraseys (2009).
Sbeinati et al (2010) |
Fig 2 - Sbeinati et al (2010) |
| Major Historical Earthquakes |
 Fig. 1a
Map showing the tectonic setting and instrumental seismicity from 1963 – 1997 (International Seismological Centre data file, M > 1) of the study area along the Missyaf segment of the Dead Sea fault (DSF). Focal mechanisms along the DSF are of moderate earthquakes (5 < Mw < 6; from CMT Harvard and MEDNET-INGV Rome).
Meghraoui et al (2003) |
Fig 1a - Meghraoui et al (2003) |
| Tectonic Map of Syria |
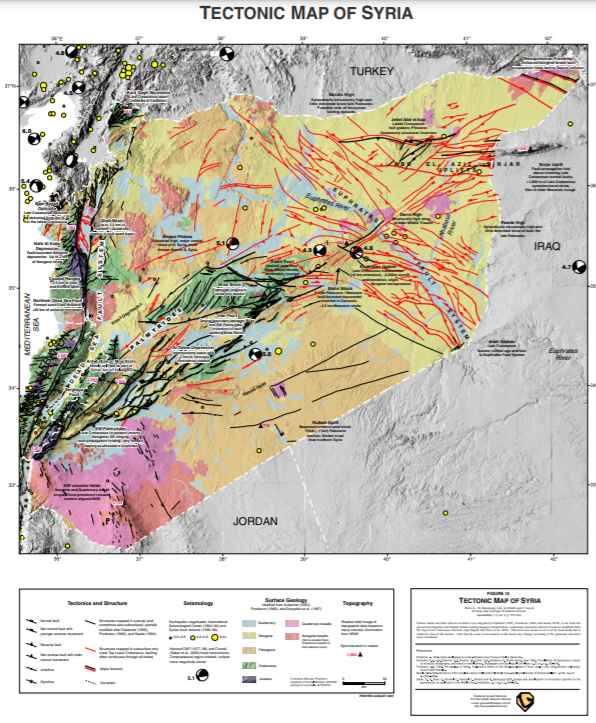 Fig. 15
Tectonic Map of Syria Brew et al (2001) |
Fig. 15 - Brew et al (2001) |
| Tectonic Map of Syria |
 Fig. 5
Preliminary structural map showing the top of Lower Cretaceous horizon. This is one of a series of subsurface structural maps under construction within the GIS (see Table 1). Brew et al (2001) |
Fig. 5 - Brew et al (2001) |
| Palmyride mountains tectonics |
 Fig. 1
Left side: map showing bounding faults and folds of the Arabian platform. Right side: location map of the intersection of the Euphrates depression with the Palmyride mountains. Alsdorf et al (1995) |
Fig. 1 - Alsdorf et al (1995) |
| Simplified neotectonic map of Syria |

Simplified neotectonic map of Syria. Anticline ridges:
Rukieh et al (2005) |
Fig. 1 - Rukieh et al (2005) |
| topography and boundaries of the neotectonic provinces |
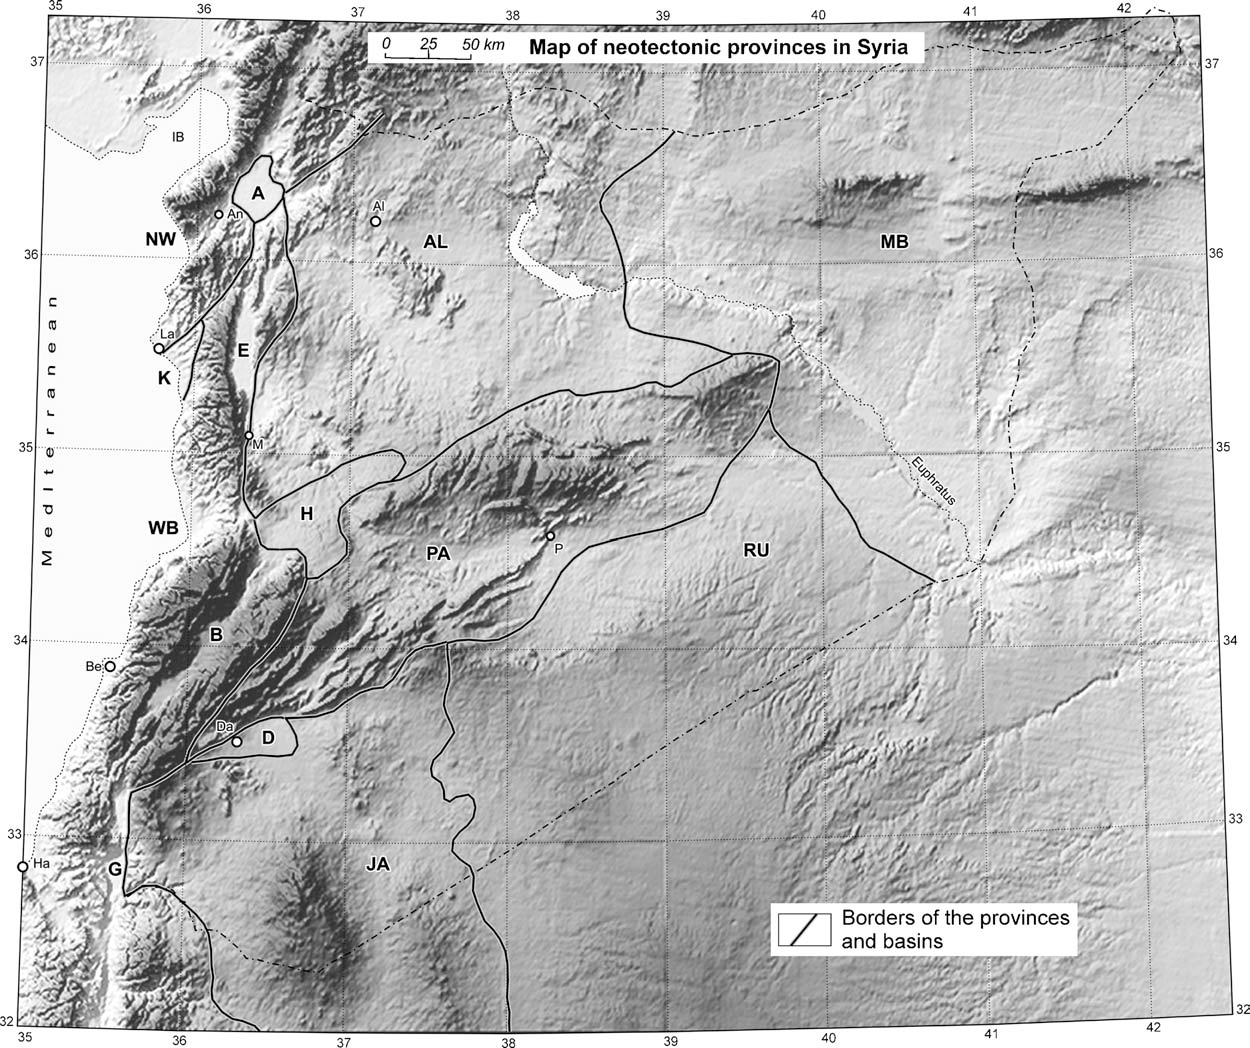
A model of topography and boundaries of the neotectonic provinces in Syria and Lebanon. The provinces:
Rukieh et al (2005) |
Fig. 2 - Rukieh et al (2005) |
| Schematic map of the main neotectonic features |
Schematic map of the main neotectonic features in the convergent and transform boundaries of the Arabian plate. Segments of the Levant fault zone
Rukieh et al (2005) |
Fig. 7 - Rukieh et al (2005) |
| Active faults in Syria |

Active faults in Syria and adjacent territories.
Rukieh et al (2005) |
Fig. 12 - Rukieh et al (2005) |
| topography and boundaries of the neotectonic provinces |
 Fig. 13
Space imagery (Space Image Atlas of Syria, 1996) and interpreted active faults of the Levant fault zone segment near town of Missyaf.
Rukieh et al (2005) |
Fig. 13 - Rukieh et al (2005) |
| Overall structure of DSF |
 Fig. 1
Overall structure of the Dead Sea Fault Zone (DSFZ). The present-day triple junction between the African, Arabian and Anatolian plates is located at Maras in the Bitlis belt, or east of Cyprus, according to various interpretations (see text). Frame shows the location of the study area. Chorowicz et al (2005) |
Fig. 1 - Chorowicz et al (2005) |
| SOG to Homs Basalts |
 Fig. 2
Structure of the Dead Sea Fault Zone from the Sea of Galilee to the El- Ghab basin, and location of the Homs basalts. Chorowicz et al (2005) |
Fig. 2 - Chorowicz et al (2005) |
| Geological Map |
 Fig. 3
Synthetic geological map digitized in MapInfo, which comprises all the outcrops of the Homs basalts. Extracts from the Geological Map of Syria at 1:200 000, sheets Homs and Hama (Ponikarov et al. 1963a, b), and from the Carte Geologique de la Republique Libanaise at 1:50 000, sheets Tell-Kalakh and Hamidiye´ –Halba (Guerre 1968, 1975). Chorowicz et al (2005) |
Fig. 3 - Chorowicz et al (2005) |
| Sat Map Homs Basalts |
 Fig. 5
ERS SAR image (positive print) of the Homs basalts area and northern end of the Lebanon Mountains. The northwestern tip of the Shin volcano is displaced c. 16 km left-laterally. The topographic northern ends of the Eastern and Western Lebanon Mountains, separated by the Yammuneh fault, are offset c. 11 km. PA1–PA4, pull-apart structures. Chorowicz et al (2005) |
Fig. 5 - Chorowicz et al (2005) |
| Shin Volcanoe faulting |

Analysis of a Landsat Thematic Mapper image. (a) Black and white display of a colour composite image extracted from a Landsat TM view acquired on 21 September 1995, using bands TM2, TM4 and TM5. (b) Structural analysis of the image, showing the main active faults and the volcanic ridges (stripped lines) on top of the Shin volcano, indicating NE–SW extension (large white arrows). F1, F2 and f are faults; PA3 is a pull-apart structure that opened between faults F1 and F2; 1–8 are sites of structural observations in the field arrows are horizontal component of movement directions observed on the slickensides (see Fig. 9). Fine black lines are tributaries displaced as a result of fault motion. Chorowicz et al (2005) |
Fig. 7 - Chorowicz et al (2005) |
| Overall Scheme DSF |
 Fig. 11
Overall scheme of the Dead Sea Fault Zone, comprising four segments; from south to north, these are
Chorowicz et al (2005) |
Fig. 11 - Chorowicz et al (2005) |
| Simplified Geol. Map |

Simplified geology map of the northern Dead Sea Fault System (modified from [50]) Abbreviations
Gomez et al (2006) |
Fig. 1 - Gomez et al (2006) |
| Central DSF |

Shaded relief and simplified neotectonic interpretation of the central Dead Sea fault system on shaded relief image Faults
Gomez et al (2006) |
Fig. 3a - Gomez et al (2006) |
| Northern DSF |
 Fig. 5a
Simplified neotectonic interpretation of the northern DSFS on shaded relief image (see Figure 2 for location). See Figure 3 for an explanation of symbols. Gomez et al (2006) |
Fig. 5a - Gomez et al (2006) |
| Damascus Region |
 Fig. 9
Shaded topography image of the Damascus region encompassing the Serghaya fault. Large drainage offsets are prominent along the Serghaya fault. Antecedent streams drain from the Anti Lebanon Mountains eastward across Jebel Kassioun (the westernmost fold of the Palmyride Fold Belt), indicating that late Cenozoic uplift and folding of the western Palmyrides postdates the initiation of the last episode of uplift in the Anti Lebanon Mountains. ZV = Zebadani Valley. White arrows denote large stream deflections . See Figure 3 for location. Gomez et al (2006) |
Fig. 9 - Gomez et al (2006) |
Active Fault Map Quadrangles (click on map to open)
Updating of Active Fault Map of Turkey and its Database (Archived Project on Research Gate - 72 references including quadrangle maps)
| Description | Image | Source |
|---|---|---|

|
Active Fault Map - E Med. | Fig 2 - Duman et al (2018) |

Emre et al (2018) |
Active Fault Map - E Med. | Fig 1 - Emre et al (2018) |
 Active Fault Map of Turkey with an Explanatory Text
1:1,250,000 Scale |
Active Fault Map - Turkey | Active Fault Map of Turkey with an Explanatory Text 1:1,250,000 Scale |
|
Active Fault Map of Turkey with an Explanatory Text 1:1,250,000 Scale |
Active Fault Map - Turkey (Big) | Active Fault Map of Turkey with an Explanatory Text 1:1,250,000 Scale |
 Active Fault Map of Turkey
Antakya Quadrangle 1:250,000 Scale |
Active Fault Map - Antakya Quadrangle | Active Fault Map of Turkey Antakya Quadrangle 1:250,000 Scale |
 Figure 3a - Spatial distribution of the active faults of Turkey. Each fault or fault segment was defined by an identification number.
The fault segments were numbered with sub class numbers. In this notation the first number shows that the fault has multi-segments,
a fault system or a zone, the second number indicates the fault segment. The identification numbers of the faults associated with the names are in Table 1.
Figure 3a - Spatial distribution of the active faults of Turkey. Each fault or fault segment was defined by an identification number.
The fault segments were numbered with sub class numbers. In this notation the first number shows that the fault has multi-segments,
a fault system or a zone, the second number indicates the fault segment. The identification numbers of the faults associated with the names are in Table 1.
Emre et al (2018) |
Active Faults - W Turkey | Fig 3a - Emre et al (2018) |
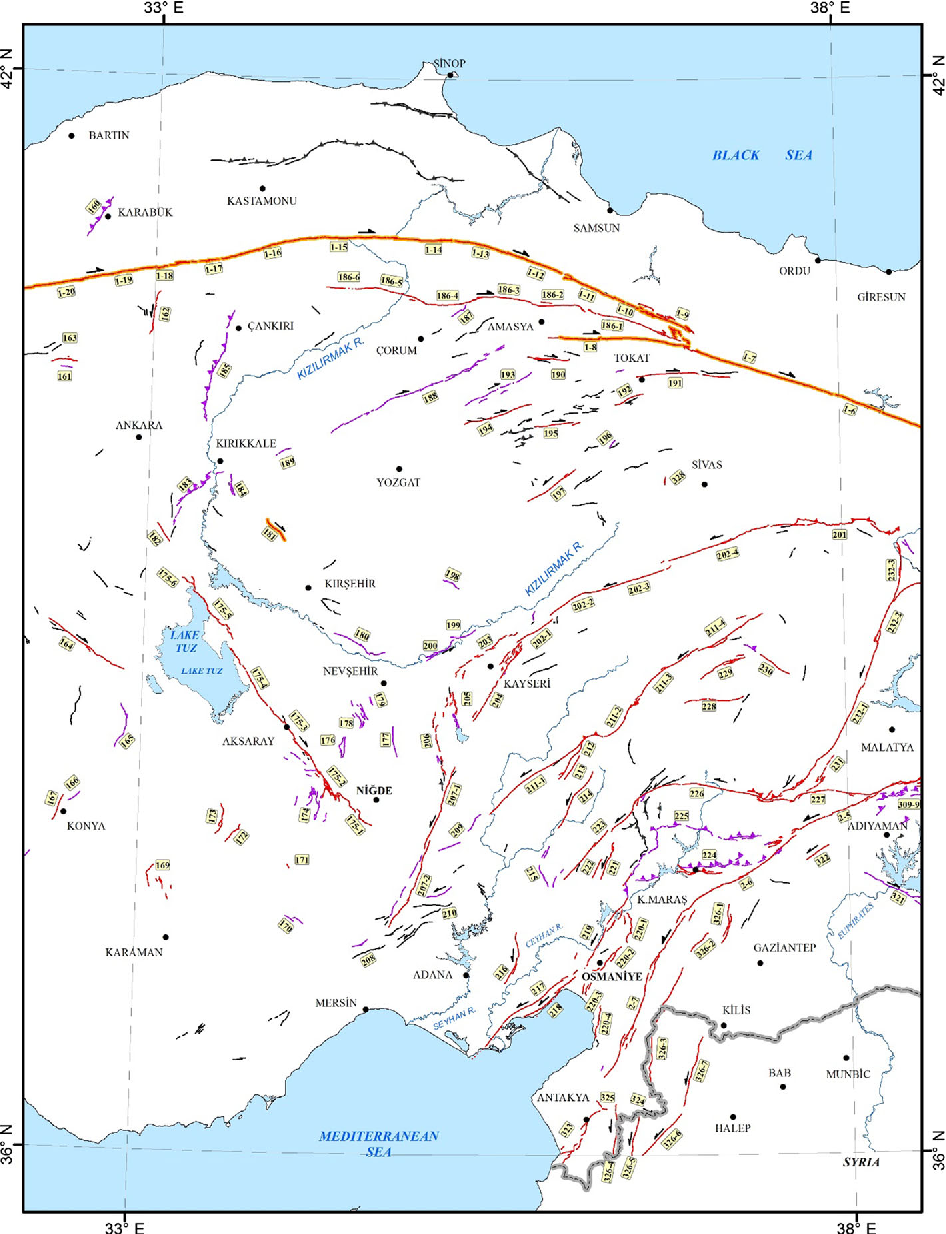 Figure 3b - Spatial distribution of the active faults of Turkey. Each fault or fault segment was defined by an identification number.
The fault segments were numbered with sub class numbers. In this notation the first number shows that the fault has multi-segments,
a fault system or a zone, the second number indicates the fault segment. The identification numbers of the faults associated with the names are in Table 1.
Figure 3b - Spatial distribution of the active faults of Turkey. Each fault or fault segment was defined by an identification number.
The fault segments were numbered with sub class numbers. In this notation the first number shows that the fault has multi-segments,
a fault system or a zone, the second number indicates the fault segment. The identification numbers of the faults associated with the names are in Table 1.
Emre et al (2018) |
Active Faults - Central Turkey | Fig 3b - Emre et al (2018) |

Emre et al (2018) |
Active Faults - E Turkey | Fig 3c - Emre et al (2018) |
| Table 1 | Table 1 - for Fig 3 a,b,c | Table 1 - Emre et al (2018) |

|
Fault Bend Systems NW Anatolia | Fig 4 - Emre et al (2018) |
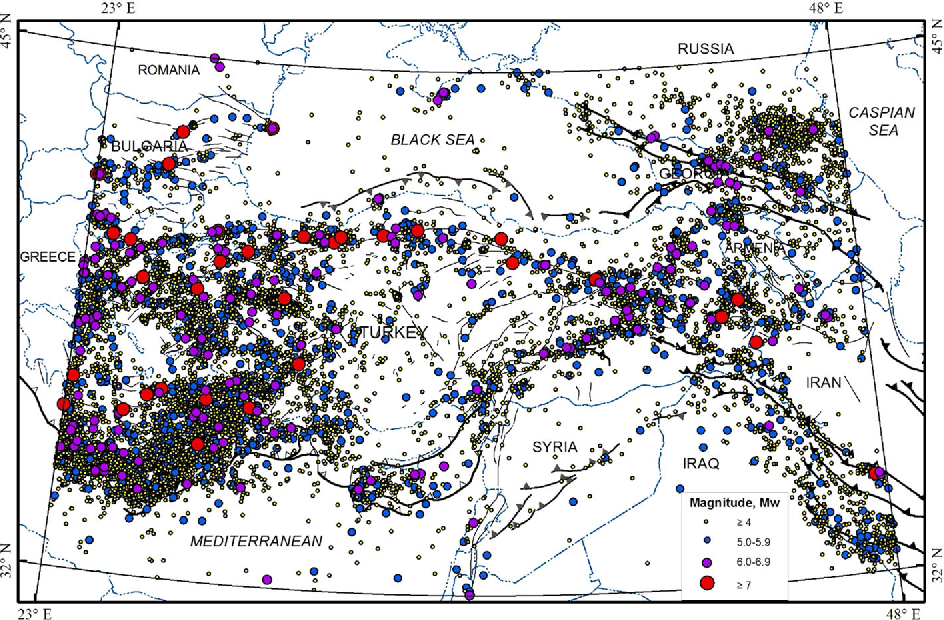 Figure 4
Seismicity of Anatolia region, 1900–2012, Mw, C 4.0. Faults are as in Fig. 2 Duman et al (2018) |
Seismicity in Turkey vs. Mw | Fig 4 - Duman et al (2018) |
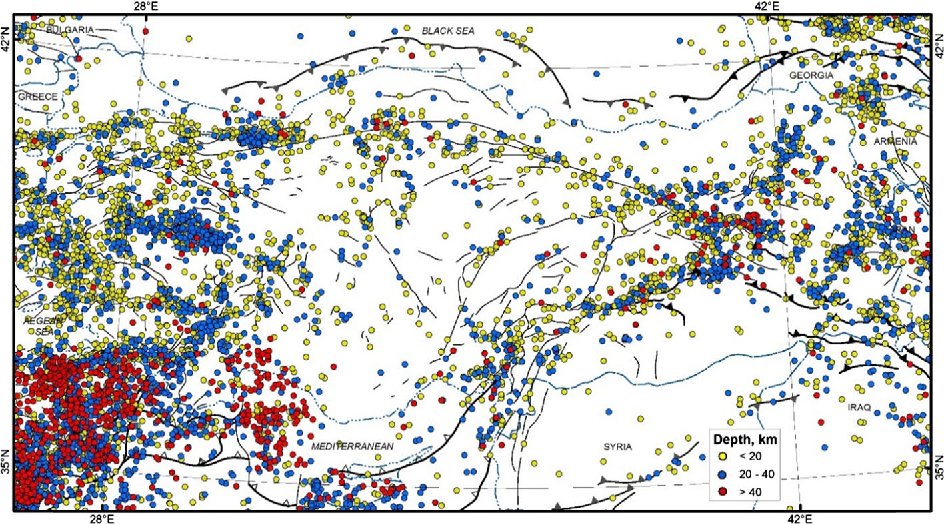 Figure 5
The distribution of the seismicity according to the focal depth across Turkey and surrounding region, 1900–2012, Mw C 4.0 (from Duman et al. 2016) Emre et al (2018) |
Focal Depth Seismicity in Turkey |
Fig 5 - Emre et al (2018) |
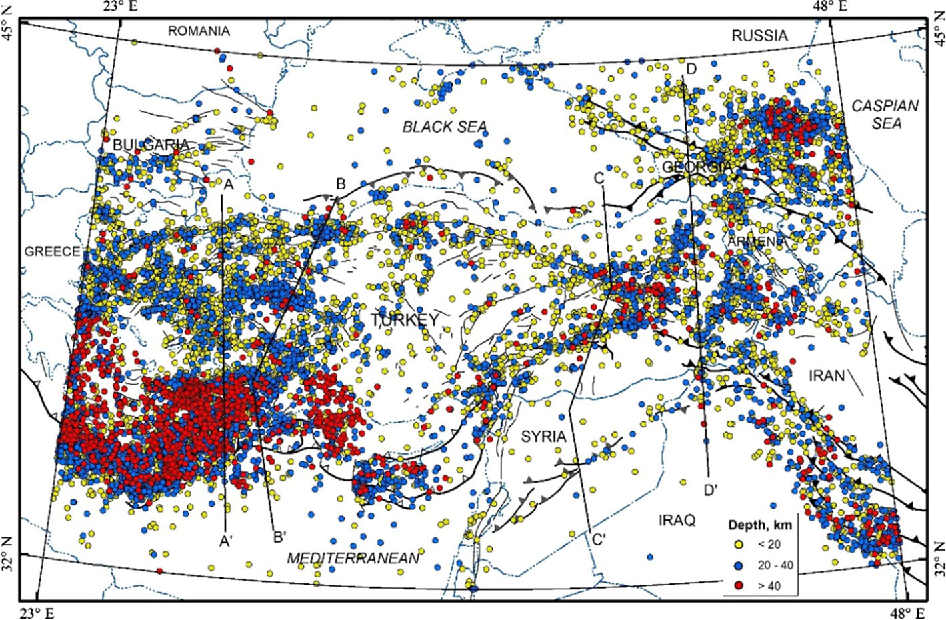 Figure 9
Based on focal depth, distribution of the seismicity across Turkey and surrounding region, 1900–2012, Mw. Faults are as in Fig. 2. The lines with labelled A–A 0, B–B0, C–C0 and D–D0 are locations of the cross sections given in Fig. 10 Duman et al (2018) |
Focal Depth Seismicity in Turkey |
Fig 9 - Duman et al (2018) |

Crustal thickness cross sections across from Pontides to Tauride and Anatolide to Arabian platform across Turkey.
Duman et al (2018) |
Crustal Cross-Sections | Fig 8 - Duman et al (2018) |
 Figure 6
Map showing distributions of the lower hemisphere equal area projection plots of the focal mechanism solutions of earthquakes and active faults in and surrounding Turkey. The size of each ‘beachball’ is related to the earthquake magnitude. Faults are as in Fig. 2 Duman et al (2018) |
Focal mechanism map | Fig 6 - Duman et al (2018) |
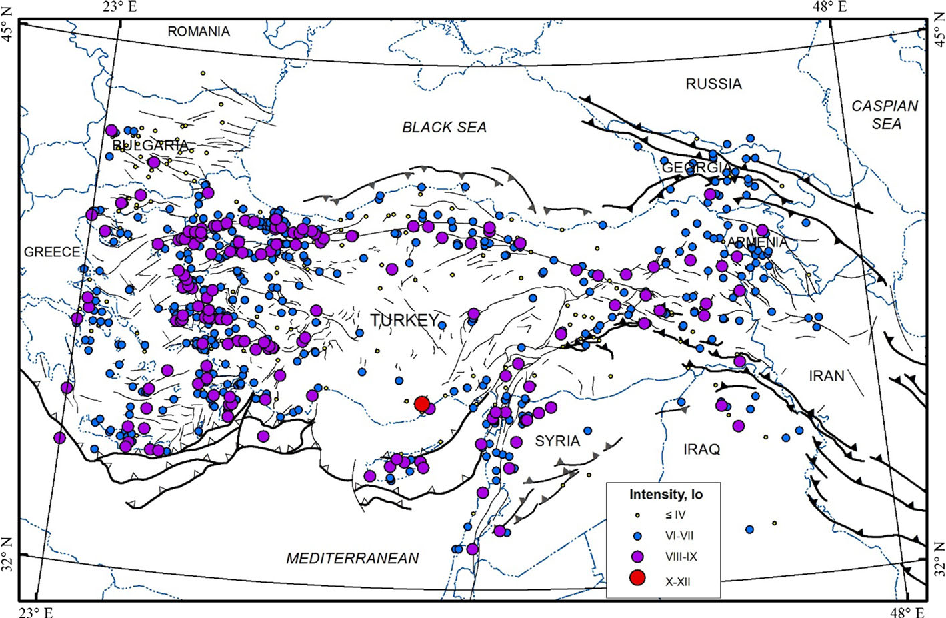 Figure 5
Historical earthquake distribution across Turkey and surrounding region, BC 2000–AD 1900. Faults are as in Fig. 2 Duman et al (2018) |
Historical Earthquakes in Turkey | Fig 5 - Duman et al (2018) |
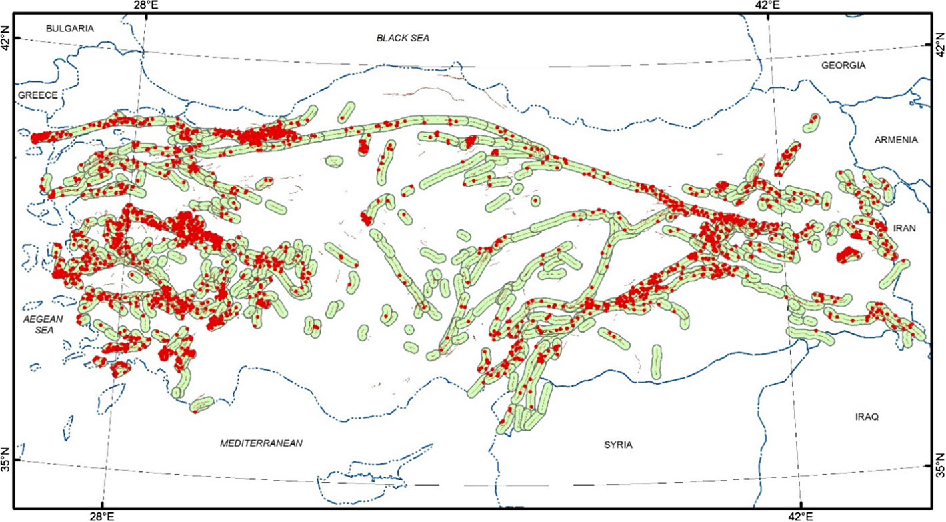 Figure 6
Spatial distribution of earthquakes from 1900 to 2012 larger than Mw C 4.0 within the 8-km wide buffer zones of the active faults. Earthquake data was taken from Kadirioğlu et al. (2016) Emre et al (2018) |
Earthquakes in Turkey (1900-2012) |
Fig 6 - Emre et al (2018) |

Major Turkey seismotectonics domains, defined primarily by seismicity and fault zones with similar characteristics.
Duman et al (2018) |
Seismotectonic domains | Fig 12 - Duman et al (2018) |
 Fig. 1
a) General map of the Dead Sea Fault Zone between the Red Sea in south and East Anatolian Fault Zone (EAFZ) in north. Simplified from Zilberman et al. (2000), Meghraoui et al. (2003) and Westaway (2003) b) DEM of the northern part of the Dead Sea Fault Zone. The Hacıpaşa fault (red line) was drawn on the basis of authors' field observations; other faults (black lines) are taken from Perinçek and Çemen (1990), Lyberis et al.(1992), Yürür and Chorowicz (1998), Rojay et al. (2001) and Westaway (2003). Akyuz et al (2006) |
Amik Basin | Fig 1 - Akyuz et al (2006) |
 Fig. 2
Simplified map of the offset stream beds between the Syrian-Turkish border in south and Amik Basin in north. Note that the western fault does not extend further north of Hacıpaşa town and it does not offset any stream bed. The border between Turkey and Syria is the dashed bold line in south and Asi River. Numbers indicate locations of offset measurements given in Table 2. Map also shows trench locations. Akyuz et al (2006) |
Hacipasa Fault | Fig 2 - Akyuz et al (2006) |
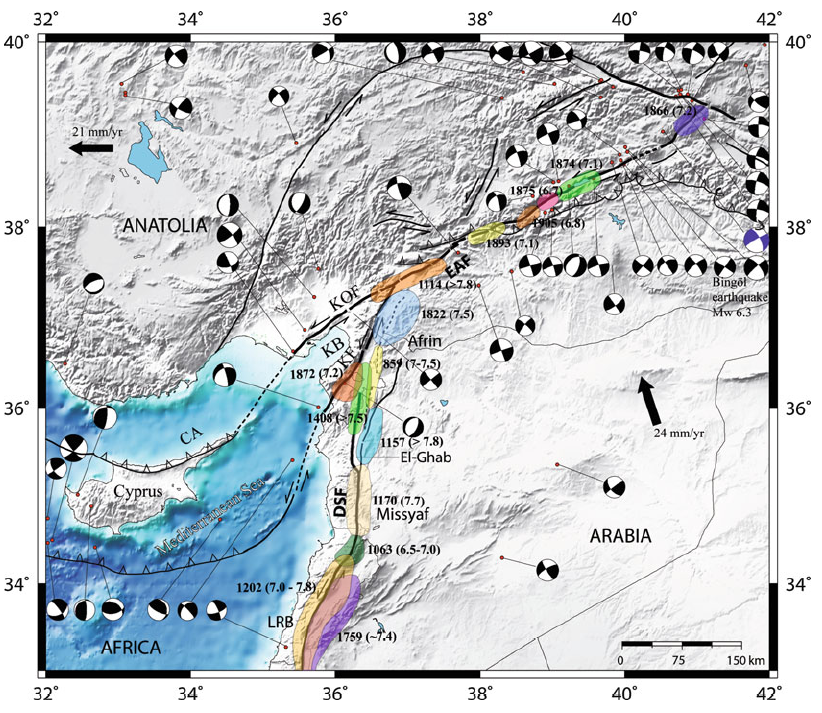 Fig. 8
Meghraoui (2015) |
DST into EAF | Fig 8 - Meghraoui (2015) |
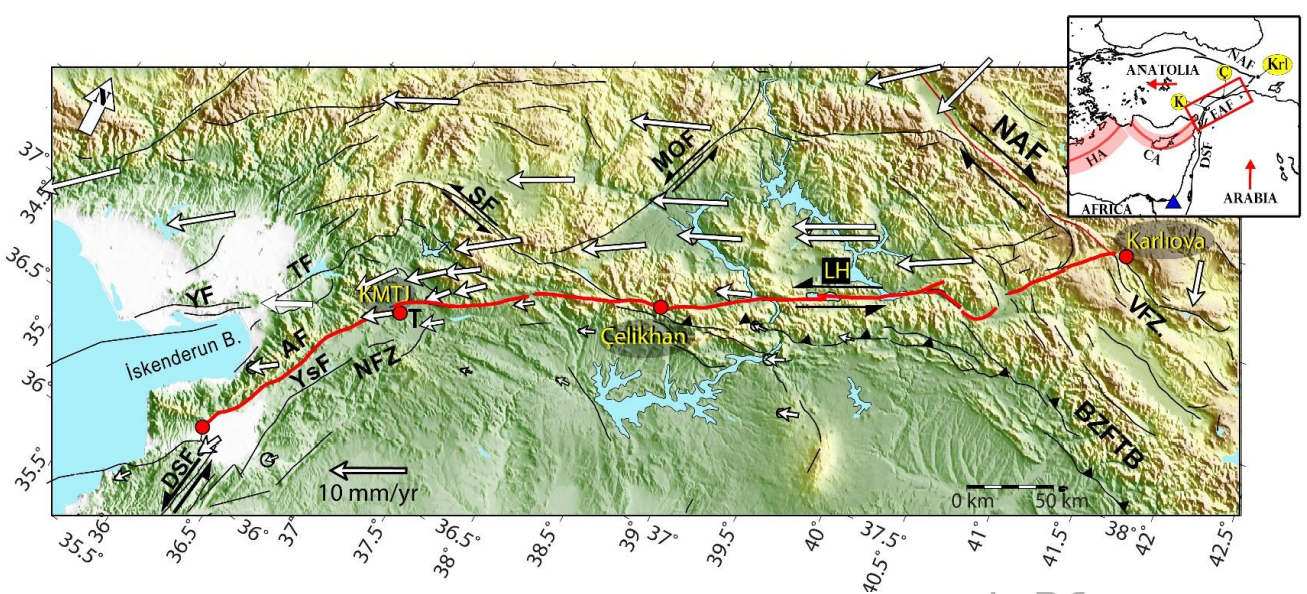
Tectonic setting of the study region with shaded topography. North direction is indicated on the top left. Thick and thin red lines show the East and North Anatolian Faults, respectively. Secondary faults are shown by thin black lines (Emre et al., 2013). Black arrows on the fault traces indicate the relative motion of the faults. White arrows indicate the GPS velocities with Arabia fixed reference frame (Reilinger et al., 2006). (Inset) Figure shows the major plate boundaries surrounding the study region. Red arrows represent direction of the plate motions of Anatolia and Arabia. Hellenic and Cyprus Arcs are shaded in red. Blue triangle represents the position of the Euler pole from Bletery et al., (2020). Study region is bounded by the red box. For simplicity, we refer to the SW and NE of the EAF in the text as west and east, respectively.
|
Tectonic Setting - EAF | Fig 1 - Güvercin et al (2022) |

Fault segmentation based on the historical earthquakes and geology along the EAF and the faults further west of KMTJ (Duman and Emre, 2013). The major structural features, e.g., releasing and restraining bends, are also shown. The colored bands indicate the segments of the EAF:
Güvercin et al (2022) |
Fault segmentation - EAF | Fig 2 - Güvercin et al (2022) |

(a) Map view and (b) Depth section of the seismicity along the EAF during the period 2007– 2019. Earthquakes greater than M2.5 around the fault trace are shown by colored circles colors based on the segment that they belong. The depth section includes seismicity ±15km around the fault trace at surface. Faults are shown by black lines (Emre et al., 2013). Numbers on the map are the ID’s of the events with M>5 which are represented by yellow stars. Red dashed lines indicate segment boundaries as introduced in Figure 2. White stars represent the locations of the near-repeating earthquakes (Konca et al., 2021).
Güvercin et al (2022) |
Seismicity - EAF | Fig 3 - Güvercin et al (2022) |
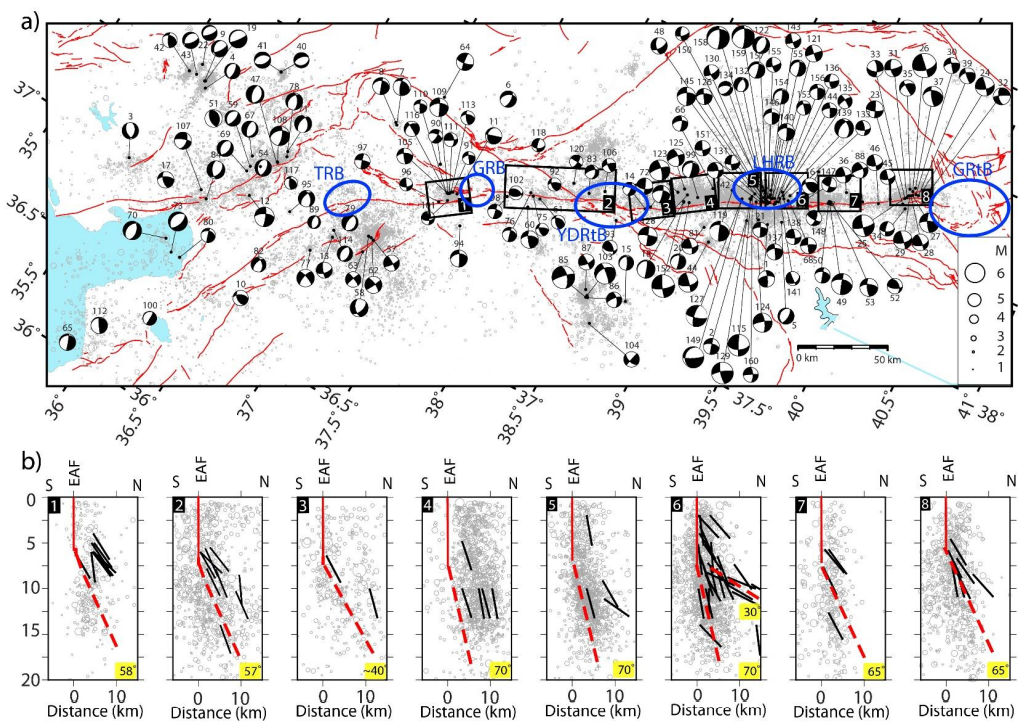
a) Moment tensor solutions of 160 events with magnitudes M>3.7 obtained in this study. ID number of each solution is above the beach ball and the source parameters are presented in Table S2. Blue ellipses mark the geometrical complexities in Figure 2. Black boxes bound the area of each depth cross section in (b). b) Fault perpendicular cross sections of the seismicity and dip of the fault plane solutions. The dip variations are displayed, from west to east
The earthquakes projected to the profiles within ±15 width in related boxes in (a). Box numbers are at the upper left corner of each depth profile. Black lines indicate the dip angles for the selected fault plane parallel to EAF in each box in (a). Solid red lines show the location of the EAF. Dashed red lines show the average dip angle from the earthquake source mechanisms. The average dip angle is at the lower right corner of each cross section panel. Güvercin et al (2022) |
Moment tensor solutions - EAF | Fig 7 - Güvercin et al (2022) |
| Description | Image | Source |
|---|---|---|
 Fig. 3
Dead Sea fault trace from the detailed mapping of individual segments using aerial and satellite photographs combined with field investigations. The fault detailed mapping is from the results of the APAME Project (APAME 2007). Various late Holocene offsets from published works are indicated along with geological offsets (e.g., 107-km left-lateral offset of the erosion surface of late Jurassic units; see text for references). Topography data is from SRTM (3-arc-second) Meghraoui (2015) |
Entire DST | Fig 3 - Meghraoui (2015) |
|
Figure 7 Quaternary fault map of Israel. Colours indicate the corresponding criterion for each fault. Inferred subsurface faults are marked by dashed lines. Abbreviations are for the main strike-slip segments of the DST. Sharon et al (2020) |
Quaternary Fault Map | Fig 7 - Sharon et al (2020) |
 Figure 1
Tectonic sketch map (after Picard, 1943;Bartov, 1990). Karcz (2004) |
Tectonic sketch map | Fig 1 - Karcz (2004) |

(a) The Dead Sea fault segments, Fault mapping and slip rates from (Gomez et al., 2007; AU1 Khair et al., 2000; Meghraoui, 2015; Westaway, 2004) Abbreviations for some key tectonic features:
Abou Karaki et al. (2022) |
Dead Sea Fault Segments + Seismicity | Fig 25.1 - Abou Karaki et al. (2022) |
| Description | Image | Source |
|---|---|---|
| Common Geologic Map Symbols |
 Fig. 4-54
Common symbols representing geologic features on geologic maps. Concepts illustrated describe strike and dip for describing the orientation of strata (beds), and illustrations of structural features (folds and faults). Introduction to Physical Geology (miracosta.edu) |
Fig. 4-54 - Introduction to Physical Geology (miracosta.edu) |
| Reverse and Thrust Faults |
 Figure 10.3.4
Block model and corresponding plan view depictions of reverse (a) and normal (b) faulting. Black arrows on the south-facing side of each block indicate the sense of displacement along the fault. Symbols in plan view indicate the type of fault and are always drawn on the hanging wall side Introduction to Physical Geology (miracosta.edu) |
Figure 10.3.4 - A Practical Guide to Introductory Geology by Siobhan McGoldrick |
Earthquake Related
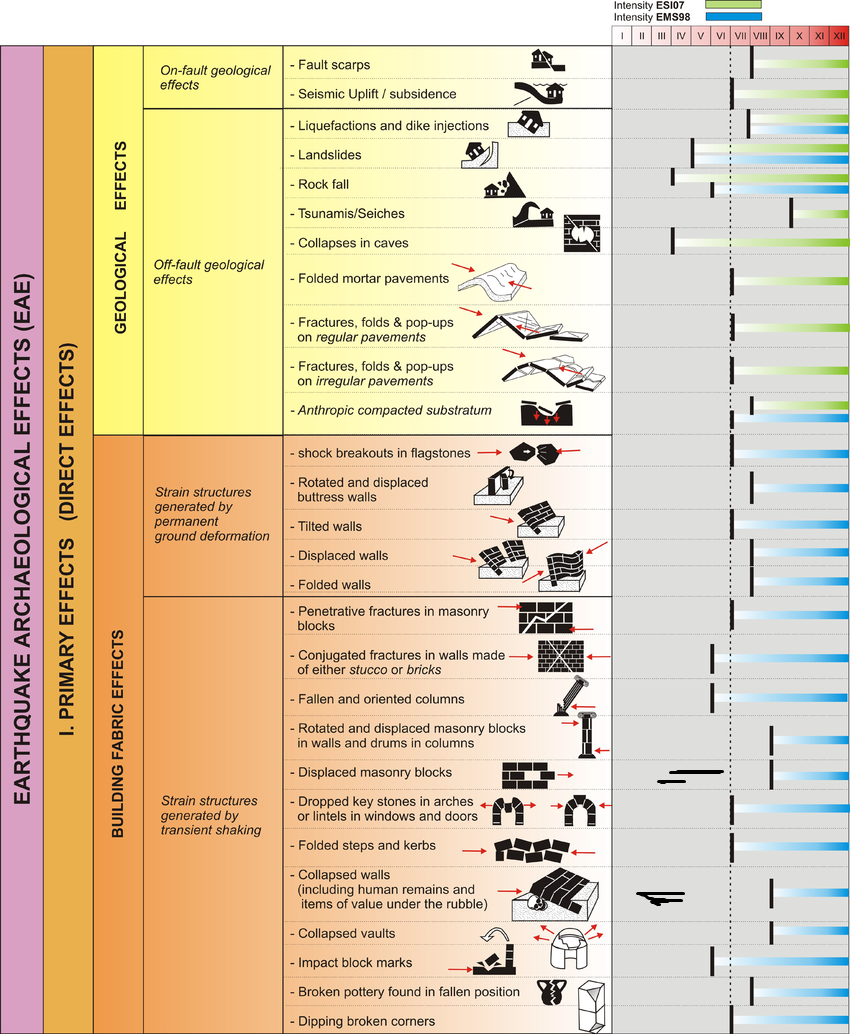 Earthquake Archeological Effects Chart
Rodríguez-Pascua et al (2013)
 Potential earthquake archaeological effects (PEAEs) on Minoan remains. Adapted from Rodríguez-Pascua et al. (2011) and
Macdonald (2001), completed by Warren (1991), Knappett and Cunningham (2003), and Rucker and Niemi (2010). See text for further
explanation.
Potential earthquake archaeological effects (PEAEs) on Minoan remains. Adapted from Rodríguez-Pascua et al. (2011) and
Macdonald (2001), completed by Warren (1991), Knappett and Cunningham (2003), and Rucker and Niemi (2010). See text for further
explanation.
Jusseret et al. (2013)
- from Amos Salamon
 Graphic Representation of ESI 2007 Intensity
click on image to open a higher resolution version in a new tab
 Plate I
Synoptic Table of ESI 2007 Intensity Degrees - The accuracy of the assessment improves in the higher degrees of the scale, in particular in the range of occurrence of primary effects, typically starting from intensity VIII, and with growing resolution for intensity IX, X, XI and XII. Hence, in the yellow group of intensity degrees (XI-XII) they become the most effective tool for intensity assessment.
click on image to open a higher resolution version in a new tab
Michetti et al. (2007)
 Table 1
Ranges of surface faulting parameters (primary effects) and typical extents of total area (secondary effects) for each intensity degree.
Michetti et al. (2007)
 Table 2
Diagnostic range of intensity degrees for each class of environmental effects.
Michetti et al. (2007)
- from ?
 Simple MMI Intensity Scale
- from ?
 More Subjective MMI Intensity Scale
- from Abdelmonem (2014)
 Table 3.8
Correlation of PGA with the
Instrumental Intensity scale
and Richter scale
Abdelmonem (2014)
Focal Mechanisms vs. Fault TypeWikipedia
Mikenorton - CC BY-SA 3.0
Development of the FocalMechanism Beach Ball
Wikipedia
Mikenorton - CC BY-SA 3.0
| Description | Image | Source |
|---|---|---|
| Earthquake Archeological Effects |
Earthquake Archeological Effects Chart
Rodríguez-Pascua et al (2013) |
Rodríguez-Pascua et al (2013: 221-224) |
| Environmental Effects (ESI 2007) |
Graphic Representation of ESI 2007 Intensity click on image to open a higher resolution version in a new tab |
|
| Synoptic Table of ESI 2007 Intensity Degrees |
Plate I Synoptic Table of ESI 2007 Intensity Degrees - The accuracy of the assessment improves in the higher degrees of the scale, in particular in the range of occurrence of primary effects, typically starting from intensity VIII, and with growing resolution for intensity IX, X, XI and XII. Hence, in the yellow group of intensity degrees (XI-XII) they become the most effective tool for intensity assessment. Michetti et al. (2007) |
Michetti et al. (2007) |
| Surface Faulting vs. Intensity |
Table 1 Ranges of surface faulting parameters (primary effects) and typical extents of total area (secondary effects) for each intensity degree. Michetti et al. (2007) |
Michetti et al. (2007) |
| Environmental Effects vs. Intensity |
Table 2 Diagnostic range of intensity degrees for each class of environmental effects. Michetti et al. (2007) |
Michetti et al. (2007) |
| Simple MMI Intensity Scale |
Simple MMI Intensity Scale
|
|
| More Subjective MMI Intensity Scale |
More Subjective MMI Intensity Scale |
|
| Intensity vs. PGA |
Table 3.8 Correlation of PGA with the Instrumental Intensity scale and Richter scale Abdelmonem (2014) |
Abdelmonem (2014) |
| Focal Mechanisms |
 Focal Mechanisms
Wikipedia Mikenorton - CC BY-SA 3.0 |
Focal Mechanisms - Wikipedia |
| Focal Mechanisms vs. Fault Type |
Focal Mechanisms vs. Fault Type Wikipedia Mikenorton - CC BY-SA 3.0 |
Focal Mechanisms - Wikipedia |
| Development of Beach Ball |
Development of the Focal Mechanism Beach Ball Wikipedia Mikenorton - CC BY-SA 3.0 |
Focal Mechanisms - Wikipedia |
Plate ISynoptic Table of ESI 2007 Intensity Degrees - The accuracy of the assessment improves in the higher degrees of the scale, in particular in the range of occurrence of primary effects, typically starting from intensity VIII, and with growing resolution for intensity IX, X, XI and XII. Hence, in the yellow group of intensity degrees (XI-XII) they become the most effective tool for intensity assessment.
click on image to open a higher resolution version in a new tab
Michetti et al. (2007)
- from Amos Salamon
Graphic Representation of ESI 2007 Intensityclick on image to open a higher resolution version in a new tab
Table 1Ranges of surface faulting parameters (primary effects) and typical extents of total area (secondary effects) for each intensity degree.
Michetti et al. (2007)
Table 2Diagnostic range of intensity degrees for each class of environmental effects.
Michetti et al. (2007)