Petra - Pool Complex
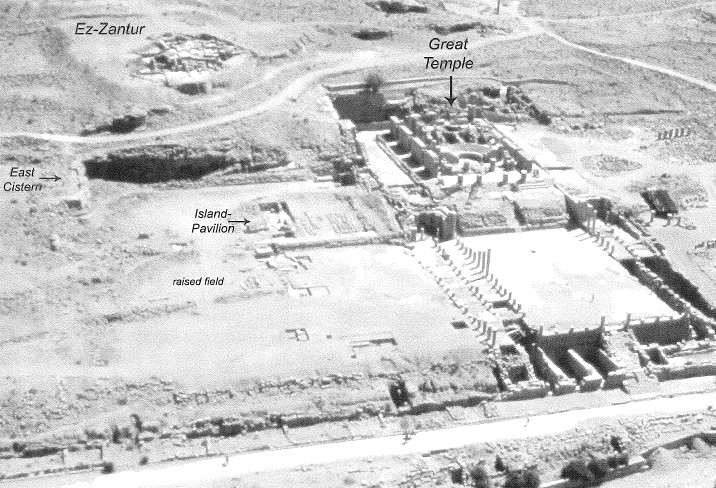 Figure 3
The Petra Garden and Pool Complex (left) and the Great Temple (right), 2004 (photo by S. Karz Reid).
Bedal et al (2007)
| Transliterated Name | Source | Name |
|---|---|---|
| Pool Complex | ||
| Lower Market |
- Fig. 2 - Location Map
from Jones (2021)
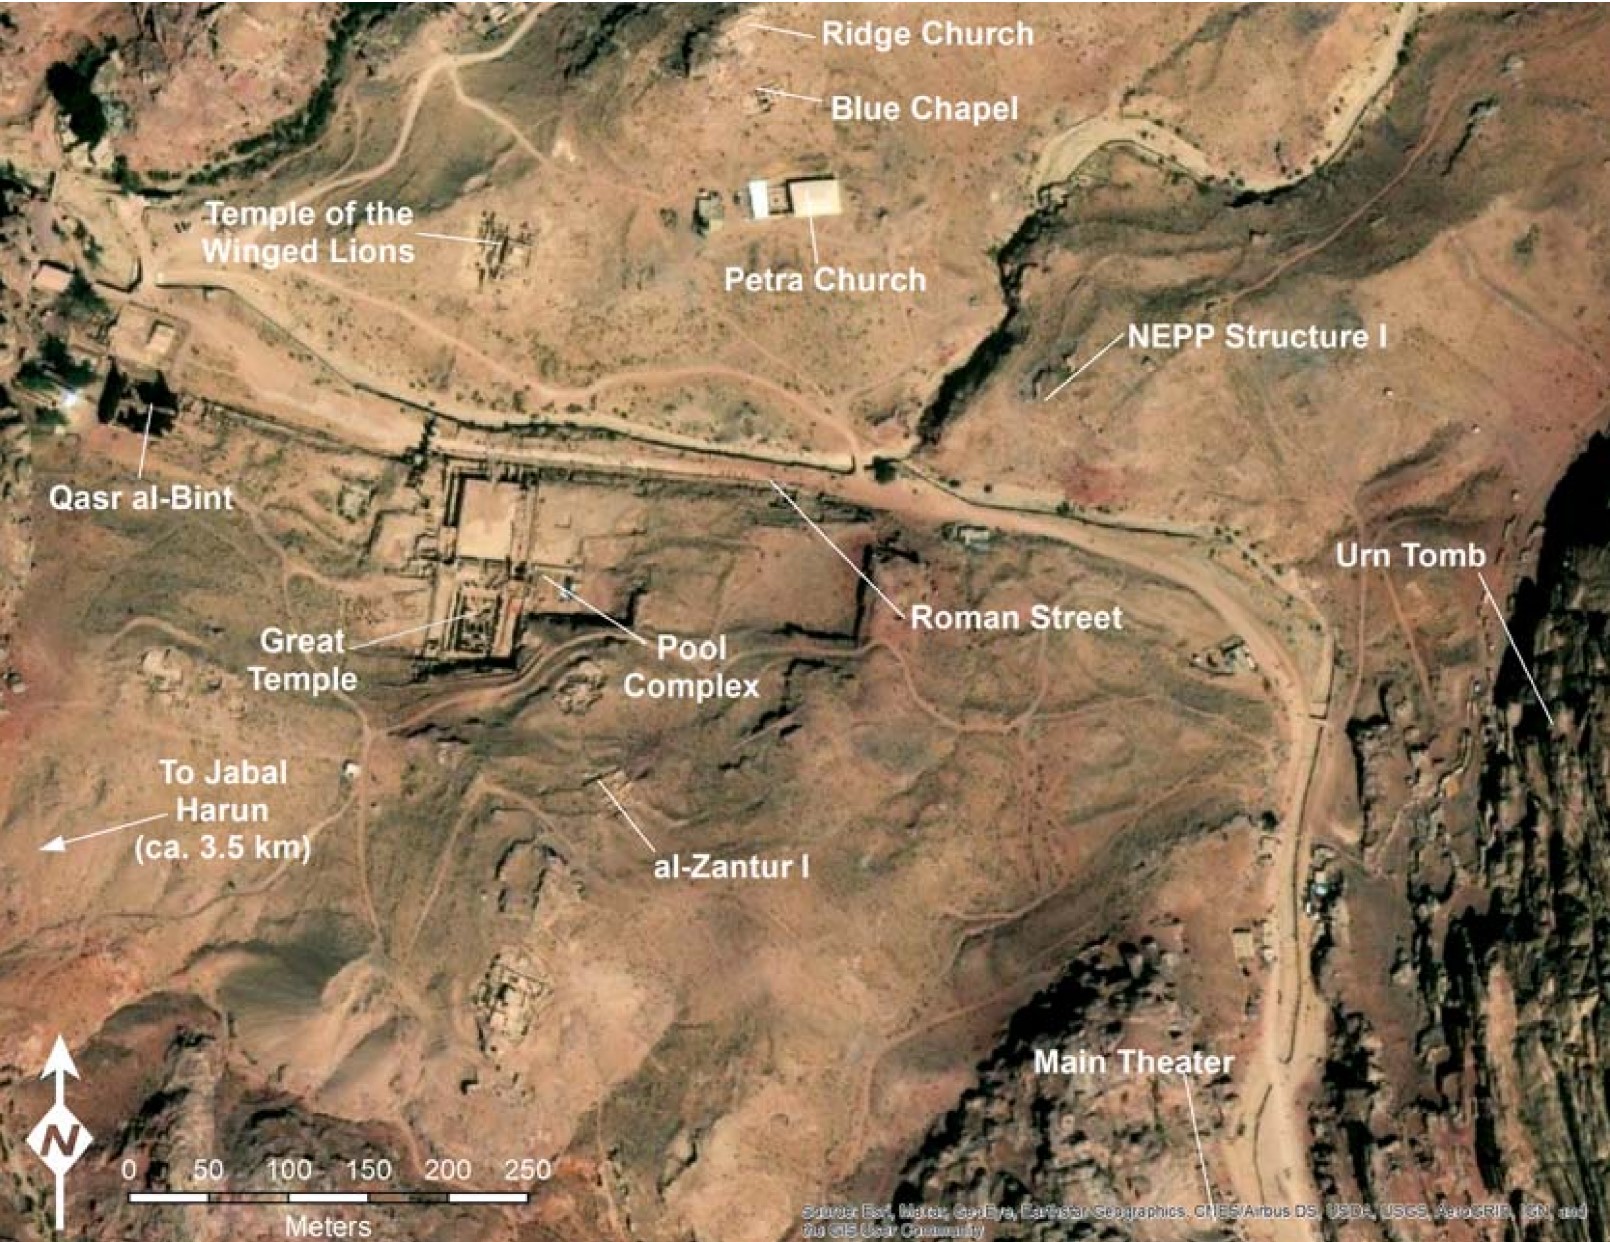 Figure 2
Map of Petra with the locations of major excavations marked
Jones (2021)
Basemap: Esri, Maxar, Earthstar Geographics, USDA FSA, USGS, Aerogrid, IGN, IGP, and the GIS User Community
- Petra Pool Complex location in Google Earth
 Petra Pool Complex location in Google Earth
click on image to explore this site on a new tab in Google Earth - Plate I - Aerial photograph
of Petra's City Center from Bedal (2003)
 Plate I
Aerial photograph of Petra's City Center, looking east (1998)
Bedal (2003)
- Fig. 5 - Plan of Petra's city center
illustrating phases for the initial construction of major monuments during Nabataean and Roman periods from Bedal (2003)
 Figure 5
Plan of Petra's city center illustrating the three major phases for the initial construction of it's major monuments during the Nabataean and Roman periods
Bedal (2003) - Fig. 8 - Location of Trenches 1-4
from Bedal (2003)
 Figure 8
Site plan from 1998 showing the location of the excavation trenches in relation to major architectural features and the Great Temple, Phase I.
- Trench (TR) 1 was laid out to expose the northwest comer of the rectangular structure located at the center of the plateau
- Trench 2 provided limited exposure of the low stone wall at the corner of the earthen terrace
- Trenches 3 and 4 revealed important features along the East-West Wall
(P. Zimmerman and L. Bedal)
Bedal (2003) - Fig. 5 - Site Plan from
Bedal et al (2007)
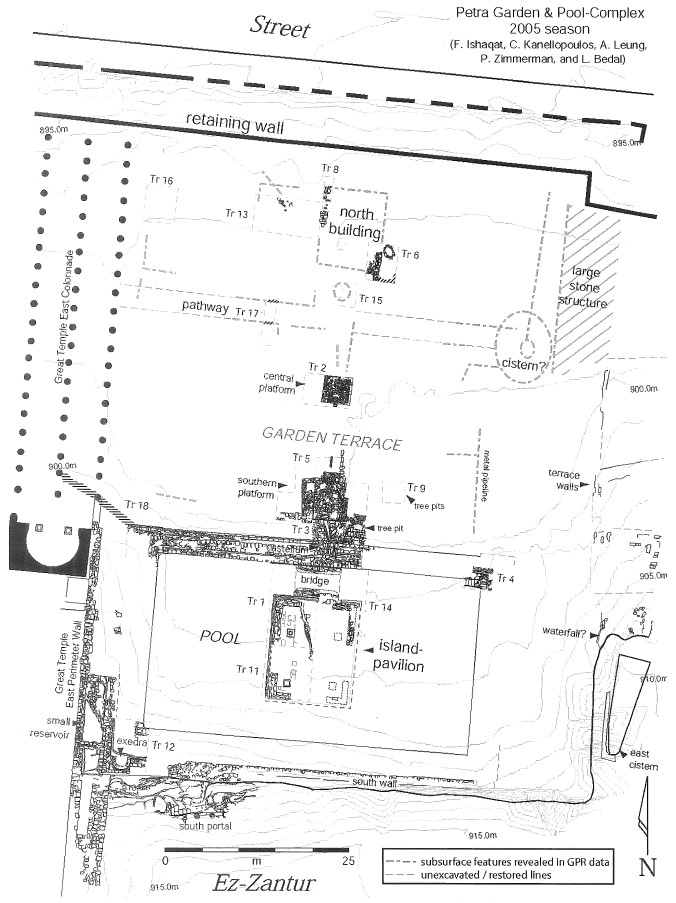 Figure 5
Site plan
Bedal et al (2007) - Fig. 1 - Site Plan from
Bedal et al (2011)
 Figure 1
Site plan
Bedal et al (2011) - Fig. 6.64b - Cut-away isometric
reconstruction of Pool island-pavillion from Rababeh (2005)
 Fig. 6.64b
Cut-away isometric reconstruction, showing the four columns supporting the bearer beams, the details of the flat roof, and the vaulted bridge
(Bedal 2001: Fig.9)
Rababeh (2005)
- Fig. 5 - Site Plan from
Bedal et al (2007)
Figure 5
Site plan
Bedal et al (2007) - Fig. 1 - Site Plan from
Bedal et al (2011)
Figure 1
Site plan
Bedal et al (2011)
- Fig. 9 - Trench 1 top plan
from Bedal (2003)
 Figure 9
Trench 1 top plan showing the northwestern quarter of the island-pavilion and the western half of each of the bridge piers. A deep sounding reached the bottom of the pool, 2.5 meters below the pavilion's floor level.
Bedal (2003) - Fig. 14 - Trench 3 top plan
from Bedal (2003)
 Figure 14
Trench 3 top plan showing the midpoint of the East-West Wall with several channels leading to the castellum. To the north of the East-West Wall is a pavement under which two stone channels (A and B) carried water northward from the castellum. A later (Roman period?) buttress wall was built up against the northern face of the East-West Wall. A pipeline was installed along the northern face of both walls and across the top of the pavement. Abutting the southern face of the East-West Wall is the northern bridge pier.
Bedal (2003) - Fig. 13 - Trenches 1 and 3
from Bedal (2003)
 Figure 9
Plan of Trenches 1 and 3 showing the northwestern quarter of the island-pavilion and the hydraulic installations (castellum, channels, and pipelines) in the East-West Wall.
Bedal (2003)
- Fig. 9 - Trench 1 top plan
from Bedal (2003)
Figure 9
Trench 1 top plan showing the northwestern quarter of the island-pavilion and the western half of each of the bridge piers. A deep sounding reached the bottom of the pool, 2.5 meters below the pavilion's floor level.
Bedal (2003) - Fig. 14 - Trench 3 top plan
from Bedal (2003)
Figure 14
Trench 3 top plan showing the midpoint of the East-West Wall with several channels leading to the castellum. To the north of the East-West Wall is a pavement under which two stone channels (A and B) carried water northward from the castellum. A later (Roman period?) buttress wall was built up against the northern face of the East-West Wall. A pipeline was installed along the northern face of both walls and across the top of the pavement. Abutting the southern face of the East-West Wall is the northern bridge pier.
Bedal (2003) - Fig. 13 - Trenches 1
and 3 from Bedal (2003)
Figure 9
Plan of Trenches 1 and 3 showing the northwestern quarter of the island-pavilion and the hydraulic installations (castellum, channels, and pipelines) in the East-West Wall.
Bedal (2003)
- Note that Phase numbers in Bedal et al (2007) differ than those in Bedal (2003). Bedal et al (2007)'s phase labels are used here however the sections below come from Bedal (2003)
- Plate XXXIV - Section through
Trenches 1 and 3 showing the stratigraphy from Bedal (2003)
 Plate XXXIV
Section through Trenches 1 and 3 showing the phasing sequence for the site. The stratigraphy represented here is based an a compilation of data obtained from three different sections:
- A-B = the east balk of Trench 1
- C-D = the balk preserved in Trench 3
- E-F = the east balk of the deep sounding in the Pool (see plan inset)
Bedal (2003) - Plate XXXV - E-W Section through
pavillion's interior from Bedal (2003)
 Plate XXXV
Stratigraphic east-west section (I-J) through the pavillion's interior(see plan inset). In Phase VI, a pit was dug through Phase V fill to expose the earlier drain in the pavillion's floor. The accumulation of fill in subsequent periods resulted from further collapse of the pavillion's walls and the run-off from surrounding slopes.
Bedal (2003) - Plate XXXVI - Wrap-around Section
through pavillion's interior from Bedal (2003)
 Plate XXXVI
Stratigraphic section drawing of the deep sounding in the pool, north of the island-pavillion:
- E-F=the east balk
- F-G = the north balk
- G-H = the west balk (see plan inset)
Bedal (2003)
- Fig. 17 - Stratigraphic sequence
from Parr's Trench III in a section across the colonnaded street from Bedal (2003)
 Figure 17
The stratigraphic sequence in Trench III
JW: this section crosses the colonnaded street
(from Parr 1970: Fig.1)
Bedal (2003) - Plate IIb - Aerial photograph
showng location Parr's Trench III from Bedal (2003)
 Plate IIb
View of the "Lower Market" and Great Temple, from the Temple of the Winged Lions, looking south. An arrow points to Trench III from Parr's excavations in 1958-1964
JW: Arrow is small and white about 2/3 down from the top of the photo and adjacent to the [formerly] colonnaded street
Bedal (2003)
- from Bedal (2003)
- Phase numbers in Bedal et al (2007) differ than those in Bedal (2003). Bedal et al (2007)'s phase labels are used here.
 Fig. 16
Chronological sequence of the Petra Pool-Complex, 1998 excavation season.
Bedal (2003)
- from Schmid (1995)
- Ez-Zantur Excavations utilized Nabatean fineware chronology of Schmid (2000) - which I don't currently have access to
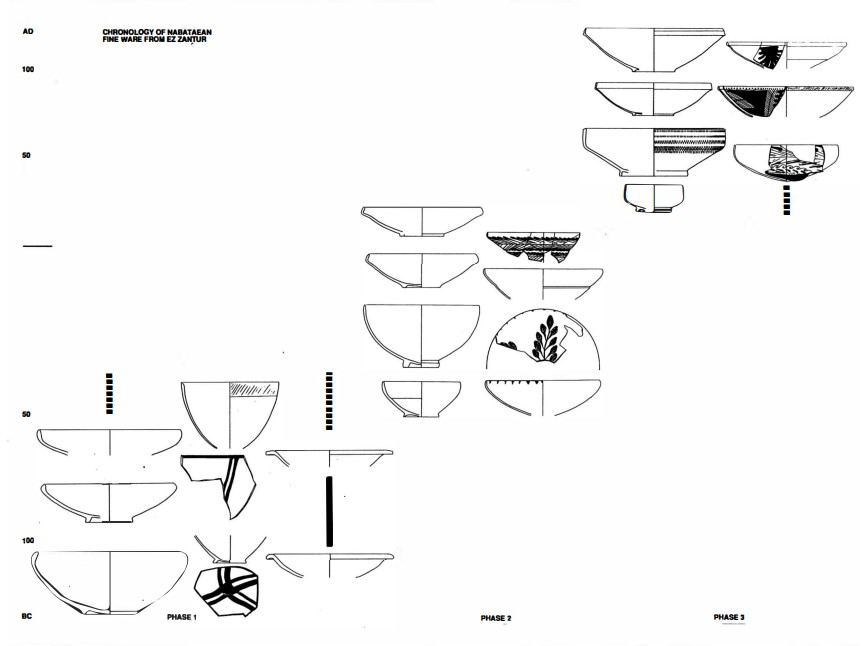
Left
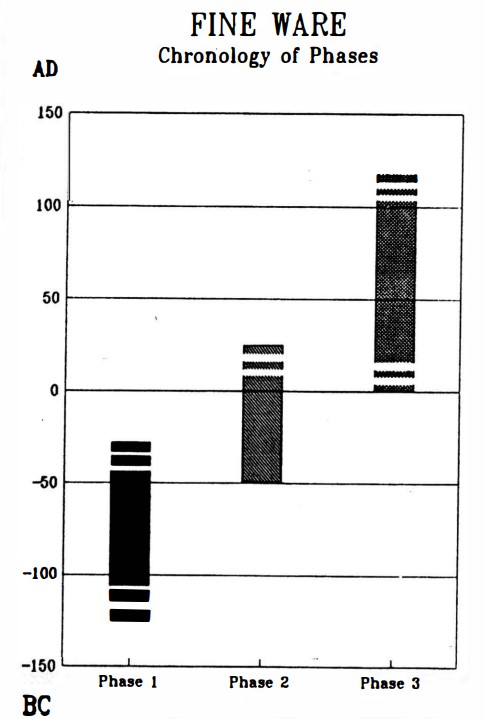
Chronology of Nabatean finewares
Right
Typology and chronology of the Nabataean fine ware
Both from Schmid (1995)
- Fig. 1 - Site Plan from
Bedal et al (2011)
Figure 1
Site plan
Bedal et al (2011)
- Fig. 9 - Re-used Building elements
from Bedal et al (2007)
 Figure 9
Elements of a column and capital used as fill in the Phase III renovations to the southern platform, trench 5
drawn by C. Kanellopolous
Bedal et al (2007)
- Fig. 1 - Site Plan from
Bedal et al (2011)
Figure 1
Site plan
Bedal et al (2011) - Fig. 9 - Trench 1 top plan
from Bedal (2003)
Figure 9
Trench 1 top plan showing the northwestern quarter of the island-pavilion and the western half of each of the bridge piers. A deep sounding reached the bottom of the pool, 2.5 meters below the pavilion's floor level.
Bedal (2003) - Fig. 9 - Trench 1 top plan
from Bedal (2003) (magnified)
Figure 9
Trench 1 top plan showing the northwestern quarter of the island-pavilion and the western half of each of the bridge piers. A deep sounding reached the bottom of the pool, 2.5 meters below the pavilion's floor level.
Bedal (2003)
- Fig. 24 - Two destruction layers
in west baulk of Trench 1 from Bedal et al (2007)
 Figure 24
Trench 1, deep sounding in pool, west baulk. Two destruction layers are clearly visible in the pool fill.
Bedal et al (2007) - Fig. 23 - Stones of Phase V destruction
in north baulk of Trench 12 from Bedal et al (2007)
 Figure 23
Trench 12, from the south. Stones of the Phase V destruction, are clearly visible in the north baulk sandwiched between the Phase IV and Phase VI fills. The Phase VII destruction level is already excavated away at the time of this photo.
Bedal et al (2007)
- Fig. 1 - Site Plan
from Bedal et al (2011)
Figure 1
Site plan
Bedal et al (2011)
- Fig. 5 - Earthquake collapse
at Pool south-west from Bedal et al (2011)
 Figure 5
Pool south-west: delineation of secondary earthquake collapse (foreground) and the back side of the check dam / diversion wall (center, behind James Schryver).
Bedal et al (2011)
The 2009 excavation in pool south-west, supervised by James G. Schryver, consisted of a baulk of overburden composed of alternating strata of earth / rubble wash, earthquake collapse and post-Classical walls apparently constructed to retain the accumulated soil and control water runoff from az-Zanṭūr. The defined area (8 x 9 x 4.5 m) is immediately north of Trench 12 (2004) and runs up against the east face of the Great Temple east perimeter wall (GTEP wall). Careful delineation of the stone fall and constructed walls helped to distinguish the strata of rubble debris from two major earthquake collapses and the construction of a late (post-Classical) wall to support the earth - rubble wash that was coming down from az-Zanṭūr and filling the pool area. The wall revealed itself to be built of two faces of large recycled ashlar stones surrounding a core of rubble stones. The southern ashlar face of the upper portion of this wall had collapsed, revealing a packing of smaller stones (Fig. 5). Further excavation in this area will be necessary to fully understand just how deep into the fill of the pool this wall extends, thereby determining its date and stratigraphic relationship with the earlier architecture.
Evidence for this wall serving as a check dam or terrace wall that was a part of a larger system of soil retention across this part of the site came from our soil specialist, John E. Foss, who noted that the fills against the wall were waterlain and that certain surfaces within the fill may have been cultivated. The east - west wall of the check dam was further integrated with a wall running north - south along the western edge of the pool, directly above the pool’s west perimeter, apparently to direct and divert water along the western edge of the pool area down to the garden terrace which functioned as an agricultural field in later periods. The construction of this wall may be associated with the collapse of the GTEP wall and the resulting redistribution of soils during the winter foods. The proposed cultivation of these soils seems to have been contemporary with a second collapse, as most of the stones from this collapse seem to have been collected and then thrown up against the base of the northern face of check dam in the form of a convex buttress. A later collapse must have occurred once the area was no longer being cultivated as those stones were left in place, spread across the ground surface. These activities are all attributed to PGPC Phases V - VIII (Late Roman - Post-Classical / Medieval).
- Fig. 1 - Site Plan
from Bedal et al (2011)
Figure 1
Site plan
Bedal et al (2011)
- Fig. 6 - Great Temple east
perimeter wall from Bedal et al (2011)
 Figure 6
The Great Temple east perimeter wall separates the Great Temple upper temenos (left) from the pool complex (right).
Bedal et al (2011) - Fig. 7 - Trench 20
from Bedal et al (2011)
 Figure 7
Trench 20: the south end of the brick pool (with steps) built inside an intermural space in the Great Temple east perimeter wall
Bedal et al (2011) - Fig. 8 - Staircase from
garden terrace to pool landing from Bedal et al (2011)
 Figure 8a and 8b
Staircase leading from garden terrace up to the pool-level landing and the door to the foyer (a), which was later narrowed and blocked. A deposit of grey clayey soil covers the lower steps and extends into the Great Temple east exedra
Bedal et al (2011)
Another area that required attention during the 2007 and 2009 field seasons was the western boundary of the pool area that adjoins the Great Temple upper temenos (Fig. 6). The west face of the GTEP wall was uncovered by the Brown University excavations, along with two of the intermural rooms (Room C and the small reservoir)5. However, the continuation of the wall to the north of the small reservoir remained unexcavated.
Trenches 20 and 21 were opened to define the eastern face of the northern extension of the GTEP wall (the southern portion was exposed in 2004, Trench 12) and to begin excavating the intermural spaces. Trench 20 defines a single intermural room immediately to the north of the small reservoir. Work here revealed the upper courses of a baked brick construction that lines the interior walls (dimensions 7.25 x 2.20 m). The walls are single brick width (36 cm) on all sides, with steps measuring a single brick width which measure 36 x 36 x 6 - 8 cm, are poorly fried with heavy chaff and are cemented with a crumbly grey mortar tempered with small pottery fragments (primarily Nabataean fine ware). Diagnostics include Nabataean painted pottery dating to the second century AD providing a terminus ante quem for the construction of this installation in the second quarter of the second century AD. The brick construction is similar to some of the construction in the bath complex west of the Great Temple that has been assigned to the Roman - Byzantine period (Joukowsky 2007: 154-8). It can thus be deduced that the brick feature represents a secondary use of the intermural space within the GTEP Wall dating to the second or third century AD at the earliest. The heavy use of mortar and plaster, in addition to the presence of steps in one corner, suggests its function as a water basin or pool. The center of the basin is badly damaged by a large pit, filled with large stones in a greyish - brown ashy matrix. The trench was closed and sandbagged to protect the poorly preserved bricks pending future study.
Trench 21, located immediately north of Trench 20, measures 3.50 x 11.25 m. Its dimensions are defined by the width of the casemate wall and the length of the space north of Trench 20 to the north face of the pool and the Great Temple east exedra. Excavations began in 2007, defining the line of the east wall and clearing the topsoil and fill and that was heaped up against the west wall. In 2009, excavations continued under the supervision of William A. Caccese and Leigh-Ann Bedal with removal of sandy rubble fill, earthquake collapse and small dividing walls of later date (post-Classical / Medieval) that revealed the remnants of the original Nabataean structure. At the north end, a doorway between the Great Temple’s east exedra and the pool leads to a well-preserved staircase constructed of sandstone paving slabs (Figs. 8a and b). This staircase provided access from the garden terrace to the pool level. At the top of the stairs is a landing leading to a broad (2 m wide) doorway and a room (foyer) with doors opening to the east - leading to the pool’s west promenade - and to the south - leading to the room in Trench 20 described above.
During the Byzantine period, a wall was built up between the Great Temple’s east colonnade and the pool wall)6, forming an oblique passageway from the colonnade into the staircase (Fig. 8b, far left). It is probably at this time that the doorway between the staircase and the foyer was frst narrowed. Subsequent to the construction of the Early Byzantine wall, a greenish - grey clayey deposit, containing a high density of animal bones and pottery sherds, accumulated on the landing, staircase and the floor of the Great Temple’s east exedra. Joukowsky notes that this thick grey deposition may be indicative of the use of the closed exedra area as a lime kiln (Joukowsky 2007: 110, Fig. 3.33), however, the nature of the deposit covering only the east half of the top steps and then spreading out across the bottom of the stairs (Fig. 8b) and the exedra floor, suggests that the material originated from the pool - perhaps an effort to clean rubbish and stagnant water accumulated in the now unmaintained pool - and was thrown (or poured) down to fill the staircase and the exedra. Later the foyer doorway was completely blocked and the staircase landing and foyer spaces partitioned with narrow dividing walls constructed of re-used stones, possibly representing a squatter settlement that likely coincides with the Late Roman - Byzantine squatter settlement (PGPC Phase VI, forth-fifth centuries AD). Above this lies a deep accumulation of collapsed debris consisting of stone rubble and large architectural blocks in a sandy matrix (PGPC Phase VII) (Bedal et al. 2007: 166).
With approximately half a meter of fill remaining above floor level, Trench 21 was not completed by the end of the 2009 field season. A study of its full stratigraphy and material contents will commence on its completion in the next field season (planned for 2011) and should provide valuable information about the chronological sequence of construction, re-use, fill and earthquake collapse.
- Fig. 1 - Site Plan from
Bedal et al (2011)
Figure 1
Site plan
Bedal et al (2011) - Fig. 9 - Trench 1 top plan
from Bedal (2003)
Figure 9
Trench 1 top plan showing the northwestern quarter of the island-pavilion and the western half of each of the bridge piers. A deep sounding reached the bottom of the pool, 2.5 meters below the pavilion's floor level.
Bedal (2003) - Fig. 9 - Trench 1 top plan
from Bedal (2003) (magnified)
Figure 9
Trench 1 top plan showing the northwestern quarter of the island-pavilion and the western half of each of the bridge piers. A deep sounding reached the bottom of the pool, 2.5 meters below the pavilion's floor level.
Bedal (2003)
- Fig. 24 - Two destruction layers
in west baulk of Trench 1 from Bedal et al (2007)
Figure 24
Trench 1, deep sounding in pool, west baulk. Two destruction layers are clearly visible in the pool fill.
Bedal et al (2007) - Fig. 5 - Earthquake collapse
at Pool south-west from Bedal et al (2011)
Figure 5
Pool south-west: delineation of secondary earthquake collapse (foreground) and the back side of the check dam / diversion wall (center, behind James Schryver).
Bedal et al (2011)
- Fig. 1 - Site Plan
from Bedal et al (2011)
Figure 1
Site plan
Bedal et al (2011)
- Fig. 5 - Earthquake collapse
at Pool south-west from Bedal et al (2011)
Figure 5
Pool south-west: delineation of secondary earthquake collapse (foreground) and the back side of the check dam / diversion wall (center, behind James Schryver).
Bedal et al (2011)
The 2009 excavation in pool south-west, supervised by James G. Schryver, consisted of a baulk of overburden composed of alternating strata of earth / rubble wash, earthquake collapse and post-Classical walls apparently constructed to retain the accumulated soil and control water runoff from az-Zanṭūr. The defined area (8 x 9 x 4.5 m) is immediately north of Trench 12 (2004) and runs up against the east face of the Great Temple east perimeter wall (GTEP wall). Careful delineation of the stone fall and constructed walls helped to distinguish the strata of rubble debris from two major earthquake collapses and the construction of a late (post-Classical) wall to support the earth - rubble wash that was coming down from az-Zanṭūr and filling the pool area. The wall revealed itself to be built of two faces of large recycled ashlar stones surrounding a core of rubble stones. The southern ashlar face of the upper portion of this wall had collapsed, revealing a packing of smaller stones (Fig. 5). Further excavation in this area will be necessary to fully understand just how deep into the fill of the pool this wall extends, thereby determining its date and stratigraphic relationship with the earlier architecture.
Evidence for this wall serving as a check dam or terrace wall that was a part of a larger system of soil retention across this part of the site came from our soil specialist, John E. Foss, who noted that the fills against the wall were waterlain and that certain surfaces within the fill may have been cultivated. The east - west wall of the check dam was further integrated with a wall running north - south along the western edge of the pool, directly above the pool’s west perimeter, apparently to direct and divert water along the western edge of the pool area down to the garden terrace which functioned as an agricultural field in later periods. The construction of this wall may be associated with the collapse of the GTEP wall and the resulting redistribution of soils during the winter foods. The proposed cultivation of these soils seems to have been contemporary with a second collapse, as most of the stones from this collapse seem to have been collected and then thrown up against the base of the northern face of check dam in the form of a convex buttress. A later collapse must have occurred once the area was no longer being cultivated as those stones were left in place, spread across the ground surface. These activities are all attributed to PGPC Phases V - VIII (Late Roman - Post-Classical / Medieval).
- Fig. 1 - Site Plan
from Bedal et al (2011)
Figure 1
Site plan
Bedal et al (2011)
- Fig. 6 - Great Temple east
perimeter wall from Bedal et al (2011)
Figure 6
The Great Temple east perimeter wall separates the Great Temple upper temenos (left) from the pool complex (right).
Bedal et al (2011) - Fig. 7 - Trench 20
from Bedal et al (2011)
Figure 7
Trench 20: the south end of the brick pool (with steps) built inside an intermural space in the Great Temple east perimeter wall
Bedal et al (2011) - Fig. 8 - Staircase from
garden terrace to pool landing from Bedal et al (2011)
Figure 8a and 8b
Staircase leading from garden terrace up to the pool-level landing and the door to the foyer (a), which was later narrowed and blocked. A deposit of grey clayey soil covers the lower steps and extends into the Great Temple east exedra
Bedal et al (2011)
Another area that required attention during the 2007 and 2009 field seasons was the western boundary of the pool area that adjoins the Great Temple upper temenos (Fig. 6). The west face of the GTEP wall was uncovered by the Brown University excavations, along with two of the intermural rooms (Room C and the small reservoir)5. However, the continuation of the wall to the north of the small reservoir remained unexcavated.
Trenches 20 and 21 were opened to define the eastern face of the northern extension of the GTEP wall (the southern portion was exposed in 2004, Trench 12) and to begin excavating the intermural spaces. Trench 20 defines a single intermural room immediately to the north of the small reservoir. Work here revealed the upper courses of a baked brick construction that lines the interior walls (dimensions 7.25 x 2.20 m). The walls are single brick width (36 cm) on all sides, with steps measuring a single brick width which measure 36 x 36 x 6 - 8 cm, are poorly fried with heavy chaff and are cemented with a crumbly grey mortar tempered with small pottery fragments (primarily Nabataean fine ware). Diagnostics include Nabataean painted pottery dating to the second century AD providing a terminus ante quem for the construction of this installation in the second quarter of the second century AD. The brick construction is similar to some of the construction in the bath complex west of the Great Temple that has been assigned to the Roman - Byzantine period (Joukowsky 2007: 154-8). It can thus be deduced that the brick feature represents a secondary use of the intermural space within the GTEP Wall dating to the second or third century AD at the earliest. The heavy use of mortar and plaster, in addition to the presence of steps in one corner, suggests its function as a water basin or pool. The center of the basin is badly damaged by a large pit, filled with large stones in a greyish - brown ashy matrix. The trench was closed and sandbagged to protect the poorly preserved bricks pending future study.
Trench 21, located immediately north of Trench 20, measures 3.50 x 11.25 m. Its dimensions are defined by the width of the casemate wall and the length of the space north of Trench 20 to the north face of the pool and the Great Temple east exedra. Excavations began in 2007, defining the line of the east wall and clearing the topsoil and fill and that was heaped up against the west wall. In 2009, excavations continued under the supervision of William A. Caccese and Leigh-Ann Bedal with removal of sandy rubble fill, earthquake collapse and small dividing walls of later date (post-Classical / Medieval) that revealed the remnants of the original Nabataean structure. At the north end, a doorway between the Great Temple’s east exedra and the pool leads to a well-preserved staircase constructed of sandstone paving slabs (Figs. 8a and b). This staircase provided access from the garden terrace to the pool level. At the top of the stairs is a landing leading to a broad (2 m wide) doorway and a room (foyer) with doors opening to the east - leading to the pool’s west promenade - and to the south - leading to the room in Trench 20 described above.
During the Byzantine period, a wall was built up between the Great Temple’s east colonnade and the pool wall)6, forming an oblique passageway from the colonnade into the staircase (Fig. 8b, far left). It is probably at this time that the doorway between the staircase and the foyer was frst narrowed. Subsequent to the construction of the Early Byzantine wall, a greenish - grey clayey deposit, containing a high density of animal bones and pottery sherds, accumulated on the landing, staircase and the floor of the Great Temple’s east exedra. Joukowsky notes that this thick grey deposition may be indicative of the use of the closed exedra area as a lime kiln (Joukowsky 2007: 110, Fig. 3.33), however, the nature of the deposit covering only the east half of the top steps and then spreading out across the bottom of the stairs (Fig. 8b) and the exedra floor, suggests that the material originated from the pool - perhaps an effort to clean rubbish and stagnant water accumulated in the now unmaintained pool - and was thrown (or poured) down to fill the staircase and the exedra. Later the foyer doorway was completely blocked and the staircase landing and foyer spaces partitioned with narrow dividing walls constructed of re-used stones, possibly representing a squatter settlement that likely coincides with the Late Roman - Byzantine squatter settlement (PGPC Phase VI, forth-fifth centuries AD). Above this lies a deep accumulation of collapsed debris consisting of stone rubble and large architectural blocks in a sandy matrix (PGPC Phase VII) (Bedal et al. 2007: 166).
With approximately half a meter of fill remaining above floor level, Trench 21 was not completed by the end of the 2009 field season. A study of its full stratigraphy and material contents will commence on its completion in the next field season (planned for 2011) and should provide valuable information about the chronological sequence of construction, re-use, fill and earthquake collapse.
- Phase III of Bedal et al (2007) is labeled as Phase II in Bedal (2003). Bedal et al (2007)'s phase labels are used here.
| Effect | Location | Image(s) | Description/Comments |
|---|---|---|---|
| Re-use of building elements | Southern platform, trench 5
Figure 1 Site plan Bedal et al (2011) |
Figure 9 Elements of a column and capital used as fill in the Phase III renovations to the southern platform, trench 5 (drawn by C. Kanellopolous). Bedal et al (2007) |
These building elements could have come from another structure - for example the nearby Great Temple where Joukowsky and Basile (2001:50) report an early 2nd century CE earthquake in Phase VI. |
- Phase V of Bedal et al (2007) is labeled as Phase IV in Bedal (2003). Bedal et al (2007)'s phase labels are used here.
| Effect | Location | Image(s) | Description/Comments |
|---|---|---|---|
| Collapsed Walls | Trench 1
Figure 9 Trench 1 top plan showing the northwestern quarter of the island-pavilion and the western half of each of the bridge piers. A deep sounding reached the bottom of the pool, 2.5 meters below the pavilion's floor level. Bedal (2003)
Figure 1Site plan Bedal et al (2011) |
Figure 24 Trench 1, deep sounding in pool, west baulk. Two destruction layers are clearly visible in the pool fill. Bedal et al (2007) |
The upper courses of the pavilion walls collapsed into the pool, forming a dense layer of large stone rubble in a reddish-brown sandy matrix overlying the Phase IV fill (trench 1) (Fig. 24).- Bedal et al (2007) |
| Collapsed Walls | Trench 12
Figure 1 Site plan Bedal et al (2011) |
Figure 23 Trench 12, from the south. Stones of the Phase V destruction, are clearly visible in the north baulk sandwiched between the Phase IV and Phase VI fills. The Phase VII destruction level is already excavated away at the time of this photo. Bedal et al (2007) |
In the south-west corner, stones falling from the South Wall and the Great Temple's East Perimeter Wall formed a similar destruction layer (Fig. 23).- Bedal et al (2007) |
| Effect | Location | Image(s) | Description/Comments |
|---|---|---|---|
| Collapsed Walls | Trench 1
Figure 9 Trench 1 top plan showing the northwestern quarter of the island-pavilion and the western half of each of the bridge piers. A deep sounding reached the bottom of the pool, 2.5 meters below the pavilion's floor level. Bedal (2003)
Figure 1Site plan Bedal et al (2011) |
Figure 24 Trench 1, deep sounding in pool, west baulk. Two destruction layers are clearly visible in the pool fill. Bedal et al (2007) |
further collapse of the walls surrounding the pool complex and the island-pavilion (Fig. 24).- Bedal et al (2007) |
- Phase III of Bedal et al (2007) is labeled as Phase II in Bedal (2003). Bedal et al (2007)'s phase labels are used here.
- Earthquake Archeological Effects chart
of Rodríguez-Pascua et al (2013: 221-224)
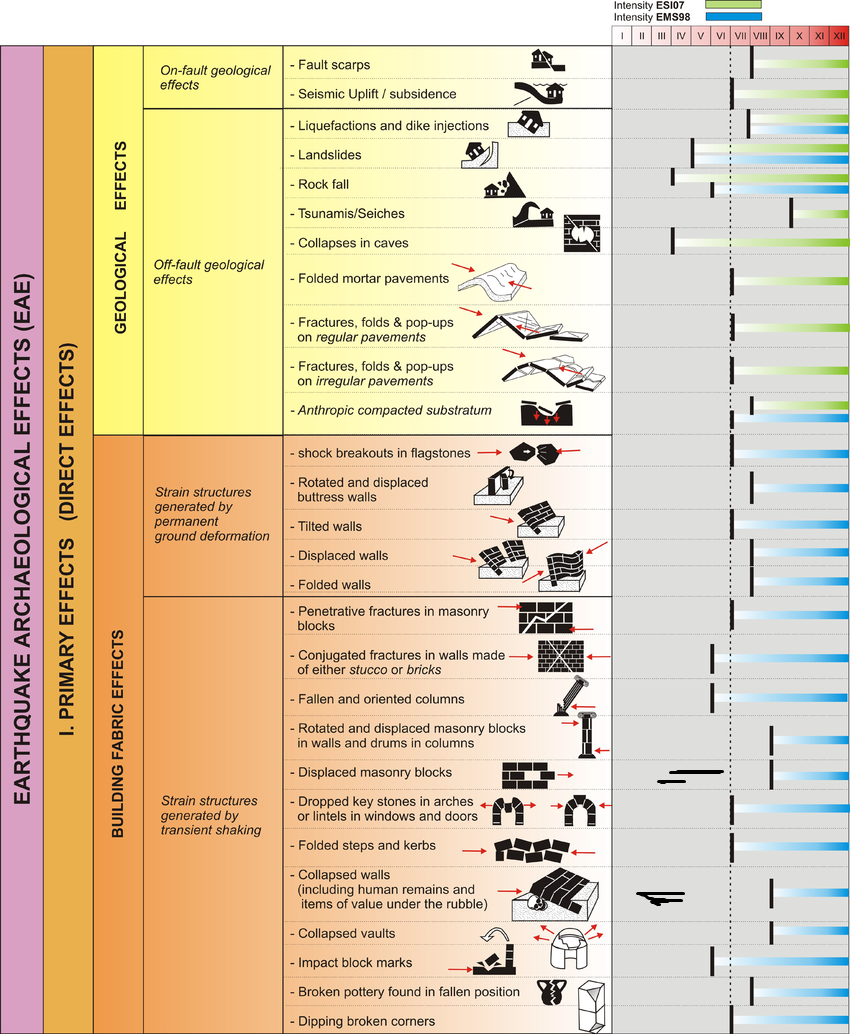 Earthquake Archeological Effects (EAE)
Rodríguez-Pascua et al (2013: 221-224)
| Effect | Location | Image(s) | Description/Comments | Intensity |
|---|---|---|---|---|
| Re-use of building elements suggests Displaced masonry blocks in drums in columns | Southern platform, trench 5
Figure 1 Site plan Bedal et al (2011) |
Figure 9 Elements of a column and capital used as fill in the Phase III renovations to the southern platform, trench 5 (drawn by C. Kanellopolous). Bedal et al (2007) |
These building elements could have come from another structure - for example the nearby Great Temple where Joukowsky and Basile (2001:50) report an early 2nd century CE earthquake in Phase VI. | VIII+ |
- Phase V of Bedal et al (2007) is labeled as Phase IV in Bedal (2003). Bedal et al (2007)'s phase labels are used here.
- Earthquake Archeological Effects chart
of Rodríguez-Pascua et al (2013: 221-224)
Earthquake Archeological Effects (EAE)
Rodríguez-Pascua et al (2013: 221-224)
| Effect | Location | Image(s) | Description/Comments | Intensity |
|---|---|---|---|---|
| Collapsed Walls | Trench 1
Figure 9 Trench 1 top plan showing the northwestern quarter of the island-pavilion and the western half of each of the bridge piers. A deep sounding reached the bottom of the pool, 2.5 meters below the pavilion's floor level. Bedal (2003)
Figure 1Site plan Bedal et al (2011) |
Figure 24 Trench 1, deep sounding in pool, west baulk. Two destruction layers are clearly visible in the pool fill. Bedal et al (2007) |
The upper courses of the pavilion walls collapsed into the pool, forming a dense layer of large stone rubble in a reddish-brown sandy matrix overlying the Phase IV fill (trench 1) (Fig. 24).- Bedal et al (2007) |
VIII+ |
| Collapsed Walls | Trench 12
Figure 1 Site plan Bedal et al (2011) |
Figure 23 Trench 12, from the south. Stones of the Phase V destruction, are clearly visible in the north baulk sandwiched between the Phase IV and Phase VI fills. The Phase VII destruction level is already excavated away at the time of this photo. Bedal et al (2007) |
In the south-west corner, stones falling from the South Wall and the Great Temple's East Perimeter Wall formed a similar destruction layer (Fig. 23).- Bedal et al (2007) |
VIII+ |
- Earthquake Archeological Effects chart
of Rodríguez-Pascua et al (2013: 221-224)
Earthquake Archeological Effects (EAE)
Rodríguez-Pascua et al (2013: 221-224)
| Effect | Location | Image(s) | Description/Comments | Intensity |
|---|---|---|---|---|
| Collapsed Walls | Trench 1
Figure 9 Trench 1 top plan showing the northwestern quarter of the island-pavilion and the western half of each of the bridge piers. A deep sounding reached the bottom of the pool, 2.5 meters below the pavilion's floor level. Bedal (2003)
Figure 1Site plan Bedal et al (2011) |
Figure 24 Trench 1, deep sounding in pool, west baulk. Two destruction layers are clearly visible in the pool fill. Bedal et al (2007) |
further collapse of the walls surrounding the pool complex and the island-pavilion (Fig. 24).- Bedal et al (2007) |
VIII+ |