Aila
 Aila Area J-East
click on image to explore this site on a new tab in Google Earth
- Fig. 2.15 - Location Map
for Aqaba and environs from Allison (2013)
 Figure 2.15
Map of archaeological sites in greater Aqaba, Jordan region (modified after Brückner et al. 2002).
Allison (2013) - Map showing location
of Islamic Ayla and Byzantine Aila (aka Ailana) from Whitcomb (1988)
 Map of the modern city of Aqaba with ancient and medieval archeological sites
JW: Apparently Ailana = Aila
Whitcomb (1988) - Fig. 2 Map showing
location of Islamic Ayla and Byzantine Aila from Whitcomb (1997)
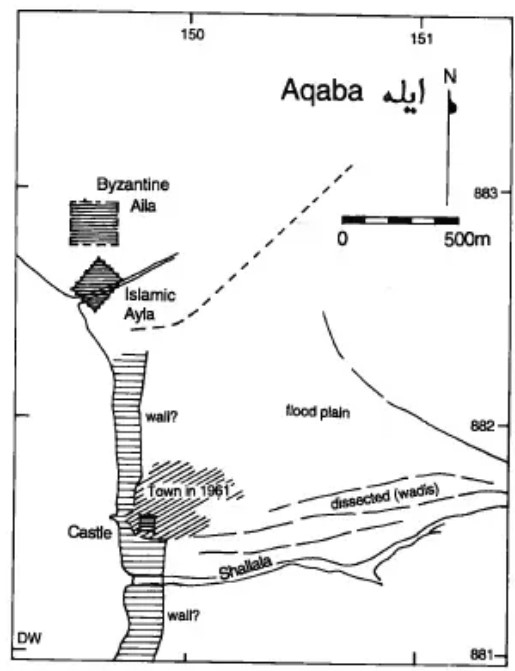 Figure 2
The succession of settlements at 'Aqaba, Jordan
Whitcomb (1997) - Fig 2.8B Map showing
location of Area J-east from Niemi (2014)
 Fig. 2.8 B)
Map of Aqaba showing the three archaeological sites near the coast, some major roads, and location of cross faults and possible Aqaba fault strands.
Niemi (2014)
- Fig. 2.15 - Location Map
for Aqaba and environs from Allison (2013)
Figure 2.15
Map of archaeological sites in greater Aqaba, Jordan region (modified after Brückner et al. 2002).
Allison (2013)
- Aila Area J-East in Google Earth
Aila Area J-East
click on image to explore this site on a new tab in Google Earth
- Fig. 2.15 Plan of Area J-east
from Thomas et al (2007)
 Fig. 2.15
Faults exposed in the Roman Aqaba Project excavation Area J-East
Niemi - Chapter 2 from Parker et al (2014) - Fig. 8 Map/Plan showing
location of Area B from Dolinka (2003:32)
 Fig. 8
Plan of the areas excavated by the Roman Aqaba Project, after the 1998 season. Note that the location of Nabataean/Roman Aila is in the area not surveyed by Meloy (courtesy of RAP).
JW: Area B is in upper middle of map
Dolinka (2003)
- Fig. 2.15 Plan of Area J-east
from Thomas et al (2007)
Fig. 2.15
Faults exposed in the Roman Aqaba Project excavation Area J-East
Niemi - Chapter 2 from Parker et al (2014) - Fig. 8 Map/Plan showing
location of Area B from Dolinka (2003:32)
Fig. 8
Plan of the areas excavated by the Roman Aqaba Project, after the 1998 season. Note that the location of Nabataean/Roman Aila is in the area not surveyed by Meloy (courtesy of RAP).
JW: Area B is in upper middle of map
Dolinka (2003)
- Fig. 4
Section Walls 26 & 48 from Thomas et al (2007)
 Fig. 4
Section drawing Wall 26 and Wall 48, showing earthquake damage and fault offsets.
Thomas et al (2007) - Fig. 5
Section C from Thomas et al (2007)
 Fig. 5
. Stratigraphic sections of the south and north baulks of J-1, showing the faults.
Thomas et al (2007) - Fig. 5
Section A from Thomas et al (2007)
 Fig. 5
. Stratigraphic sections of the south and north baulks of J-1, showing the faults.
Thomas et al (2007) - Fig. 5
Section B from Thomas et al (2007)
 Fig. 5
. Stratigraphic sections of the south and north baulks of J-1, showing the faults.
Thomas et al (2007) - Fig. 6
Section N corner of Room 6 from Thomas et al (2007)
 Fig. 6
Section drawing of the north corner of Room 6, showing the relationship between the earthquake damage ...
Thomas et al (2007) - Fig. 7
Section Blocked Archway N Wall Room 4 from Thomas et al (2007)
 Fig. 7
Section drawing and photo of the blocked archway and slip on fractures in it in the north wall of Room 4
Thomas et al (2007) - Fig. 8
Section N Wall Room 11 from Thomas et al (2007)
 Fig. 8
Section drawing of the plastered north wall of Room 11. The second phase of plastering probably repairs diagonal tension fractures developed from the earthquake at the end of Phase 2. The corner wall join also shows repair. The west wall is collapsed westward, perhaps in a much later earthquake.
Thomas et al (2007) - Fig. 9
Section S Wall Room 12 from Thomas et al (2007)
 Fig. 9
Section drawing of the south wall of Room 12. This wall lies very close to the trend of the active fault that traverses the site. Several earthquake-induced structural damage features are noted, including a slump failure along the west wall, extensional and shear fractures, collapsed walls, and a wall join repair.
Thomas et al (2007) - Fig. 10
Section wall near the stairway and arch pillar in Room 4 from Thomas et al (2007)
 Fig. 10
Section drawing of repairs in the wall near the stairway and arch pillar in Room 4. Most of the west wall is intact, standing to a height of ca. 2 m.
Thomas et al (2007) - Fig. 11
Section and photos of quake damage in Rooms 2 and 3 from Thomas et al (2007)
 Fig. 11
Section drawing and photos of the earthquake damage in Rooms 2 and 3.
Thomas et al (2007) - Fig. 11
Section S wall Room 3 from Thomas et al (2007)
 Fig. 11
Section drawing and photos of the earthquake damage in Rooms 2 and 3.
Thomas et al (2007) - Fig. 11
Section S wall Room 3 View W from Thomas et al (2007)
 Fig. 11
Section drawing and photos of the earthquake damage in Rooms 2 and 3.
Thomas et al (2007) - Fig. 11
Photo of collapse of S wall Room 2 view W from Thomas et al (2007)
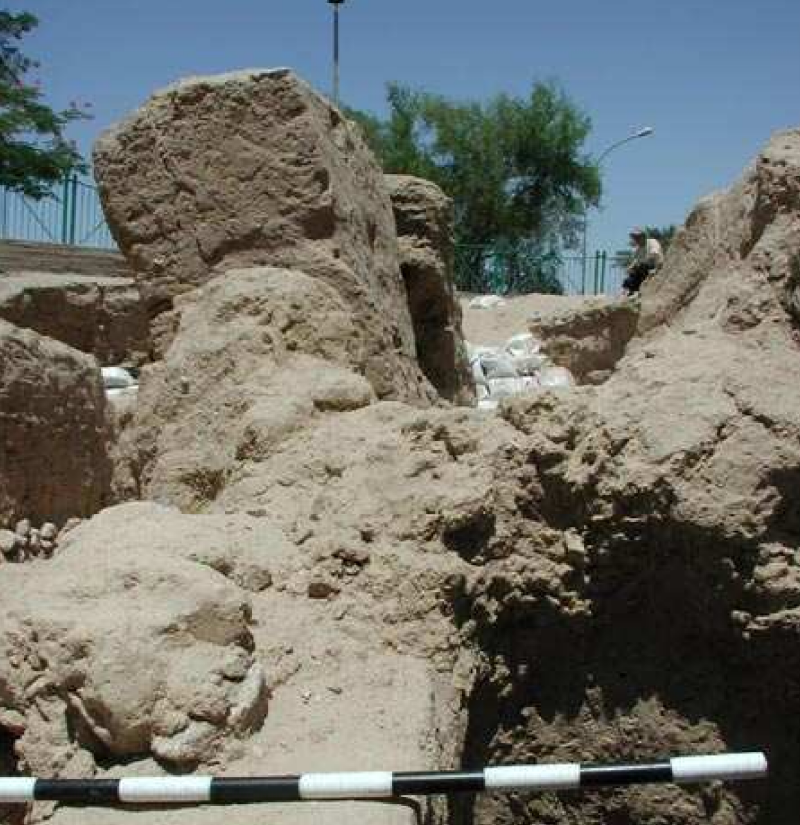 Fig. 11
Section drawing and photos of the earthquake damage in Rooms 2 and 3.
Thomas et al (2007) - Fig. 11
Photo of collapse of S wall Room 2 view W from Thomas et al (2007)
 Fig. 11
Section drawing and photos of the earthquake damage in Rooms 2 and 3.
Thomas et al (2007)
- from Thomas et al (2007)
 Fig. 3
Schematic columnar stratigraphic section of the deposits at the J-East site, showing mudbrick tumble from earthquakes on floor levels, sand horizons, occupational levels, and earthquake event horizons.
Thomas et al (2007)
 Left
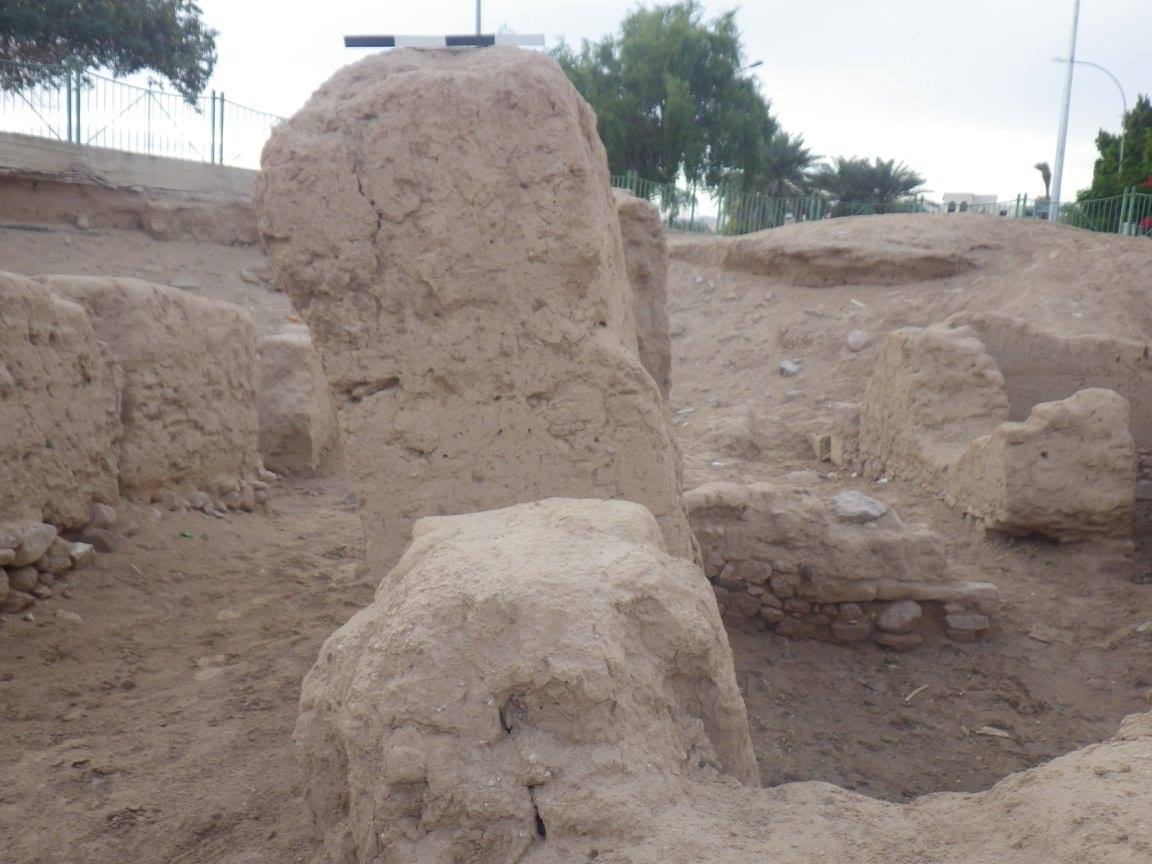
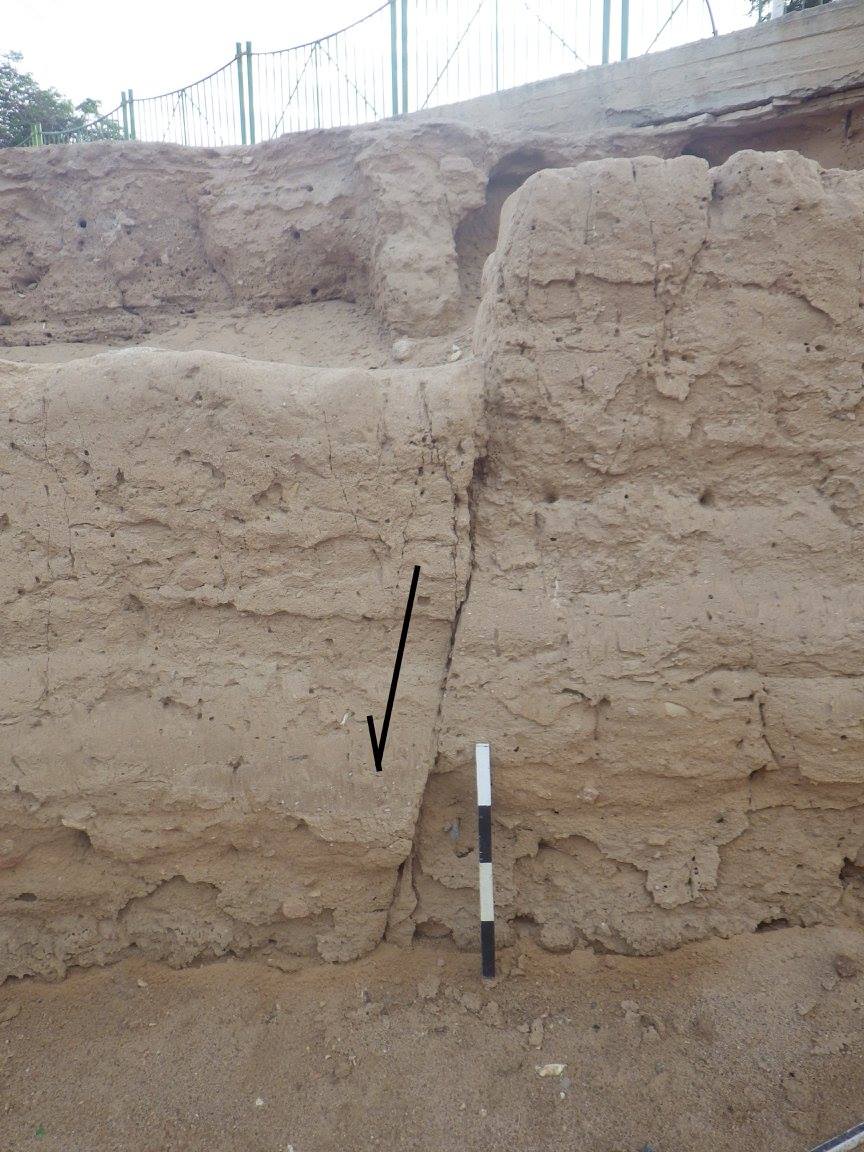
LeftTilted South Wall of Room 2 at Aila J-East
Right
Normal Faulting of a wall at Aila J-East
photos by Jefferson Williams
-
Composite columnar stratigraphic section
for the deposits of the J-east site from Thomas et al (2007)
Fig. 3
Schematic columnar stratigraphic section of the deposits at the J-East site, showing mudbrick tumble from earthquakes on floor levels, sand horizons, occupational levels, and earthquake event horizons.
Thomas et al (2007)
- from Thomas et al (2007)
Fig. 3Schematic columnar stratigraphic section of the deposits at the J-East site, showing mudbrick tumble from earthquakes on floor levels, sand horizons, occupational levels, and earthquake event horizons.
Thomas et al (2007)
Thomas et al (2007) excavated and examined area J-east between 1994 and 2003.
The J-East area is a multiphase site incorporating Early Islamic to Byzantine domestic occupation and a late third to fourth-century monumental mudbrick structure that has been interpreted as a church (Parker 1998a; 1999a; Mussell 2001; Rose 1998; Weintraub 1999)( Thomas et al, 2007). This site, in the Roman-Byzantine town of Aila, is located ~500 m north of the modern shoreline of Aqaba and ~500 m NW of the Islamic town of Ayla . Thomas et al (2007) identified 6 or 7 earthquakes from the 2nd century CE onward in J-east and divided up the timing as shown the the table below.
- from Thomas et al (2007)
Fig. 3Schematic columnar stratigraphic section of the deposits at the J-East site, showing mudbrick tumble from earthquakes on floor levels, sand horizons, occupational levels, and earthquake event horizons.
Thomas et al (2007)
- from Thomas et al (2007)
Fig. 3Schematic columnar stratigraphic section of the deposits at the J-East site, showing mudbrick tumble from earthquakes on floor levels, sand horizons, occupational levels, and earthquake event horizons.
Thomas et al (2007)
- from Thomas et al (2007)
Fig. 3Schematic columnar stratigraphic section of the deposits at the J-East site, showing mudbrick tumble from earthquakes on floor levels, sand horizons, occupational levels, and earthquake event horizons.
Thomas et al (2007)
- from Thomas et al (2007)
Fig. 3Schematic columnar stratigraphic section of the deposits at the J-East site, showing mudbrick tumble from earthquakes on floor levels, sand horizons, occupational levels, and earthquake event horizons.
Thomas et al (2007)
- from Thomas et al (2007)
Fig. 3Schematic columnar stratigraphic section of the deposits at the J-East site, showing mudbrick tumble from earthquakes on floor levels, sand horizons, occupational levels, and earthquake event horizons.
Thomas et al (2007)
- from Thomas et al (2007)
Fig. 3Schematic columnar stratigraphic section of the deposits at the J-East site, showing mudbrick tumble from earthquakes on floor levels, sand horizons, occupational levels, and earthquake event horizons.
Thomas et al (2007)
- from Thomas et al (2007)
Fig. 3Schematic columnar stratigraphic section of the deposits at the J-East site, showing mudbrick tumble from earthquakes on floor levels, sand horizons, occupational levels, and earthquake event horizons.
Thomas et al (2007)
| Effect | Location | Image (s) | Comments |
|---|---|---|---|
|
Faults F and H
Fig. 2.15 Faults exposed in the Roman Aqaba Project excavation Area J-East Niemi - Chapter 2 from Parker et al (2014) |
 Fig. 5C
Stratigraphic sections of the south and north baulks of J-1, showing the faults. Thomas et al (2007) |
The youngest earthquake (Earthquake I) recorded at this site ruptured faults very close to the modern ground surface. ... Earthquake I ruptured Faults F and H. We measured a total displacement of 35 cm southwest dip-slip in figure 5C, with little or no apparent strike-slip. These faults trend more toward the west (N12°W and N34°W) than the fault rupture in previous earthquakes (ca. 10° more than II to III, and ca. 20° more than the Byzantine Earthquakes V to VI).- Thomas et al (2007) |
| Effect | Location | Image (s) | Comments |
|---|---|---|---|
|
Fault A and E and Wall J.1:26
Fig. 2.15 Faults exposed in the Roman Aqaba Project excavation Area J-East Niemi - Chapter 2 from Parker et al (2014) |
Fig. 5C Stratigraphic sections of the south and north baulks of J-1, showing the faults. Thomas et al (2007) |
These deposits were ruptured and the buildings collapsed. Slip on Fault A produced a left-lateral strike-slip of 5 cm on Wall J.1:26, and Faults A and E caused an accumulated southwest dip-slip of 42 cm (measured in fig. 5C). Wall collapse was minor despite the obvious energy of the earthquake.- Thomas et al (2007) |
| Effect | Location | Image (s) | Comments |
|---|---|---|---|
|
Faults B, C, F, and G
Fig. 2.15 Faults exposed in the Roman Aqaba Project excavation Area J-East Niemi - Chapter 2 from Parker et al (2014) |
Fig. 5C Stratigraphic sections of the south and north baulks of J-1, showing the faults. Thomas et al (2007)  Fig. 4
Section drawing of Wall 26 and Wall 48, showing earthquake damage and fault offsets. JW: may refer to Fault C Thomas et al (2007) |
|
| Effect | Location | Image (s) | Comments |
|---|---|---|---|
|
Fault D and Wall J.1.53
Fig. 2.15 Faults exposed in the Roman Aqaba Project excavation Area J-East Niemi - Chapter 2 from Parker et al (2014) |
Fig. 5C Stratigraphic sections of the south and north baulks of J-1, showing the faults. Thomas et al (2007) |
Measured in Section C (fig. 5), Earthquake IV caused 12 cm of dip-slip across Fault D and up to 30 cm of lateral motion on Wall J.1.53. However, since Fault D also slipped in Earthquakes V and VI and appears to have caused more severe structural damage, strike-slip is probably minimal in this event. ... Earthquake IV probably caused the collapse of the long-abandoned domestic structures.- Thomas et al (2007) |
| Effect | Location | Image (s) | Comments |
|---|---|---|---|
|
Faults C and D, N Wall of Room 20, Wall J.1:53
Fig. 2.15 Faults exposed in the Roman Aqaba Project excavation Area J-East Niemi - Chapter 2 from Parker et al (2014) |
Fig. 4 Section drawing of Wall 26 and Wall 48, showing earthquake damage and fault offsets. Thomas et al (2007)  Fig. 5
Stratigraphic sections of the south and north baulks of J-1, showing the faults. Thomas et al (2007) |
The monumental building appears to have been violently shaken in Earthquake V. This is a more severe reactivation of Faults C and D but occurs along a slightly different rupture plane (through the Room 20 north wall - see Fig. 4) than during EQ VI. The amount of fault slip in this earthquake must exceed 23 cm of dip-slip (measured in sections A and B, fig. 5). Where Fault D shifted Wall J.1:53, a maximum of 30 cm of left-lateral strike-slip was measured. This slip is shared by reactivation in Earthquake IV and the previous Earthquake VI (discussed above). The collapse layer for Earthquake V exceeds 90 cm in places. The tumble is more evenly distributed throughout the site than was the case for the earlier Earthquake VI, with a bias to the north side of collapsing walls. This thick collapse horizon across the site suggests Earthquake V was stronger in intensity compared with Earthquake VI. The majority of the lateral slip across Fault D is likely to have occurred predominantly in Earthquake V (but also moves in Earthquakes VI and IV).- Thomas et al (2007) |
| Effect | Location | Image (s) | Comments |
|---|---|---|---|
|
various parts of J-east
Fig. 2.15 Faults exposed in the Roman Aqaba Project excavation Area J-East Niemi - Chapter 2 from Parker et al (2014) |
The monumental mudbrick structure experienced fault rupture and collapse of some walls, producing a tumble horizon. The southern wall of Room 13 was ruptured by Fault D and the northern wall of Room 21 by Fault C. This tectonic shift caused substantial localized damage. Earthquake VI produced a total of 10 cm of left-lateral strike-slip measured across Fault C on Wall J.1:26, north of Room 21. This damage from the fault was repaired after Earthquake VI. The strike-slip of Fault D in EQ VI could not be measured because Fault D reactivated in subsequent Earthquakes V and IV. The total strike-slip measured along Wall J.1:53 is 30 cm. Since there was no repair to the wall, this suggests that the majority of the slip was caused by EQ VI. Similarly, the dip-slip could not be directly measured, but later releveling of the southwest corner of the monumental building indicates subsidence did occur. Elsewhere on the site, damage appears not to have been quite as severe, but seismically induced wall failures were repaired in the subsequent occupation phase.- Thomas et al (2007) |
| Effect | Location | Image (s) | Comments |
|---|---|---|---|
|
J-east
Fig. 2.15 Faults exposed in the Roman Aqaba Project excavation Area J-East Niemi - Chapter 2 from Parker et al (2014) |
|
|
|
some structures in Area B
Fig. 8 Plan of the areas excavated by the Roman Aqaba Project, after the 1998 season. Note that the location of Nabataean/Roman Aila is in the area not surveyed by Meloy (courtesy of RAP). JW: Area B is in upper middle of map Dolinka (2003) |
 Fig. 14
Tumbled-over mudbricks from the domestic complex in B.1/3 bear witness to the earthquake that ushered in the Abandonment II phase at Aila during the early-2nd century AD (courtesy of RAP) Dolinka (2003) |
|
- Modified by JW from Fig. 2 of Thomas et al (2007)
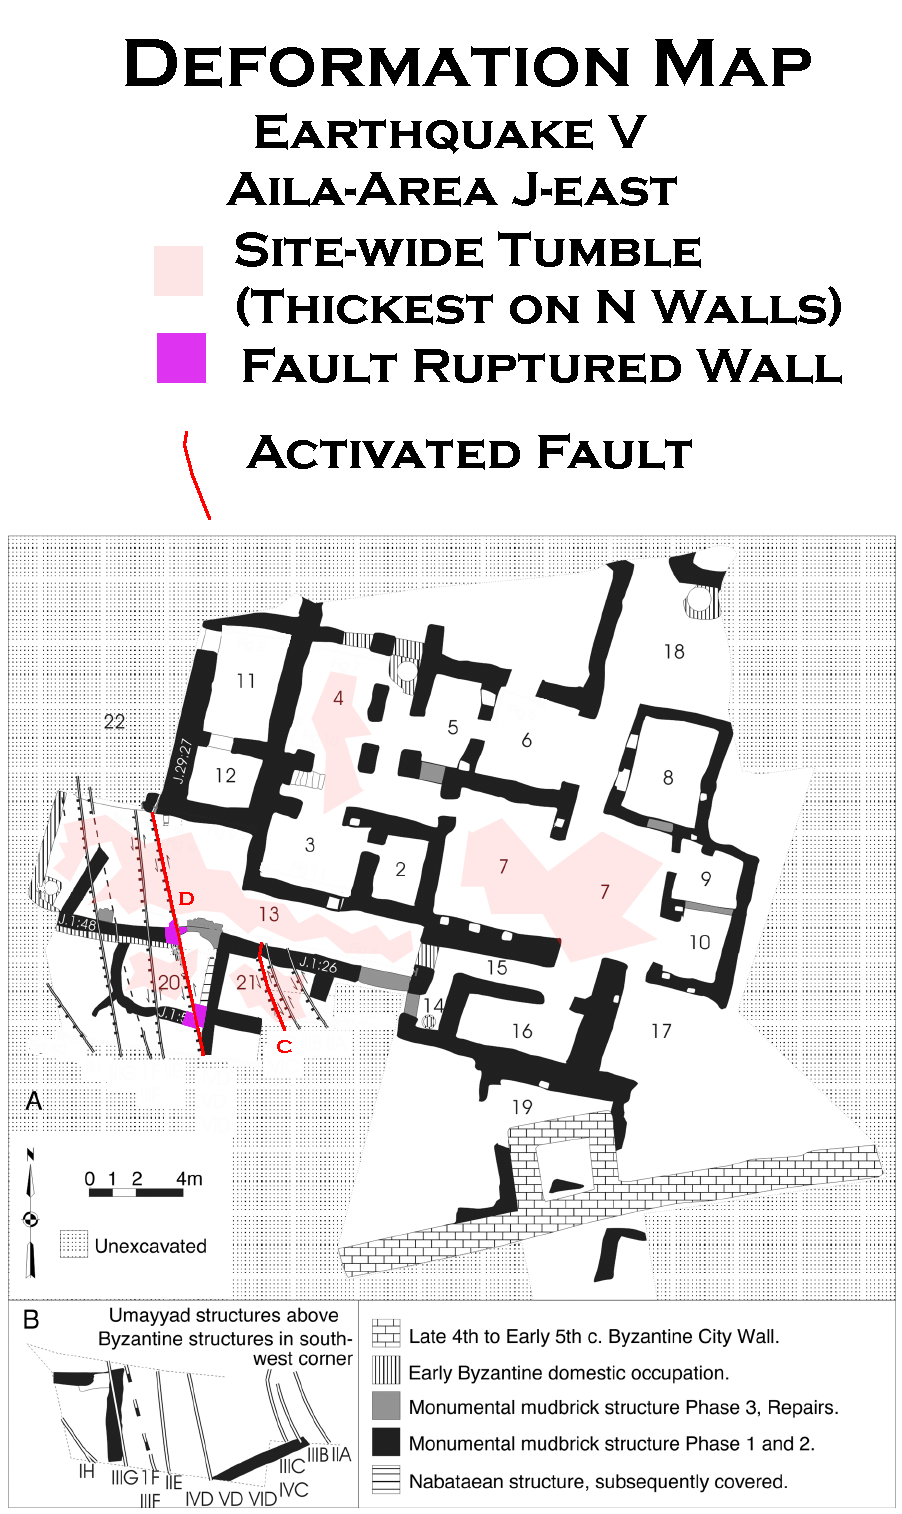
 Deformation Map
Modified by JW from Fig. 2 of Thomas et al (2007)
- Modified by JW from Fig. 2 of Thomas et al (2007)
 Deformation Map
Modified by JW from Fig. 2 of Thomas et al (2007)
- Modified by JW from Fig. 2 of Thomas et al (2007)
 Deformation Map
Modified by JW from Fig. 2 of Thomas et al (2007)
- Modified by JW from Fig. 2 of Thomas et al (2007)
 Deformation Map
Modified by JW from Fig. 2 of Thomas et al (2007)
- Modified by JW from Fig. 2 of Thomas et al (2007)
 Deformation Map
Modified by JW from Fig. 2 of Thomas et al (2007)
- Modified by JW from Fig. 2 of Thomas et al (2007)
 Deformation Map
Modified by JW from Fig. 2 of Thomas et al (2007)
- Earthquake Archeological Effects chart
of Rodríguez-Pascua et al (2013: 221-224)
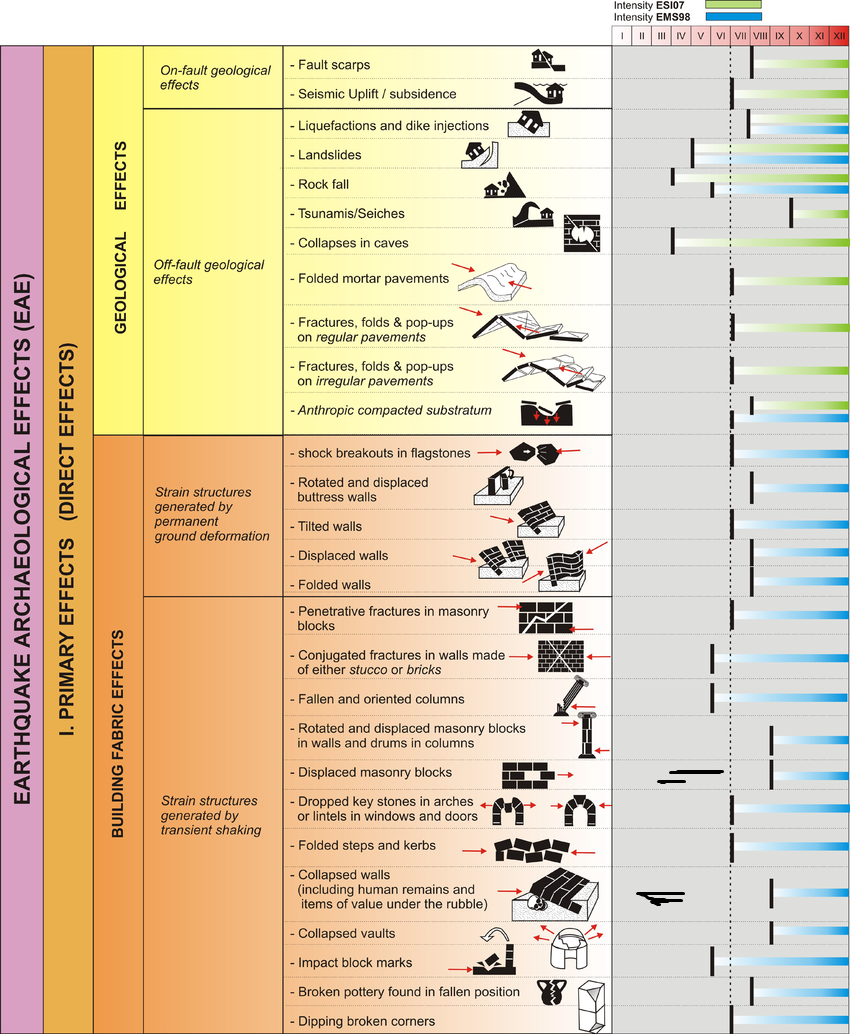 Earthquake Archeological Effects (EAE)
Rodríguez-Pascua et al (2013: 221-224)
| Effect | Location | Image (s) | Comments | Intensity |
|---|---|---|---|---|
|
Faults F and H
Fig. 2.15 Faults exposed in the Roman Aqaba Project excavation Area J-East Niemi - Chapter 2 from Parker et al (2014) |
Fig. 5C Stratigraphic sections of the south and north baulks of J-1, showing the faults. Thomas et al (2007) |
The youngest earthquake (Earthquake I) recorded at this site ruptured faults very close to the modern ground surface. ... Earthquake I ruptured Faults F and H. We measured a total displacement of 35 cm southwest dip-slip in figure 5C, with little or no apparent strike-slip. These faults trend more toward the west (N12°W and N34°W) than the fault rupture in previous earthquakes (ca. 10° more than II to III, and ca. 20° more than the Byzantine Earthquakes V to VI).- Thomas et al (2007) |
VI+ - VII+ |
- Earthquake Archeological Effects chart
of Rodríguez-Pascua et al (2013: 221-224)
Earthquake Archeological Effects (EAE)
Rodríguez-Pascua et al (2013: 221-224)
| Effect | Location | Image (s) | Comments | Intensity |
|---|---|---|---|---|
|
Fault A and E and Wall J.1:26
Fig. 2.15 Faults exposed in the Roman Aqaba Project excavation Area J-East Niemi - Chapter 2 from Parker et al (2014) |
Fig. 5C Stratigraphic sections of the south and north baulks of J-1, showing the faults. Thomas et al (2007) |
These deposits were ruptured and the buildings collapsed. Slip on Fault A produced a left-lateral strike-slip of 5 cm on Wall J.1:26, and Faults A and E caused an accumulated southwest dip-slip of 42 cm (measured in fig. 5C). Wall collapse was minor despite the obvious energy of the earthquake.- Thomas et al (2007) |
VIII + |
- Earthquake Archeological Effects chart
of Rodríguez-Pascua et al (2013: 221-224)
Earthquake Archeological Effects (EAE)
Rodríguez-Pascua et al (2013: 221-224)
| Effect | Location | Image (s) | Comments | Intensity |
|---|---|---|---|---|
|
Faults B, C, F, and G
Fig. 2.15 Faults exposed in the Roman Aqaba Project excavation Area J-East Niemi - Chapter 2 from Parker et al (2014) |
Fig. 5C Stratigraphic sections of the south and north baulks of J-1, showing the faults. Thomas et al (2007)
Fig. 4Section drawing of Wall 26 and Wall 48, showing earthquake damage and fault offsets. JW: may refer to Fault C Thomas et al (2007) |
|
VIII + |
- Earthquake Archeological Effects chart
of Rodríguez-Pascua et al (2013: 221-224)
Earthquake Archeological Effects (EAE)
Rodríguez-Pascua et al (2013: 221-224)
| Effect | Location | Image (s) | Comments | Intensity |
|---|---|---|---|---|
|
Fault D and Wall J.1.53
Fig. 2.15 Faults exposed in the Roman Aqaba Project excavation Area J-East Niemi - Chapter 2 from Parker et al (2014) |
Fig. 5C Stratigraphic sections of the south and north baulks of J-1, showing the faults. Thomas et al (2007) |
Measured in Section C (fig. 5), Earthquake IV caused 12 cm of dip-slip across Fault D and up to 30 cm of lateral motion on Wall J.1.53. However, since Fault D also slipped in Earthquakes V and VI and appears to have caused more severe structural damage, strike-slip is probably minimal in this event. ... Earthquake IV probably caused the collapse of the long-abandoned domestic structures.- Thomas et al (2007) |
VIII + |
- Earthquake Archeological Effects chart
of Rodríguez-Pascua et al (2013: 221-224)
Earthquake Archeological Effects (EAE)
Rodríguez-Pascua et al (2013: 221-224)
| Effect | Location | Image (s) | Comments | Intensity |
|---|---|---|---|---|
|
Faults C and D, N Wall of Room 20, Wall J.1:53
Fig. 2.15 Faults exposed in the Roman Aqaba Project excavation Area J-East Niemi - Chapter 2 from Parker et al (2014) |
Fig. 4 Section drawing of Wall 26 and Wall 48, showing earthquake damage and fault offsets. Thomas et al (2007)
Fig. 5Stratigraphic sections of the south and north baulks of J-1, showing the faults. Thomas et al (2007) |
The monumental building appears to have been violently shaken in Earthquake V. This is a more severe reactivation of Faults C and D but occurs along a slightly different rupture plane (through the Room 20 north wall - see Fig. 4) than during EQ VI. The amount of fault slip in this earthquake must exceed 23 cm of dip-slip (measured in sections A and B, fig. 5). Where Fault D shifted Wall J.1:53, a maximum of 30 cm of left-lateral strike-slip was measured. This slip is shared by reactivation in Earthquake IV and the previous Earthquake VI (discussed above). The collapse layer for Earthquake V exceeds 90 cm in places. The tumble is more evenly distributed throughout the site than was the case for the earlier Earthquake VI, with a bias to the north side of collapsing walls. This thick collapse horizon across the site suggests Earthquake V was stronger in intensity compared with Earthquake VI. The majority of the lateral slip across Fault D is likely to have occurred predominantly in Earthquake V (but also moves in Earthquakes VI and IV).- Thomas et al (2007) |
VIII + |
- Earthquake Archeological Effects chart
of Rodríguez-Pascua et al (2013: 221-224)
Earthquake Archeological Effects (EAE)
Rodríguez-Pascua et al (2013: 221-224)
| Effect | Location | Image (s) | Comments | Intensity |
|---|---|---|---|---|
|
various parts of J-east
Fig. 2.15 Faults exposed in the Roman Aqaba Project excavation Area J-East Niemi - Chapter 2 from Parker et al (2014) |
The monumental mudbrick structure experienced fault rupture and collapse of some walls, producing a tumble horizon. The southern wall of Room 13 was ruptured by Fault D and the northern wall of Room 21 by Fault C. This tectonic shift caused substantial localized damage. Earthquake VI produced a total of 10 cm of left-lateral strike-slip measured across Fault C on Wall J.1:26, north of Room 21. This damage from the fault was repaired after Earthquake VI. The strike-slip of Fault D in EQ VI could not be measured because Fault D reactivated in subsequent Earthquakes V and IV. The total strike-slip measured along Wall J.1:53 is 30 cm. Since there was no repair to the wall, this suggests that the majority of the slip was caused by EQ VI. Similarly, the dip-slip could not be directly measured, but later releveling of the southwest corner of the monumental building indicates subsidence did occur. Elsewhere on the site, damage appears not to have been quite as severe, but seismically induced wall failures were repaired in the subsequent occupation phase.- Thomas et al (2007) |
VIII + |
- Earthquake Archeological Effects chart
of Rodríguez-Pascua et al (2013: 221-224)
Earthquake Archeological Effects (EAE)
Rodríguez-Pascua et al (2013: 221-224)
| Effect | Location | Image (s) | Comments | Intensity |
|---|---|---|---|---|
|
J-east
Fig. 2.15 Faults exposed in the Roman Aqaba Project excavation Area J-East Niemi - Chapter 2 from Parker et al (2014) |
|
VIII + | |
|
some structures in Area B
Fig. 8 Plan of the areas excavated by the Roman Aqaba Project, after the 1998 season. Note that the location of Nabataean/Roman Aila is in the area not surveyed by Meloy (courtesy of RAP). JW: Area B is in upper middle of map Dolinka (2003) |
Fig. 14 Tumbled-over mudbricks from the domestic complex in B.1/3 bear witness to the earthquake that ushered in the Abandonment II phase at Aila during the early-2nd century AD (courtesy of RAP) Dolinka (2003) |
|
VIII + |