Introduction
| Source | Image | Description |
|---|---|---|
| Ben-Avraham et al (2012) |
 Fig. 17.1
Tectonic setting of the Dead Sea fault — a transform plate boundary that connects the opening of the Red Sea with the collision in Turkey. Boxes indicate basins along the fault valley discussed in the text.
Ben-Avraham et al (2012) |
Fig. 17.1 - DST Tectonics |
| Source | Image | Description |
|---|---|---|
| Ben-Avraham et al (2012) |

Profiles and location map from the Gulf of Elat.
Ben-Avraham et al (2012) |
Fig. 17.2 - Gulf of Elat |
| Source | Image | Description |
|---|---|---|
| Ben-Avraham et al (2012) |

Profiles from the Zofar basin in the Arava valley.
Ben-Avraham et al (2012) |
Fig. 17.3 - Arava |
| Source | Image | Description |
|---|---|---|
| Ben-Avraham et al (2012) |

Profiles from the Dead Sea basin.
Ben-Avraham et al (2012) |
Fig. 17.4 - Dead Sea Basin |
| Source | Image | Description |
|---|---|---|
| Ben-Avraham et al (2012) |
Profiles from the Dead Sea basin.
Ben-Avraham et al (2012) |
Fig. 17.4 - Dead Sea Basin |
| Source | Image | Description |
|---|---|---|
| Ben-Avraham et al (2012) |
Profiles from the Dead Sea basin.
Ben-Avraham et al (2012) |
Fig. 17.4 - Dead Sea Basin |
| Source | Image | Description |
|---|---|---|
| Ben-Avraham et al (2012) |
 Fig. 17.5
Profiles from the Sea of Galilee. A Location map showing main tectonic elements in the Sea of Galilee area. Bold lines indicated major faults, while dotted lines show the position of seismic profiles. Grey area shows the extent of the Yehudiyya transtensional one (after Shulman et al., 2004). Ben-Avraham et al (2012) |
Fig. 17.5A - Sea of Galilee |
| Ben-Avraham et al (2012) |
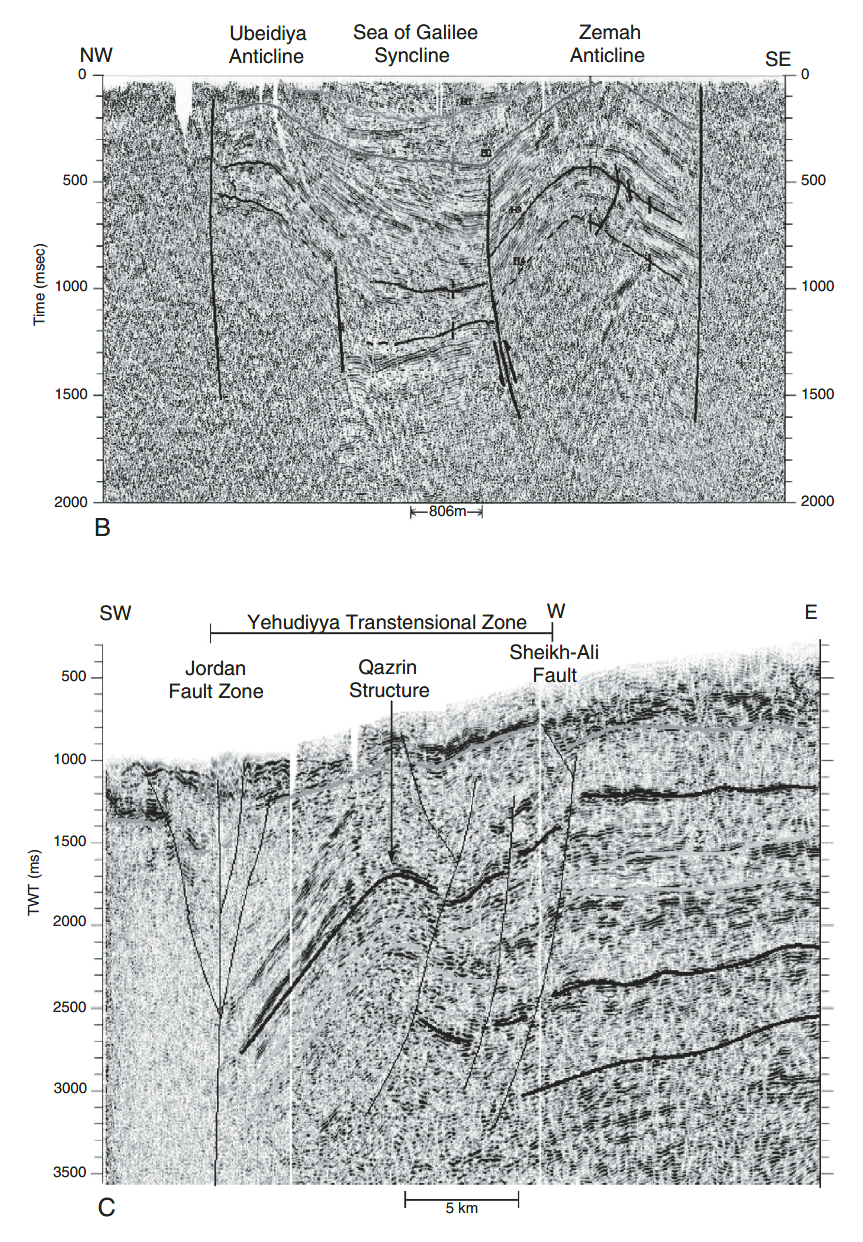 Fig. 17.5 B and C
Profiles from the Sea of Galilee. B Profile from south of the lake showing both compressional and asymmetrical features (Zurieli, 2002). C Profile from north of the lake showing the Yehudiyya transtensional zone. Within the zone lies a compressional feature, the Qazrin structure, which is bordered on the west by the main fault zone (Shulman et al., 2004). Ben-Avraham et al (2012) |
Fig. 17.5 B and C - Sea of Galilee |
| Source | Image | Description |
|---|---|---|
| Ben-Avraham et al (2012) |
 Fig. 17.6
(after Zilberman et al., 2000). Ben-Avraham et al (2012) |
Fig. 17.6 - Hula Basin |
| Source | Image | Description |
|---|---|---|
| Ben-Avraham et al (2012) |
 Fig. 17.7
Ben-Avraham et al (2012) |
Fig. 17.7 - Ghab Basin |
| Source | Image | Description |
|---|---|---|
| Ben-Avraham et al (2012) |
Fig. 17.1 Tectonic setting of the Dead Sea fault — a transform plate boundary that connects the opening of the Red Sea with the collision in Turkey. Boxes indicate basins along the fault valley discussed in the text.
Ben-Avraham et al (2012) |
Fig. 17.1 - DST Tectonics |
| Ben-Avraham et al (2012) |
Profiles and location map from the Gulf of Elat.
Ben-Avraham et al (2012) |
Fig. 17.2 - Gulf of Elat |
| Ben-Avraham et al (2012) |
Profiles from the Zofar basin in the Arava valley.
Ben-Avraham et al (2012) |
Fig. 17.3 - Arava |
| Ben-Avraham et al (2012) |
Profiles from the Dead Sea basin.
Ben-Avraham et al (2012) |
Fig. 17.4 - Dead Sea Basin |
| Ben-Avraham et al (2012) |
Fig. 17.5 Profiles from the Sea of Galilee. A Location map showing main tectonic elements in the Sea of Galilee area. Bold lines indicated major faults, while dotted lines show the position of seismic profiles. Grey area shows the extent of the Yehudiyya transtensional one (after Shulman et al., 2004). Ben-Avraham et al (2012) |
Fig. 17.5A - Sea of Galilee |
| Ben-Avraham et al (2012) |
Fig. 17.5 B and C Profiles from the Sea of Galilee. B Profile from south of the lake showing both compressional and asymmetrical features (Zurieli, 2002). C Profile from north of the lake showing the Yehudiyya transtensional zone. Within the zone lies a compressional feature, the Qazrin structure, which is bordered on the west by the main fault zone (Shulman et al., 2004). Ben-Avraham et al (2012) |
Fig. 17.5 B and C - Sea of Galilee |
| Ben-Avraham et al (2012) |
Fig. 17.6
(after Zilberman et al., 2000). Ben-Avraham et al (2012) |
Fig. 17.6 - Hula Basin |
| Ben-Avraham et al (2012) |
Fig. 17.7
Ben-Avraham et al (2012) |
Fig. 17.7 - Ghab Basin |
Introduction
| Source | Image | Description |
|---|---|---|
| Ben-Avraham et al (2008) |

Seismic profiles and location map from the Gulf of Elat
Ben-Avraham et al (2008) |
Fig. 2 - Gulf of Elat |
| Source | Image | Description |
|---|---|---|
| Ben-Avraham et al (2008) |
Seismic profiles and location map from the Gulf of Elat
Ben-Avraham et al (2008) |
Fig. 2 - Gulf of Elat |
| Source | Image | Description |
|---|---|---|
| Ben-Avraham et al (2008) |
 Fig. 3
Moment release along the central subbasin.
Ben-Avraham et al (2008) |
Fig. 3 - Gulf of Elat |
| Source | Image | Description |
|---|---|---|
| Ben-Avraham et al (2008) |
 Fig. 4a
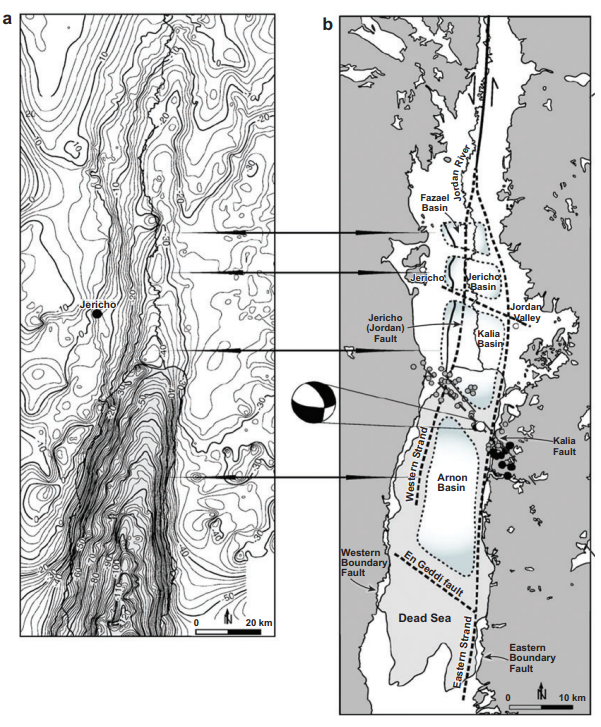
The Dead Sea Basin. A Digital Terrain Map (DTM) image showing the main tectonic elements of the Dead Sea Basin. Faults are marked as heavy lines (dashed where inferred) (after Ben-Avraham 1997). The Dead Sea Basin is divided into two subbasins, which are separated by the Lisan Peninsula, which is a large buried salt diapir. The two basins are thought to be divided by a large oblique normal fault, the Boqeq Fault. The two main strands of the Dead Sea Fault in this area are the Jericho Fault, which borders the northern subbasin on the west, and the Arava Fault, which borders the southern subbasin on the east. Geological profiles shown in b and c are indicated by red lines. Ben-Avraham et al (2008) |
Fig. 4a - DTM Dead Sea Basin |
| Ben-Avraham et al (2008) |
 Fig. 4b
The Dead Sea Basin. E-W geological cross section showing the deep subbasin located in the northern section of the southern Dead Sea Basin. The section is based on seismic reflection, seismic refraction, and drill hole data. Numbers are densities in kg m−3. Gravity models are shown on top (SD 1, Sedom Deep-1 borehole). The deep subbasin is bordered by deep vertical faults; the Sedom Fault in the west and the Ghor Safi Fault, which does not extend to the surface, in the east (after Ben-Avraham & Schubert 2006). Ben-Avraham et al (2008) |
Fig. 4b - Geologic X-section Dead Sea Basin |
| Ben-Avraham et al (2008) |
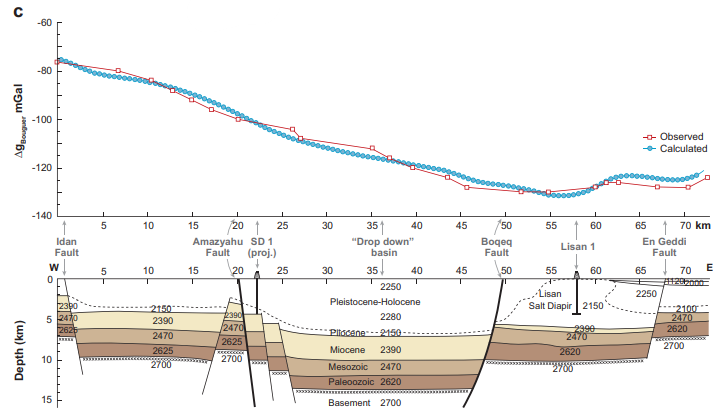 Fig. 4c
The Dead Sea Basin. N-S geological cross section based on prestack depth migration seismic reflection profiles, as well as on the seismic refraction, gravity, and drill hole data. The section shows that the area of the deep subbasin is the deepest part of the Dead Sea Basin. It is bordered by deep vertical faults, the Boqeq Fault in the north, and the Amazyahu Fault in the south. Numbers are densities in kg m−3. Gravity models are shown on top (after Ben-Avraham & Schubert 2006). Ben-Avraham et al (2008) |
Fig. 4c - Geologic X-section Dead Sea Basin |
| Source | Image | Description |
|---|---|---|
| Ben-Avraham et al (2008) |
Fig. 4a The Dead Sea Basin. A Digital Terrain Map (DTM) image showing the main tectonic elements of the Dead Sea Basin. Faults are marked as heavy lines (dashed where inferred) (after Ben-Avraham 1997). The Dead Sea Basin is divided into two subbasins, which are separated by the Lisan Peninsula, which is a large buried salt diapir. The two basins are thought to be divided by a large oblique normal fault, the Boqeq Fault. The two main strands of the Dead Sea Fault in this area are the Jericho Fault, which borders the northern subbasin on the west, and the Arava Fault, which borders the southern subbasin on the east. Geological profiles shown in b and c are indicated by red lines. Ben-Avraham et al (2008) |
Fig. 4a - DTM Dead Sea Basin |
| Ben-Avraham et al (2008) |
Fig. 4b The Dead Sea Basin. E-W geological cross section showing the deep subbasin located in the northern section of the southern Dead Sea Basin. The section is based on seismic reflection, seismic refraction, and drill hole data. Numbers are densities in kg m−3. Gravity models are shown on top (SD 1, Sedom Deep-1 borehole). The deep subbasin is bordered by deep vertical faults; the Sedom Fault in the west and the Ghor Safi Fault, which does not extend to the surface, in the east (after Ben-Avraham & Schubert 2006). Ben-Avraham et al (2008) |
Fig. 4b - Geologic X-section Dead Sea Basin |
| Ben-Avraham et al (2008) |
Fig. 4c The Dead Sea Basin. N-S geological cross section based on prestack depth migration seismic reflection profiles, as well as on the seismic refraction, gravity, and drill hole data. The section shows that the area of the deep subbasin is the deepest part of the Dead Sea Basin. It is bordered by deep vertical faults, the Boqeq Fault in the north, and the Amazyahu Fault in the south. Numbers are densities in kg m−3. Gravity models are shown on top (after Ben-Avraham & Schubert 2006). Ben-Avraham et al (2008) |
Fig. 4c - Geologic X-section Dead Sea Basin |
| Source | Image | Description |
|---|---|---|
| Ben-Avraham et al (2008) |
Comparison of
The location of gravity lows coincides with the subbasins. The transition zone between the Kalia and Jericho basins corresponds to a structural saddle on the Bouguer gravity map and marks the termination of the joint lake-land subbasin. The subbasins marked in this figure indicate the extent of sediment fill close to the surface and not at depth. The moment tensor solution is for the Main shock of the Mb. 5.1 earthquake on February 11, 2004 (after EMSC 2004). Aftershocks are also plotted (data from the Geophysical Institute of Israel). Strands of the main strike-slip fault (dashed lines) are after Garfunkel (1997). Ben-Avraham et al (2008) |
Fig. 5 - Dead Sea Basin sub-basins and Gravity Map |
| Source | Image | Description |
|---|---|---|
| Ben-Avraham et al (2008) |
Fig. 4a The Dead Sea Basin. A Digital Terrain Map (DTM) image showing the main tectonic elements of the Dead Sea Basin. Faults are marked as heavy lines (dashed where inferred) (after Ben-Avraham 1997). The Dead Sea Basin is divided into two subbasins, which are separated by the Lisan Peninsula, which is a large buried salt diapir. The two basins are thought to be divided by a large oblique normal fault, the Boqeq Fault. The two main strands of the Dead Sea Fault in this area are the Jericho Fault, which borders the northern subbasin on the west, and the Arava Fault, which borders the southern subbasin on the east. Geological profiles shown in b and c are indicated by red lines. Ben-Avraham et al (2008) |
Fig. 4a - DTM Dead Sea Basin |
| Ben-Avraham et al (2008) |
Fig. 4b The Dead Sea Basin. E-W geological cross section showing the deep subbasin located in the northern section of the southern Dead Sea Basin. The section is based on seismic reflection, seismic refraction, and drill hole data. Numbers are densities in kg m−3. Gravity models are shown on top (SD 1, Sedom Deep-1 borehole). The deep subbasin is bordered by deep vertical faults; the Sedom Fault in the west and the Ghor Safi Fault, which does not extend to the surface, in the east (after Ben-Avraham & Schubert 2006). Ben-Avraham et al (2008) |
Fig. 4b - Geologic X-section Dead Sea Basin |
| Ben-Avraham et al (2008) |
Fig. 4c The Dead Sea Basin. N-S geological cross section based on prestack depth migration seismic reflection profiles, as well as on the seismic refraction, gravity, and drill hole data. The section shows that the area of the deep subbasin is the deepest part of the Dead Sea Basin. It is bordered by deep vertical faults, the Boqeq Fault in the north, and the Amazyahu Fault in the south. Numbers are densities in kg m−3. Gravity models are shown on top (after Ben-Avraham & Schubert 2006). Ben-Avraham et al (2008) |
Fig. 4c - Geologic X-section Dead Sea Basin |
| Source | Image | Description |
|---|---|---|
| Ben-Avraham et al (2008) |

Ben-Avraham et al (2008) |
Fig. 6 - Tectonic Map Sea of Galilee and Golan Heights |
| Source | Image | Description |
|---|---|---|
| Ben-Avraham et al (2008) |
Ben-Avraham et al (2008) |
Fig. 6 - Tectonic Map Sea of Galilee and Golan Heights |
| Source | Image | Description |
|---|---|---|
| Ben-Avraham et al (2008) |
Ben-Avraham et al (2008) |
Fig. 6 - Tectonic Map Sea of Galilee and Golan Heights |
| Source | Image | Description |
|---|---|---|
| Ben-Avraham et al (2008) |
 Fig. 1
Map of the Dead Sea Fault showing general relative plate motion from the opening of the Red Sea in the south to the collision in the Taurus/Zagros Mountains in the north. Strike-slip motion occurs between the Arabian plate and the Sinai subplate. Owing to this oblique slip, a series of pull-apart basins developed along its length. Ben-Avraham et al (2008) |
Fig. 1 - |
| Ben-Avraham et al (2008) |
Seismic profiles and location map from the Gulf of Elat
Ben-Avraham et al (2008) |
Fig. 2 - |
| Ben-Avraham et al (2008) |
Fig. 3 Moment release along the central subbasin.
Ben-Avraham et al (2008) |
Fig. 3 - |
| Ben-Avraham et al (2008) |
Fig. 4a The Dead Sea Basin. A Digital Terrain Map (DTM) image showing the main tectonic elements of the Dead Sea Basin. Faults are marked as heavy lines (dashed where inferred) (after Ben-Avraham 1997). The Dead Sea Basin is divided into two subbasins, which are separated by the Lisan Peninsula, which is a large buried salt diapir. The two basins are thought to be divided by a large oblique normal fault, the Boqeq Fault. The two main strands of the Dead Sea Fault in this area are the Jericho Fault, which borders the northern subbasin on the west, and the Arava Fault, which borders the southern subbasin on the east. Geological profiles shown in b and c are indicated by red lines. Ben-Avraham et al (2008) |
Fig. 4a - |
| Ben-Avraham et al (2008) |
Fig. 4b The Dead Sea Basin. E-W geological cross section showing the deep subbasin located in the northern section of the southern Dead Sea Basin. The section is based on seismic reflection, seismic refraction, and drill hole data. Numbers are densities in kg m−3. Gravity models are shown on top (SD 1, Sedom Deep-1 borehole). The deep subbasin is bordered by deep vertical faults; the Sedom Fault in the west and the Ghor Safi Fault, which does not extend to the surface, in the east (after Ben-Avraham & Schubert 2006). Ben-Avraham et al (2008) |
Fig. 4b - |
| Ben-Avraham et al (2008) |
Fig. 4c The Dead Sea Basin. N-S geological cross section based on prestack depth migration seismic reflection profiles, as well as on the seismic refraction, gravity, and drill hole data. The section shows that the area of the deep subbasin is the deepest part of the Dead Sea Basin. It is bordered by deep vertical faults, the Boqeq Fault in the north, and the Amazyahu Fault in the south. Numbers are densities in kg m−3. Gravity models are shown on top (after Ben-Avraham & Schubert 2006). Ben-Avraham et al (2008) |
Fig. 4c - |
| Ben-Avraham et al (2008) |
Comparison of
The location of gravity lows coincides with the subbasins. The transition zone between the Kalia and Jericho basins corresponds to a structural saddle on the Bouguer gravity map and marks the termination of the joint lake-land subbasin. The subbasins marked in this figure indicate the extent of sediment fill close to the surface and not at depth. The moment tensor solution is for the Main shock of the Mb. 5.1 earthquake on February 11, 2004 (after EMSC 2004). Aftershocks are also plotted (data from the Geophysical Institute of Israel). Strands of the main strike-slip fault (dashed lines) are after Garfunkel (1997). Ben-Avraham et al (2008) |
Fig. 5 - |
| Ben-Avraham et al (2008) |
Ben-Avraham et al (2008) |
Fig. 6 - |
The Levant continental margin is divided into two units. From south to north these are Negev, Judea-Samaria, major segments by the Carmel structure, which and Galilee-Lebanon (Figure 2b). Ben-Gai and Ben-Avraham extends from the Dead Sea fault into the eastern [1995] divided the Levant continental margin into two crustal Mediterranean.
...
On the basis of seismicrefraction [Ginzburg and Ben-Avraham, 1992; Ben-Avrahamet al., 2002], gravity [e.g., Ben-Avraham and Ginzburg,1990] and magnetics [Ben-Avraham and Ginzburg, 1986], the area onland was divided into several distinct crustal units. From south to north these are Negev, Judea-Samaria, and Galilee-Lebanon (Figure 2b). Ben-Gai and Ben-Avraham [1995] divided the Levant continental margin into two crustal segments north and south of the Cannel structure, which correspond to the division onland between Judea-Samaria and Galilee-Lebanon. This is clearly seen in the pattern of the magnetic field [Folkman, 1980; Ben-Avraham and Ginzburg, 1986; Rybakov et al., 2000] and suggests that these segments were probably formed through different breakup processes [Ginzburg et al., 1975; Neev and Ben-Avraham, 1977; Ben-Avraham and Hall, 1977; Ginzburg and Ben-Avraham, 1992]. Offshore, Ben-Avraham and Ginzburg [1990] distinguished between the crustal structure of the Levant Basin and the Eratosthenes seamount. The Levant Basin crustal unit is underlined by oceanic crust, covered by a 10-14 km thick sedimentary sequence [Ben-Avraham et al., 2002]. In this area only the upper 3 km of the subsurface are known in detail, offshore the southern seg¬ment of the Levant margin [Garfunkel, 1998]. However, little is known about the subsurface of the basin offshore the northern segment.
| Description | Image | Source |
|---|---|---|
| Fig. 1 - DTM Map E Med. |
 Fig. 1
Digital terrain map (DTM) of the eastern Mediterranean basin showing the Levant continental margin, major tectonic elements [after Walley, 1998; Bartov et al., 2000; Shulman et al., 2004], location of disturbances (Gaza (G) and Palmahim (P)), and major submarine canyons (Achziv (A) and Damur (D)). Note the different appearance of the relief north and south of the Carmel (C) (which branches from the Dead Sea fault system, onland as well as offshore. Extension of the Carmel fault beyond the continental margin is marked after Garfunkel and Almagor [1985]. White frame indicates extent of the study area. Inset shows general tectonic framework. DST, Dead Sea transform. Ben-Avraham et al (2006) |
Ben-Avraham et al (2006) |
| Fig. 2 - Formation of Levant Basin |
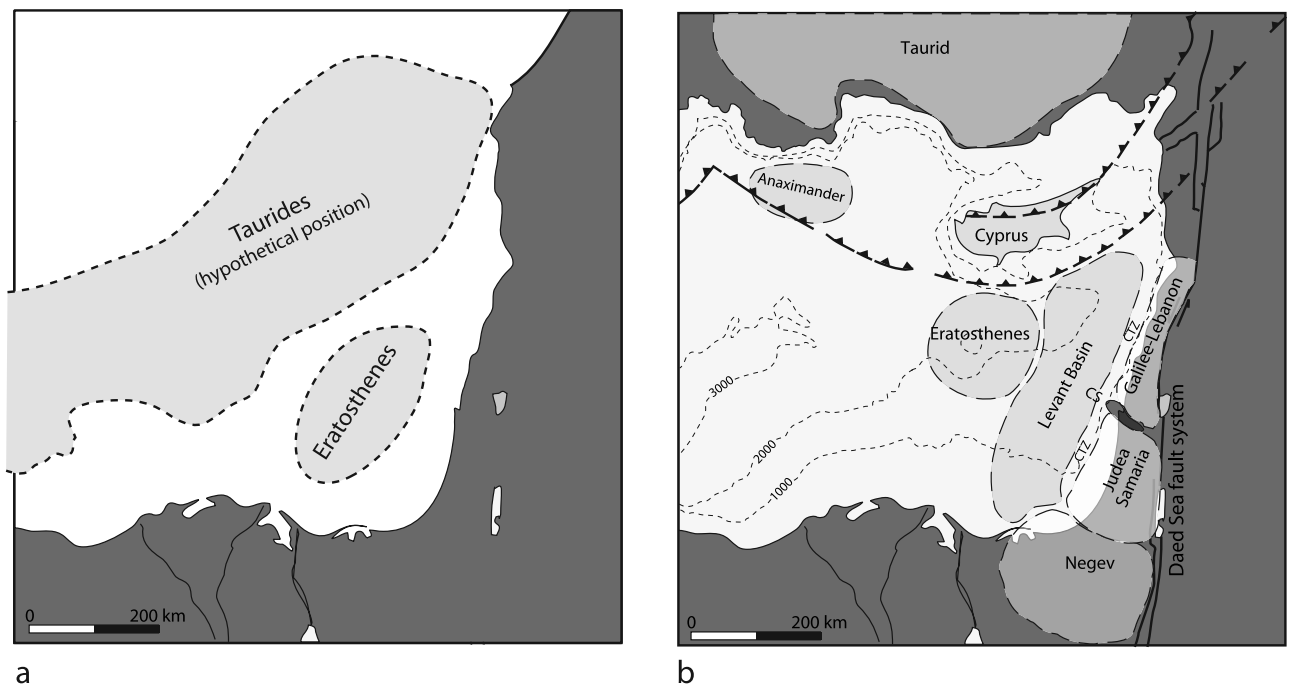 Fig. 2
Levant continental margin
Ben-Avraham et al (2006) |
Ben-Avraham et al (2006) |
| Fig. 3 - Seismic Survey Lines |
 Fig. 3
Location map of the three seismic surveys used for this study. Dotted lines present previously unpublished single-channel seismic data from offshore Lebanon, while dashed and solid lines are multichannel and single-channel data from the southern Levant, respectively. Figures mentioned in the text are indicated. Ben-Avraham et al (2006) |
Ben-Avraham et al (2006) |
| Fig. 4 - Magnetic Intensity Anomaly Map |
 Fig. 4
Total magnetic intensity anomaly with contour interval of 10 nT in red [after Ben-Avraham and Ginzburg, 1986]. Nature and trend of the magnetic anomalies are discussed in the text. This map is superimposed on the bathymetry (black contours). The prominent magnetic anomaly in the northeastern corner of the map is located directly above the steep and narrow continental slope of the Lebanese margin. Ben-Avraham et al (2006) |
Ben-Avraham et al (2006) |
| Fig. 5 - Bathymetry/Topography and Top and Base of Messinian Evaporitic Sequence |

Comparison between
Note the general similarity between the present-day bathymetry within the basin (Figure 5a) and the pre-Messinian surface (Figure 5c). Dashed white line on bathymetric map marks the overlapping area between the maps. White arrows on Figures 5b and 5c mark a sharp jump in the contours discussed in the text. Black arrow on Figure 5b points to the area where the average depth of the top Messinian increases. Dashed black line on Figure 5a indicates the location of box-shaped scar delimiting the head of the Damur canyons (DC). Ben-Avraham et al (2006) |
Ben-Avraham et al (2006) |
| Fig. 6 - Offshore Lebanon Profile |

Single-channel seismic profile 6 (top) offshore Lebanon with (bottom) interpretation showing the main sedimentary and tectonic features (see inset for location) (modified after Ben-Avraham and Ginzburg [1986] with permission from Elsevier). The thinly spaced high-frequency reflectors comprising unit P represent Plio-Pleistocene sediments, which thicken eastward. Below the Messinian evaporitic unit appears between the M (top) and N (bottom) horizons as a sequence of diffused horizons. At the base of the continental slope, these two sedimentary units are highly deformed forming the deformation belt (DB), which is discussed in the text. A prominent strike-slip fault, the Damur fault (DF), is visible within this deformation belt (see also Figure 15). The bathymetry of the continental slope is cut by a marine canyon (C), where most of the Plio-Pleistocene sequence was removed. A dashed line on the interpretation schematically indicates the original slope. West of the DB, reflectors within the Messinian evaporitic sequence exhibit low-amplitude undulations. At the surface, two bathymetric steps are observed above shallow growth faults (black lines in the interpretation). The magnetic intensity anomaly values (in nT) obtained along the profile are shown in Figure 6 (top). Thick black vertical lines indicate growth faults mentioned in the text, with possible strike slip motion (sense of motion is T, toward, A, away). The fault that limits the deformation belt on the west is a N-S trending sinistral strike-slip fault, while the Damur fault is a WSW-ENE trending dextral fault. D indicates salt diapirs. Ben-Avraham et al (2006) |
Ben-Avraham et al (2006) |
| Fig. 7 - Profile 11 |
 Fig. 7
Single-channel seismic profile 11 showing similar sedimentary and tectonic features observed in Figure 6. See inset for location. The submarine canyon (C) is not perpendicular to the continental slope but is angled, and therefore the Plio-Pleistocene sequence was preserved to the west of this feature and on the steep slope (P). A dashed line schematically indicates the original slope. Deformations of the PlioPleistocene section, within the DB, are more intense than the area north of this profile (e.g., Figure 6), and the sedimentary units are less defined laterally. CFZ marks the extent of the Carmel fault zone in this area. Ben-Avraham et al (2006) |
Ben-Avraham et al (2006) |
| Fig. 8 - Profile 1 |

Single-channel seismic profile 1 showing similar sedimentary and tectonic features observed in Figure 6. See inset for location. The Plio-Pleistocene sequence thickens dramatically toward the east above the highly deformed Messinian evaporites. Pronounced growth faults cut through the sedimentary sequence, at least from the Messinian evaporites to the seafloor (marked by black lines in the blowup in bottom panel). Asterisks mark slope-perpendicular hummocky ridges resulting from sedimentary deformations within the DB. These ridges can be clearly observed in the northern part of the DB but are less distinguishable in its south (Figure 12b). D indicates salt diapirs discussed in the text. Other annotations are the same as in Figure 6. The strike-slip fault delimits the deformation belt in the west (sense of motion is T, toward, A, away). Ben-Avraham et al (2006) |
Ben-Avraham et al (2006) |
| Fig. 9 - Profile S of Carmel Structure |
 Fig. 9
Single-channel seismic profile located south of the Carmel structure showing different behavior of the Messinian-Recent sedimentary sequence than that observed to the north. Profile and interpretation are after Tibor and Ben-Avraham [1992] (with permission from Elsevier). See inset for location. The sigmoidal progradation sequence is low-angled because of accumulation of Nile-derived sediments in a low-energy depositional environment. The volume of these sediments is lower to nonexistent offshore Lebanon. Ben-Avraham et al (2006) |
Ben-Avraham et al (2006) |
| Fig. 10 - Profile 4 |
 Fig. 10
Single-channel seismic profile 4 showing similar sedimentary and tectonic features observed in Figure 6. See inset for location. A high-angle, sigmoidal prograding clinoforms sequence (SC) of the Plio-Pleistocene section developed on the steep continental slope. The angle of this feature is markedly steeper than similar features observed south of the Carmel structure (e.g., Figure 9). In contrast to Figures 6 and 7 the original continental slope was preserved in this area. Ben-Avraham et al (2006) |
Ben-Avraham et al (2006) |
| Fig. 11 - Profile S of Carmel Structure |
 Fig. 11
Single-channel seismic profile located south of the Carmel structure. The continental slope is much gentler, and the appearance of the Plio-Pleistocene section, in the deformation belt, is not as well defined as north of the Carmel structure. Ben-Avraham et al (2006) |
Ben-Avraham et al (2006) |
| Fig. 12 - Map of Major Tectonic Elements |

(a) Map of major tectonic elements in the central Levant and offshore above the DTM of the region. Colored lines mark features interpreted in this study (see legend for explanation). Dashed red lines indicate the transition between the northern and southern deformation belts, which cannot be mapped owing to a gap in the seismic data. The faults onland are based on the work by Walley [1998], Bartov et al. [2000], and Shulman et al. [2004]; and the Carmel fault zone (CFZ) offshore is according to Schattner et al. [2006]. White box indicates the location of Figure 12b, which presents a detailed bathymetric map offshore Lebanon (SHALIMAR survey [Ifremer, 2005]).
These elements are discussed in the text. Ben-Avraham et al (2006) |
Ben-Avraham et al (2006) |
| Fig. 13 - Isopach depth map of Messinian evaporitic sequence |
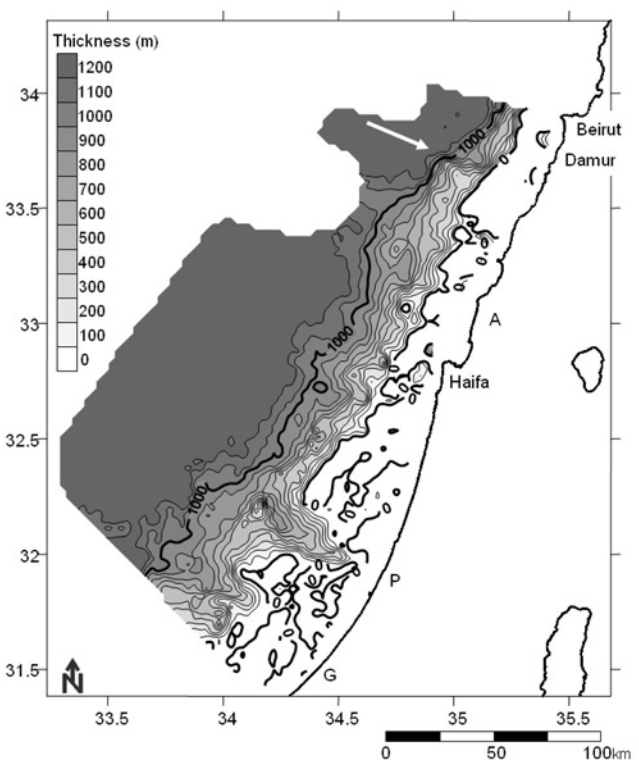 Fig. 13
Isopach depth map of the Messinian evaporitic sequence with thickness ranging from ~1200 m in the Levant Basin to 0 at the continental slope. In the south, this sequence fills pre-Messinian features (Palmahim and Gaza disturbances). White arrow points to a sharp bend in contours evident offshore Damur and discussed in the text (Damur canyons). Ben-Avraham et al (2006) |
Ben-Avraham et al (2006) |
| Fig. 14 - Shelf Marginal Wedge S Lebanon vs. Central Israel Depositional Model |

Comparison of
All the profiles are aligned with a vertical dashed line that represents the location of the shelf edge. The profiles (in Figures 14a and 14b) are presented in the same vertical and horizontal scale. The ancient shelf edge, marked by an arrow on Figure 14a, is now part of the continental slope of southern Lebanon.
Ben-Avraham et al (2006) |
Ben-Avraham et al (2006) |
| Fig. 15 - Shore Perpindicular Seismic Profiles and one Shore Parallel Seismic Profile |
 Fig. 15
Sections of three shore perpendicular seismic profiles (profiles 5, 6, and 7) and one shore-parallel (profile B) cutting across the Damur fault (see text for explanation). Black lines mark the location of the Damur fault. Strike-slip motion is inferred by different thicknesses of the Messinian evaporites on both sides of the fault in the shore parallel profile B. The solid lines on profile B indicate the N horizon. Sense of motion is T, toward, A, away. Ben-Avraham et al (2006) |
Ben-Avraham et al (2006) |
| Fig. 16 - Seismic Profiles 3, 4, & 5 |
 Fig. 16
Three consecutive seismic profiles, from north to south, profiles 3, 4, and 5, showing local narrowing of the deformation belt offshore Damur (black arrows). The narrowing occurs just north of the Damur fault (marked by a blue line on Figure 12). Ben-Avraham et al (2006) |
Ben-Avraham et al (2006) |
Elias et al (2007) and previous researchers (Morhange et al, 2006) examined uplifted benches on the Lebanese coast between Sarafand and Tripolis; some in the vicinity of Tabarja (~20 km. NE of Beirut). They radiocarbon dated fossil Vermetids on the tops of these benches in order to estimate when the bench top was last in the sub tidal zone (which approximates mean sea level). They identified four uplifts from
- Fig 2c Bench elevations from Elias et al (2007)
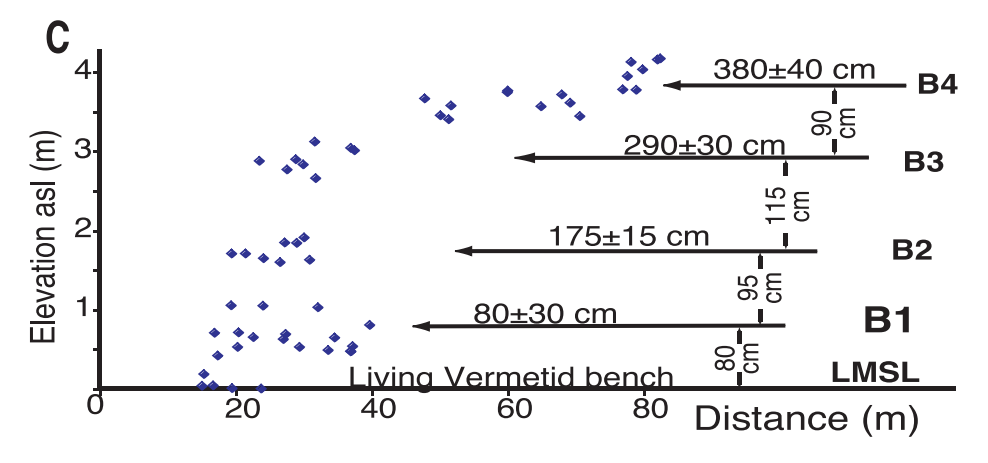
Projected total station measurements of bench elevations relative to LMSL (living vermetid surface in swash zone). Note signifi cant scatter in elevation measurements on fossil levels, particularly B1 and B4, likely because of sub-levels with rounded edges and of irregularities due to deep pitting by microkarst.
Elias et al (2007)- Fig 1 Coastal uplift for the northern DST
from Elias et al (2007)
Fig.1
- Location map of the Mediterranean (created using GMT) showing the Levant continental margin
- Dendropoma petraeum sampling sites are marked (red circles) on the regional DTM (courtesy — J.K. Hall). Circle size denotes the age of the sample in calibrated years before present. White lines denote major plate boundaries and tectonic faults mentioned in the text. The four segments appear as
Faults are marked after Westaway (2004) and Schattner et al. (2006). Abbreviations:
- GL=Galilee–Lebanon
- LM=Lebanon Mountains
- NL=Northern Lebanon
- WS=Western Syria
- CS= Carmel structure
- CF= Carmel fault
- CFZ= Carmel fault zone
- RF=Roum fault
- WLF, Western Lebanon flexure
- LRB=Lebanese restraining bend
- DSF= Dead Sea fault
- Elevation of K–D contacts above biological sea level plotted against latitude of sampling sites. A gray bar of ±10 cm marks the error of measurement around the present day sea level. Measured values are marked (red) denoting the sample age in calibrated years before present. Time weighted tectonic displacement calculations are marked (blue) with vertical error bars of ±20 cm
Sivan et al (2010)
3 or more [sizeable Mw = ~7.5] earthquakesin the past ca. 6-7 ka. They attributed the latest uplift (B1) to the 551 CE Beirut Quake while the earlier events (B2, B3, and B4) were no more precisely dated than between ~5000 BCE and 551 CE. Bench uplift on the earlier events (B2, B3, and B4) would likely have been due to uplift on the Mount Lebanon Thrust system - as was surmised for Event B1 and the 551 CE Beirut Quake.
within the range of error (±10 cm) at present day mean sea levelin the northern Israeli coast to up to +390 cm at the Orontes north site in Turkey. They noted the following
This positive gradient in vertical tectonic displacement could have been explained by elastic bending of the plate. However, studies from the last several decades show that the region is extensively faulted and folded (e.g., Freund and Tarling, 1979; Beydoun, 1981; Ron, 1987; Walley, 1998; Ben-Avraham et al., 2006; Schattner et al., 2006; Elias et al., 2007; Carton et al., 2009). Therefore the gradient suggests a northward increase in brittle failure of the Levantine coast during the Late Holocene.They divided the coast into structural segments which they described and interpreted tectonically in the table below:
| Segment | Description | Interpretation |
|---|---|---|
| south of Galilee–Lebanon | south of the Carmel fault | The smallest vertical displacement values 1.5 cm (Habonim site, Table 1), calculated for northern Israel, correspond well with the zero displacement reported by Wdowinski et al. (2004) based on GPS measurements. Negligible vertical displacement was also reported based on archaeological evidence: the Galilee coast was stable for the last 3000– 4000 years (Sivan and Galili, 1999), while coastal sites in Caesarea indicate stability for the last 2000 years (Sivan et al., 2004). Since northern Israel was shown to be in isostatic equilibrium (Segev et al., 2006) the negligible vertical displacements suggest that it is tectonically stable (vertical displacements) during the last two millennia. Hence any measured change in relative sea level in this region stems conclusively from eustasy. |
| Galilee–Lebanon | bounded by the Carmel and Roum faults (south and north) | Further north along the coast of southern Lebanon (Galilee– Lebanon structural segment) slightly larger values are calculated for the vertical tectonic displacement, between 50 and 150 cm (sites ZireSaida, Ras Qantara, Hotel Mounes and Ras Abou Zeid, Table 1; Marriner and Morhange, 2005; Morhange et al., 2006). Along this segment, which is bounded by the Roum fault in the north, the topography becomes progressively more prominent (∼1000 m) northwards (Schattner et al., 2006 and references therein). Internal deformations produced by the nearby DSF are manifested by second order southwest trending dextral faults (Ron, 1987; Walley, 1998) which extend to the Levantine coast. Our results show that differential vertical displacement occurs along the coast of the Galilee–Lebanon segment during the Holocene |
| Lebanon Mountains | consists of the Western Lebanon Flexure (Walley, 1998) of the highly elevated part of the Lebanese restraining bend. This segment is bounded to the west by the marine “Beirut–Tripoli thrust” (after Daëron et al., 2001) | Much higher displacement values are calculated for the Lebanon Mountains segment north and east of the Roum fault. Both this segments and the Galilee–Lebanon are located along the Lebanese restraining bend, a right-step of the sinistral DSF along the NNE trending Yammunneh fault (Fig. 1). This slight divergence from the Nstriking axis of the DSF induces crustal overlap which is mainly absorbed by north-westward push of the Lebanon Mountains segment against the marine Beirut–Tripoli thrust (Schattner et al., 2006 and references therein). The highly elevated topography of this segment (∼3000 m) is not in isostatic equilibrium (Segev et al., 2006). It extends from the Lebanon and Anti-Lebanon mountains through the western Lebanon flexure to the coastline, where our results show high displacement values for the Holocene period, ranging between 60 and 340 cm (sites Phare, Palmier, Hannouch, Ras Koubba, Selaata, Ras Madfoun, Fidar sud, Nahr Ibrahim, North of Bouar, Safra, Tabarja, and South of Tabarja, Table 1; Sanlaville et al., 1997; Morhange et al., 2006). |
| Northern Lebanon | a low laying topography juxtaposed from the south to the Cyprus arc convergent plate boundary | Only one Dendropoma site was measured along the coast of the northern Lebanese segment (site Tell Soukas, Table 1; Fig. 1; Sanlaville et al., 1997). In this low topography segment the calculated vertical displacement is 41 cm. The site is located closely south to the intersection of the Levantine coast with the Larnaka ridge (part of the Cyprus arc convergence plate margin). North of the Larnaka ridge, however, displacements show higher values, ranging between 40 and 130 cm (sites Ras Ibn Hani, Ras el Karm (Ibn Hani) and Maksar, Table 1; Sanlaville et al., 1997). This jump in displacement values reflects the active convergence across the easternmost Cyprus arc, where the latter sites are overthrusted. |
| Western Syria | consists a part of the triple junction between the DSF, East Anatolian fault and the Cyprus arc. Two main ridges of the arc deform the coasts of this segment — Latakia and Larnaka ridges (e.g., Kempler, 1998; Robertson, 1998). | A similar change in the amount of vertical displacement is observed further north across the Latakia Ridge (part of the Cyprus arc convergence plate margin; Fig. 1). In Ras el Bassit site, south of the ridge, values range between 70 and 106 cm, while north of it vertical displacement extends between 142 and 360 cm — the highest values obtained along the entire margin (sites Orontes north, Table 1; Pirazzoli et al., 1991; Sanlaville et al., 1997). The northernmost sites (sites Guverdijne Kaya south, Table 1; Sanlaville et al., 1997) are also displaced and are located along the Kyrenia–Misis Ridge of the Cyprus arc. Here the values range between 85 and 230 cm, yet no comparable sites were sampled across the ridge |
| Source | Image | Description |
|---|---|---|
| Aldersons and Ben-Avraham (2014) |
 Fig. 3.1
Depth section of well-constrained seismicity (410 earthquakes, 1984–1997) along the Dead Sea transform (DST) from Aqaba-Elat to the Sea of Galilee. The square grid fill defines the Dead Sea Basin on the map. Conrad and Moho discontinuities from Ginzburg et al. (1981) (From Aldersons et al. 2003) Aldersons and Ben-Avraham (2014) |
Fig. 3.1 - Depth section of well-constrained seismicity |
| Aldersons and Ben-Avraham (2014) |
 Fig. 3.2
MW 5.3 earthquake of 11 February 2004, 08 h 15 m. Epicenters according to ISC, EMSC, JSO Bulletin, HOF: Hofstetter et al. (2008), EAT: Al-Tarazi et al. (2006), ELN: Abou Elenean et al. (2009), GII+JSO: this study (separate locations from GII seismograms alone and from JSO seismograms alone in dark grey, connected to final location by red lines). Israel Transverse Mercator (ITM) grid coordinates (km) Aldersons and Ben-Avraham (2014) |
Fig. 3.2 - MW 5.3 earthquake of 11 February 2004 |
| Aldersons and Ben-Avraham (2014) |
 Fig. 3.3
MW 5.3 earthquake of 11 February 2004, 08 h 15 m. Depths and uncertainties according to ELN: Abou Elenean et al. (2009), HOF: Hofstetter et al. (2008), EAT: Al-Tarazi et al. (2006), ALD: this study, JSO Bulletin, pP (ISC), ISC and EMSC. Upper-crustal depths in yellow, lowercrustal depths in dark blue Aldersons and Ben-Avraham (2014 |
Fig. 3.3 - MW 5.3 earthquake of 11 February 2004 |
| Aldersons and Ben-Avraham (2014) |
 Fig. 3.4
Depth distribution for the 188 earthquakes (1986–2001) of the MPX dataset in the Dead Sea basin (0.3 ≤ ML ≤ 3.5), and depth of the MW 5.3 earthquake of 11 February 2004.
Aldersons and Ben-Avraham (2014) |
Fig. 3.4 - Depth distribution for the 188 earthquakes (1986–2001) |
| Aldersons and Ben-Avraham (2014) |
 Fig. 3.5
Focal depths of well-constrained seismicity in the Dead Sea basin (30°25′N ≤ Lat ≤ 32°12′N, 34°52′E ≤ Lon ≤ 35°40′E). Braeuer et al. (2012b) in the southern Dead Sea basin (31°00′N ≤ Lat ≤ 31°28′N, 35°18′E ≤ Lon ≤ 35°39′E).
Aldersons and Ben-Avraham (2014) |
Fig. 3.5 - Depth distribution for the 188 earthquakes (1986–2001) |
| Aldersons and Ben-Avraham (2014) |
 Fig. 3.6
MW 6.3 earthquake of 11 July 1927: instrumental epicenters and macroseismic epicentral regions.
Uncertainty ellipses in yellow. Israel Transverse Mercator (ITM) grid coordinates (km) Aldersons and Ben-Avraham (2014) |
Fig. 3.6 - MW 6.3 earthquake of 11 July 1927 |
| Aldersons and Ben-Avraham (2014) |
 Fig. 3.7
Isoseismal map (MMI) of the earthquake of 11 July 1927 according to Vered and Striem (1977). ISS (1927): instrumental epicenter from ISS. SHA (1993): instrumental epicenter from Shapira et al. (1993). ISC-GEM: instrumental epicenter from ISC-GEM (Storchak et al. 2013). The area in red (MMI=IX) defines the macroseismic epicentral region according to the authors. Israel Transverse Mercator (ITM) grid coordinates (km). (Redrawn from original publication) Aldersons and Ben-Avraham (2014) |
Fig. 3.7 - Isoseismal map (MMI) of the earthquake of 11 July 1927 |
| Aldersons and Ben-Avraham (2014) |
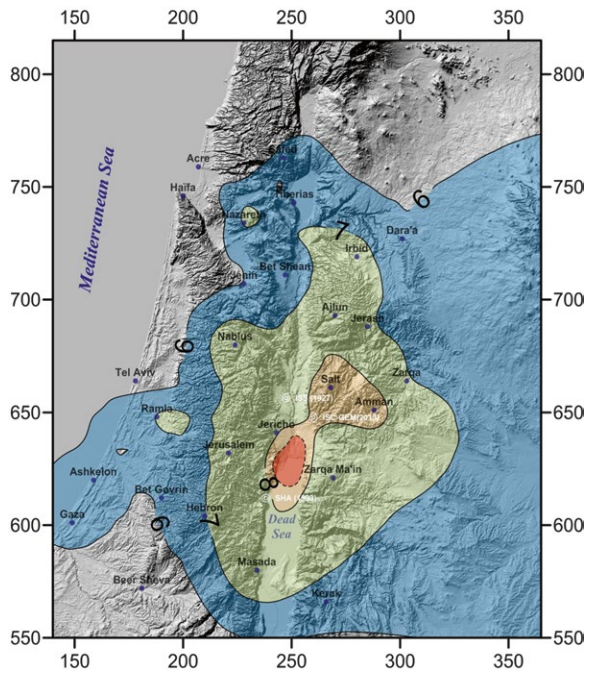 Fig. 3.8
Isoseismal map (MSK) of the earthquake of 11 July 1927 produced by kriging of Mean Intensities determined by Avni (1999), and published by Zohar and Marco (2012). ISS (1927): instrumental epicenter from ISS. SHA (1993): instrumental epicenter from Shapira et al. (1993). ISC-GEM: instrumental epicenter from ISC-GEM (Storchak et al. 2013). The area in red defines the macroseismic epicentral region (drawn by hand) according to this dataset. Israel Transverse Mercator (ITM) grid coordinates (km) Aldersons and Ben-Avraham (2014) |
Fig. 3.8 - Isoseismal map (MSK) of the earthquake of 11 July 1927 |
| Aldersons and Ben-Avraham (2014) |
 Fig. 3.9
Preferred epicenter, and tentative causative fault (Version 1) of the MW 6.3 earthquake of 11 July 1927. Epicenter at red concentric circles. Epicentral location uncertainty as dashed yellow ellipse. Subsurface causative fault trace as red dashed line (36 km long). Isoseismal intensity MSK=VIII curve produced by kriging of Mean Intensities determined by Avni (1999), and published by Zohar and Marco (2012). Mean Intensity (MSK) values determined by Avni (1999) in yellow. Macroseismic epicentral region, according to this dataset, drawn by hand in red. ISS (1927): instrumental epicenter from ISS. SHA (1993): instrumental epicenter from Shapira et al. (1993). ISC-GEM: instrumental epicenter from Storchak et al. (2013). White asterisk on the northern shore of the Dead Sea: alledged location of photograph in Fig. 3.11. Israel Transverse Mercator (ITM) grid coordinates (km) Aldersons and Ben-Avraham (2014) |
Fig. 3.9 - Preferred epicenter, and tentative causative fault (Version 1) of the MW 6.3 earthquake of 11 July 1927 |
| Aldersons and Ben-Avraham (2014) |
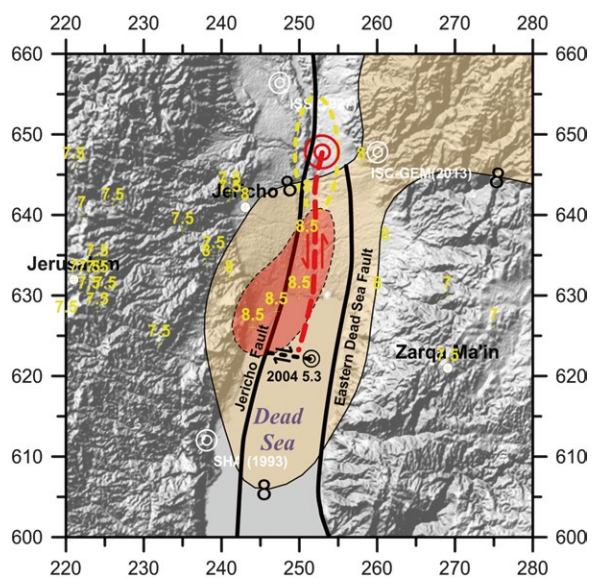 Fig. 3.10
Preferred epicenter, and tentative causative fault (Version 2) of the MW 6.3 earthquake of 11 July 1927. Epicenter of the 1927 earthquake at red concentric circles. Epicentral location uncertainty as dashed yellow ellipse. Subsurface causative fault trace as red dashed line (25 km long). Epicenter of the MW 5.3 earthquake of 11 February 2004 at black concentric circles, and subsurface fault trace as black dashed line. 1927 Isoseismal intensity MSK=VIII curve produced by kriging of Mean Intensities determined by Avni (1999), and published by Zohar and Marco (2012). Mean Intensity (MSK) values determined by Avni (1999) in yellow. Macroseismic epicentral region, according to this dataset, drawn by hand in red. ISS (1927): instrumental epicenter from ISS. SHA (1993): instrumental epicenter from Shapira et al. (1993). ISC-GEM: instrumental epicenter from Storchak et al. (2013). White asterisk on the northern shore of the Dead Sea: alledged location of photograph in Fig. 3.11. Israel Transverse Mercator (ITM) grid coordinates (km) Aldersons and Ben-Avraham (2014) |
Fig. 3.10 - Preferred epicenter, and tentative causative fault (Version 2) of the MW 6.3 earthquake of 11 July 1927 |
| Aldersons and Ben-Avraham (2014) |
 Fig. 3.11
Ground fissures caused by the 1927 earthquake. Possible location close to the Jordan River estuary at the Dead Sea. View probably from south to north, taken in the morning according to the direction of the shade (see Figs. 3.9 or 3.10 for possible location). Estimated intensity MSK=VIII (IX) (Photograph from American Colony, Jerusalem. Matson Photograph Collection) Aldersons and Ben-Avraham (2014) |
Fig. 3.11 - Ground fissures caused by the 1927 earthquake |
| Aldersons and Ben-Avraham (2014) |
 Fig. 3.12
Rheology of the Dead Sea Basin
Aldersons and Ben-Avraham (2014) |
Fig. 3.12 - Rheology of the Dead Sea Basin |
| Aldersons and Ben-Avraham (2014) |
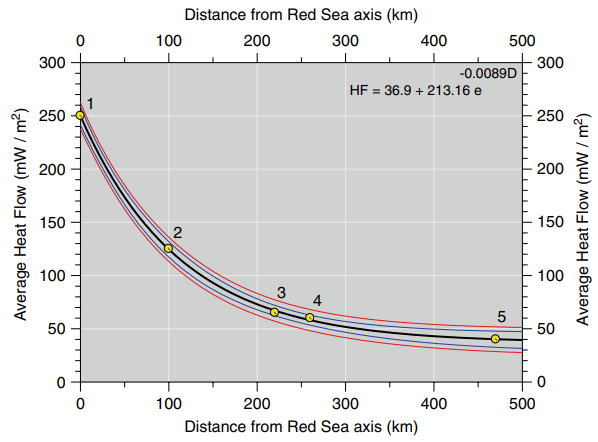 Fig. 3.13
Surface Heatow from the Red Sea axis to the Dead Sea basin
95 % confidence and prediction bands in red and blue respectively Aldersons and Ben-Avraham (2014) |
Fig. 3.13 - Rheology of the Dead Sea Basin |
| Aldersons and Ben-Avraham (2014) |
 Fig. 3.14
Temperature distribution along the Dead Sea Fault from the Sea of Galilee to the Gulf of Aqaba-Elat. Temperatures derived from the surface heat flow (top). Seismogenic zone (red dashed line) derived from the EMSC 2011 catalogue (Godey et al. 2006) for the entire profile, Aldersons et al. (2003) and Shamir (2006) for the Dead Sea area, and Navon (2011) for the Sea of Galilee area (From Shalev et al. 2012) Aldersons and Ben-Avraham (2014) |
Fig. 3.14 - Temperature distribution along the Dead Sea Fault from the Sea of Galilee to the Gulf of Aqaba-Elat |
| Aldersons and Ben-Avraham (2014) |
 Fig. 3.15
Isoseismal map (MSK) of the earthquake of 11 July 1927 produced by kriging of Mode Intensities determined by Avni (1999), and published by Zohar and Marco (2012). ISS (1927): instrumental epicenter from ISS. SHA (1993): instrumental epicenter from Shapira et al. (1993). ISC-GEM: instrumental epicenter from ISC-GEM (Storchak et al. 2013). The area in red (MSK=IX) defines the macroseismic epicentral region (drawn by hand) according to this dataset. Israel Transverse Mercator (ITM) grid coordinates (km) Aldersons and Ben-Avraham (2014) |
Fig. 3.15 - Isoseismal map (MSK) of the earthquake of 11 July 1927 produced by kriging of Mode Intensities determined by Avni (1999) |
| Aldersons and Ben-Avraham (2014) |
 Fig. 3.16
Isoseismal map (MSK) of the earthquake of 11 July 1927 produced by kriging of Max Intensities determined by Avni (1999), and published by Zohar and Marco (2012). ISS (1927): instrumental epicenter from ISS. SHA (1993): instrumental epicenter from Shapira et al. (1993). ISC-GEM: instrumental epicenter from ISC-GEM (Storchak et al. 2013). The area in red (MSK=IX) defines the macroseismic epicentral region (drawn by hand) according to this dataset. Israel Transverse Mercator (ITM) grid coordinates (km) Aldersons and Ben-Avraham (2014) |
Fig. 3.16 - Isoseismal map (MSK) of the earthquake of 11 July 1927 produced by kriging of Max Intensities determined by Avni (1999) |
| Aldersons and Ben-Avraham (2014) |
 Fig. 3.17
Isoseismal map (MSK) of the earthquake of 11 July 1927 produced by kriging of Modal Intensities determined by Avni (1999) and Corrected for site attributes (± 1 unit MSK) by Zohar and Marco (2012). ISS (1927): instrumental epicenter from ISS. SHA (1993): instrumental epicenter from Shapira et al. (1993). ISC-GEM: instrumental epicenter from ISC-GEM (Storchak et al. 2013). The area in red (MSK=VIII) defines the macroseismic epicentral region (drawn by hand) according to this dataset. The region in green defines the macroseismic epicentral region according to the regressions of Zohar and Marco (2012). Israel Transverse Mercator (ITM) grid coordinates (km) Aldersons and Ben-Avraham (2014) |
Fig. 3.17 - Isoseismal map (MSK) of the earthquake of 11 July 1927 produced by kriging of Modal Intensities determined by Avni (1999) |
| Aldersons and Ben-Avraham (2014) |
 Table 3.1
Velocity model Dead Sea 2013 (in bold) and perturbations Aldersons and Ben-Avraham (2014) |
Table 3.1 - Velocity model Dead Sea 2013 |
| Aldersons and Ben-Avraham (2014) |
 Table 3.2
Selected parameters for the MW 5.3 earthquake of 11 February 2004, 08 h 15 m, according to various sources Aldersons and Ben-Avraham (2014) |
Table 3.2 - parameters for the MW 5.3 earthquake of 11 February 2004 |
| Aldersons and Ben-Avraham (2014) |
 Table 3.3
Time span of each dataset, Relative Frequency of the seismicity in the upper crust and lower crust, and Seismogenic Thickness TS according to two criteria Aldersons and Ben-Avraham (2014) |
Table 3.3 - Time span and Seismogenic Thickness |
| Aldersons and Ben-Avraham (2014) |
 Table 3.4
Earthquake of 11 July 1927: main parameters according to various sources of instrumental results Aldersons and Ben-Avraham (2014) |
Table 3.4 - Earthquake of 11 July 1927: main parameters |
| Aldersons and Ben-Avraham (2014) |
 Table 3.5
Earthquake of 11 July 1927. Source parameters from spectral amplitudes of surface waves (Ben-Menahem et al. 1976) Aldersons and Ben-Avraham (2014) |
Table 3.5 - Earthquake of 11 July 1927. Source parameters from spectral amplitudes |
| Aldersons and Ben-Avraham (2014) |
 Table 3.6
Depth estimates according to Medvedev’s methods and Shebalin’s method. MSK Intensities from Avni (1999): MD (Mode), MN (Mean), MX (Max); MSK Intensities corrected by Zohar and Marco (2012): MD-C1 (Mode Corrected 1); MMI Intensities from Vered and Striem (1977): VRD. I0: highest Intensity isoseismal. m-MED and m-SHB: Isoseismal Index number according to Medvedev and Shebalin respectively. MS: Surface Wave Magnitude according to Eq. 3.7 from Ambraseys (2006). h: source depth (km) according to Medvedev’s methods 1 (MED- 1) and 2 (MED-2), and Shebalin (SHB). Valid depths in bold. Cells with inconsistent values have been greyed out Aldersons and Ben-Avraham (2014) |
Table 3.5 - Earthquake of 11 July 1927. Source parameters from spectral amplitudes |
| Description | Image | Source |
|---|---|---|
| Fig. 1 - Recorded Seismicity |
 Fig. 1
Recorded seismicity of the study area from 1900 to 2002 (Geophysical Institute of Israel, available online at http://www.gii.co.il). Black lines are the active faults. Abbreviations are:
The locations of the two ML≥6.0 earthquakes from the 20th century are indicated by the year numbers. Heidbach and Ben-Avraham (2007) |
Heidbach and Ben-Avraham (2007) |
| Fig. 2 - Assumed Historical Quakes |
 Fig. 2
Location and year date of the 14 historical earthquakes (MS≥6.0) along the Dead Sea Fault System (DSFS) of the last 1500 years (for details see Table 1). Dashed circles indicate the locations after shifting the epicentres onto the nearest major active fault. JW:1202 and 1759b should be swapped. 749 is too far south. Heidbach and Ben-Avraham (2007) |
Heidbach and Ben-Avraham (2007) |
| Fig. 3 - Assumed Historical Quake Breaks |
 Fig. 3
Location and year date of the 14 historical earthquakes (MS≥6.0) along the Dead Sea Fault System (DSFS) of the last 1500 years (for details see Table 1). Dashed circles indicate the locations after shifting the epicentres onto the nearest major active fault. JW:1202 and 1759b should be swapped. 749 is too far south. Heidbach and Ben-Avraham (2007) |
Heidbach and Ben-Avraham (2007) |
| Fig. 4 - Fault Segments (3D) |
 Fig. 4
3D model sketch of the study area. The numbers at the various fault segments give the applied tectonic loading rate (slip rate) in mm/yr below the locking depth w at 12.5 km. Heidbach and Ben-Avraham (2007) |
Heidbach and Ben-Avraham (2007) |
| Fig. 5a - ∆CFS since 551 CE South DSF |
 Fig. 5a
Evolution of ΔCFS for five fault zones along the Dead Sea Fault System (DSFS) from 551 (ΔCFS= 0) to 2005. In order to suppress unrealistic edge effects at the endings of each rupture plane, the five last points are smoothed. Plotted segments are shown on the overview maps as thick black lines. Lines with increasing gray scale represent the stress state of the given year. Stars indicate the position of the earthquake. Dashed lines are the 0 ΔCFS level and the thin grey lines in panels a and b are the 4 MPa ΔCFS level. Note the increased ΔCFS values in year 2005 for a 30-km-long section of the eastern Dead Sea Fault (a) and a 90-km-long section for the Jordan Fault (b) which could according to Eq. (1) produce MS = 6.8 and MS = 7.4 earthquake, respectively. Heidbach and Ben-Avraham (2007) |
Heidbach and Ben-Avraham (2007) |
| Fig. 5b - ∆CFS since 551 CE North DSF |
 Fig. 5b
Evolution of ΔCFS for five fault zones along the Dead Sea Fault System (DSFS) from 551 (ΔCFS= 0) to 2005. In order to suppress unrealistic edge effects at the endings of each rupture plane, the five last points are smoothed. Plotted segments are shown on the overview maps as thick black lines. Lines with increasing gray scale represent the stress state of the given year. Stars indicate the position of the earthquake. Dashed lines are the 0 ΔCFS level and the thin grey lines in panels a and b are the 4 MPa ΔCFS level. Note the increased ΔCFS values in year 2005 for a 30-km-long section of the eastern Dead Sea Fault (a) and a 90-km-long section for the Jordan Fault (b) which could according to Eq. (1) produce MS = 6.8 and MS = 7.4 earthquake, respectively. Heidbach and Ben-Avraham (2007) |
Heidbach and Ben-Avraham (2007) |
| Fig. 5c - ∆CFS since 551 CE Carmel Fault |
 Fig. 5c
Evolution of ΔCFS for five fault zones along the Dead Sea Fault System (DSFS) from 551 (ΔCFS= 0) to 2005. In order to suppress unrealistic edge effects at the endings of each rupture plane, the five last points are smoothed. Plotted segments are shown on the overview maps as thick black lines. Lines with increasing gray scale represent the stress state of the given year. Stars indicate the position of the earthquake. Dashed lines are the 0 ΔCFS level and the thin grey lines in panels a and b are the 4 MPa ΔCFS level. Note the increased ΔCFS values in year 2005 for a 30-km-long section of the eastern Dead Sea Fault (a) and a 90-km-long section for the Jordan Fault (b) which could according to Eq. (1) produce MS = 6.8 and MS = 7.4 earthquake, respectively. Heidbach and Ben-Avraham (2007) |
Heidbach and Ben-Avraham (2007) |
| Fig. 5d - ∆CFS since 551 CE Roum Fault |
 Fig. 5d
Evolution of ΔCFS for five fault zones along the Dead Sea Fault System (DSFS) from 551 (ΔCFS= 0) to 2005. In order to suppress unrealistic edge effects at the endings of each rupture plane, the five last points are smoothed. Plotted segments are shown on the overview maps as thick black lines. Lines with increasing gray scale represent the stress state of the given year. Stars indicate the position of the earthquake. Dashed lines are the 0 ΔCFS level and the thin grey lines in panels a and b are the 4 MPa ΔCFS level. Note the increased ΔCFS values in year 2005 for a 30-km-long section of the eastern Dead Sea Fault (a) and a 90-km-long section for the Jordan Fault (b) which could according to Eq. (1) produce MS = 6.8 and MS = 7.4 earthquake, respectively. Heidbach and Ben-Avraham (2007) |
Heidbach and Ben-Avraham (2007) |
| Fig. 5e - ∆CFS since 551 CE Yammouneh Fault |
 Fig. 5e
Evolution of ΔCFS for five fault zones along the Dead Sea Fault System (DSFS) from 551 (ΔCFS= 0) to 2005. In order to suppress unrealistic edge effects at the endings of each rupture plane, the five last points are smoothed. Plotted segments are shown on the overview maps as thick black lines. Lines with increasing gray scale represent the stress state of the given year. Stars indicate the position of the earthquake. Dashed lines are the 0 ΔCFS level and the thin grey lines in panels a and b are the 4 MPa ΔCFS level. Note the increased ΔCFS values in year 2005 for a 30-km-long section of the eastern Dead Sea Fault (a) and a 90-km-long section for the Jordan Fault (b) which could according to Eq. (1) produce MS = 6.8 and MS = 7.4 earthquake, respectively. Heidbach and Ben-Avraham (2007) |
Heidbach and Ben-Avraham (2007) |
| Fig. 6 - Est. Fault Stress in 2005 |
 Fig. 6
Present-day stress state of the Dead Sea Fault System. Displayed are the cumulative ΔCFS values calculated for the varying orientation of each fault in 1-km steps. The ΔCFS values include the coseismically induced stress changes superimposed by the stress effect from tectonic loading for the period from 551 to 2005. Note the large positive values along the Jordan Fault and the eastern segment of the Dead Sea Fault. Heidbach and Ben-Avraham (2007) |
Heidbach and Ben-Avraham (2007) |
| Table 1 - Model parameters for historical earthquakes |
 Table 1
Model parameters for the historical earthquakes Heidbach and Ben-Avraham (2007) |
Heidbach and Ben-Avraham (2007) |
| Table 2 - Results of ΔCFS analysis |
 Table 2
Results of ΔCFS analysis Heidbach and Ben-Avraham (2007) |
Heidbach and Ben-Avraham (2007) |
| Description | Image | Source |
|---|---|---|
| Fig. 1A - |
 Fig. 1A
A map of the Levant region shows the tectonic plates and the location of the Dead Sea Fault (DSF) and Carmel–Gilboa–Faria Fault System (CGFS). The black rectangle shows the location of panel B. Hamiel et al. (2022) |
Hamiel et al. (2022) |
| Fig. 1B - |
 Fig. 1B
Location map of a broad area surrounding the intersection of the DSF and the CGFS shows the locations of major faults in the CGFS, i.e., the Carmel Fault (CF), Gilboa Fault (GF), and Faria (FF) Fault, locations of earthquakes since 1985 (from the catalogue of the Seismology Division of the Geological Survey of Israel; https://earth-quake.co .il), and the DSF sinistral slip rates (in mm/yr) based on GPS measurements (Hamiel and Piatibratova, 2021). The black rectangle shows the location of panel C. Hamiel et al. (2022) |
Hamiel et al. (2022) |
| Fig. 1C - |
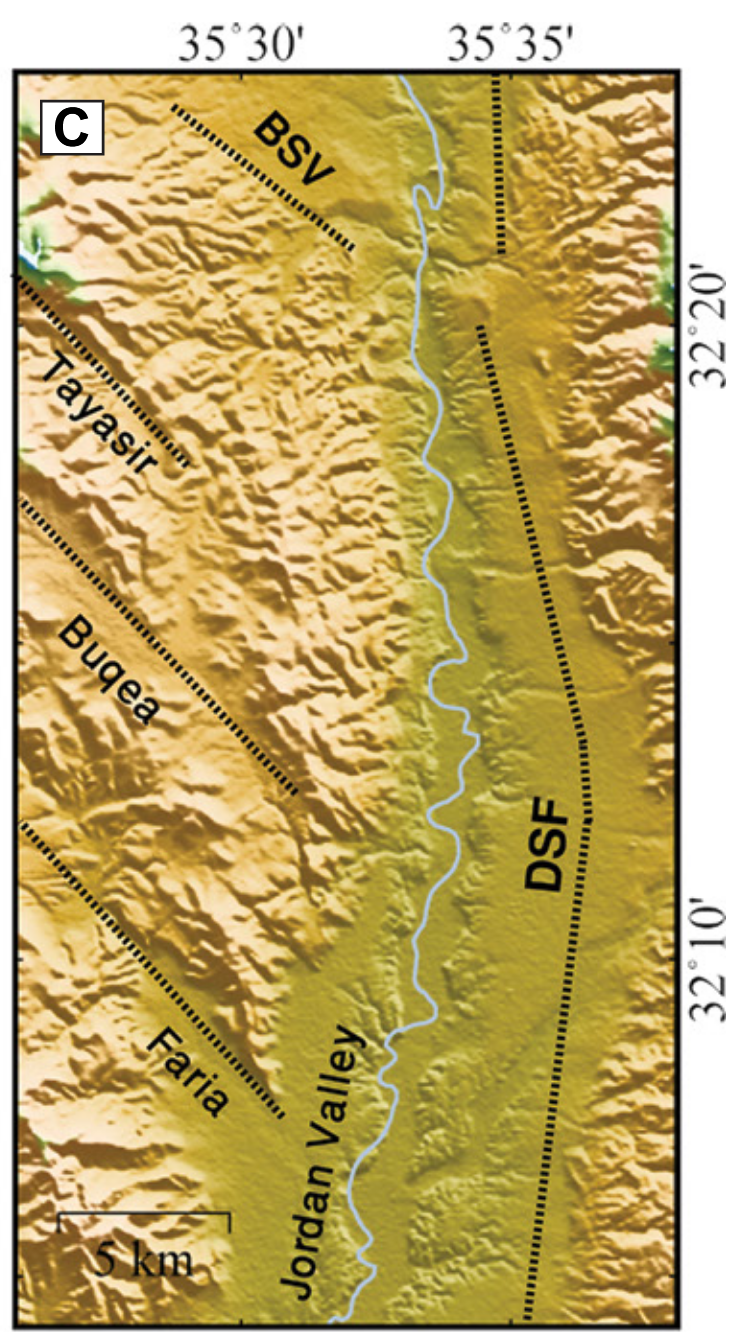 Fig. 1C
Location map of the study area shows the Faria Anticline and the Beit She’an (BSV) and Jordan Valleys. The dashed black lines denote the locations of the main faults and indicate the southern boundary of the Beit She’an Valley.
Hamiel et al. (2022) |
Hamiel et al. (2022) |
| Fig. 2A - |

Topographic map shows the northern Faria Anticline as well as the Beit She’an and Jordan Valleys. The dashed black lines denote the locations of major morphological features and faults, and the dashed blue line denotes the trace of the current Wadi Malih channel. The red rectangles show the location of panels C and D. The inset shows the northern area in panel A. Note the NW–SE lineament that crosses the Jordan Valley and denotes by the Wadi Malih and the Wadi Al-Qarn. Blue arrows indicate the locations and fow directions of Wadi Malih and Wadi Al-Qarn, located east of the Jordan River. The black and green dots denote the locations of the Shadmot Mehola Fault shown in Figures 9 and 10A, respectively. The red dot denotes the location of the Mehola Fault shown in Figure 10B.
Hamiel et al. (2022) |
Hamiel et al. (2022) |
| Fig. 2B - |

Topographic map of the southern Faria Anticline and the Jordan Valley. The dashed black lines denote the locations of major morphological features and faults, and the dashed blue line denotes the trace of the current Wadi Malih channel. The red rectangles show the location of panels C and D. The purple lines denote the locations of the seismic lines shown in Figure 12.
Hamiel et al. (2022) |
Hamiel et al. (2022) |
| Fig. 2C - |

High-resolution slope maps on top of shaded topography were based on our new airborne light detection and ranging data. Maps shows the southernmost part of (C) the Beit She’an Valley. The data presented were downgraded to a pixel resolution of 3 × 3 m2. Morphological features that indicate variations in slope along lineaments are marked by dashed black lines. These lineaments were found to be major faults. The black and green dots denote the locations of the Shadmot Mehola Fault shown in Figures 9 and 10A, respectively. The red dot denotes the location of the Mehola Fault shown in Figure 10B. The purple lines denote the locations of the seismic lines shown in Figure 12.
Hamiel et al. (2022) |
Hamiel et al. (2022) |
| Fig. 2D - |

High-resolution slope maps on top of shaded topography were based on our new airborne light detection and ranging data. Map shows the northern tip of the Faria Anticline. The data presented were downgraded to a pixel resolution of 3 × 3 m2. Morphological features that indicate variations in slope along lineaments are marked by dashed black lines. These lineaments were found to be major faults. The purple lines denote the locations of the seismic lines shown in Figure 12.
Hamiel et al. (2022) |
Hamiel et al. (2022) |
| Fig. 3 - |
 Fig. 3
The new geological map of the study area is shown. Note that while the early–middle Miocene Hordos Formation is exposed in the southern and central parts of the study area, along the NW-trending grabens and the eastern flank of the aria Anticline, the late Miocene Bira, late Miocene–early Pliocene Gesher, and early Pleistocene Wadi Malih Formations are exposed only in the northern part of the study area. The geological units east of the Jordan River (easternmost part of the map) were not mapped. Dashed blue lines denote the locations of profilesA and B presented in Figure 6. The purple dot denotes the location of sample SM1 (Fig. 4D), which is dated to the late Miocene Bira Formation age of the sample. Black dots denote the locations of faults presented in Figures 5A–5F and 10A–10B. Hamiel et al. (2022) |
Hamiel et al. (2022) |
| Fig. 4 A-F - |
 Fig. 4 A-F
Images of the mapped
Hamiel et al. (2022) |
Hamiel et al. (2022) |
| Fig. 4 G-H - |
 Fig. 4 G-H
Images of the mapped
Hamiel et al. (2022) |
Hamiel et al. (2022) |
| Fig. 5 - |

Photos show faults that rupture Neogene and Quaternary units. The locations of these images are presented in Figure 3.
Hamiel et al. (2022) |
Hamiel et al. (2022) |
| Fig. 6 - |

Schematic diagrams show
Hamiel et al. (2022) |
Hamiel et al. (2022) |
| Fig. 7 - |
 Fig. 7
Seismic line L11 was acquired across the Faria Graben in the southern part of the study area. The location of the line is presented in Figure 2. Red dashed lines denote faults at the subsurface. The yellow line indicates the surface, and the green line indicates the bottom of the late Pleistocene Lisan Formation, which varies from ~140 m to ~30 m below the surface. Note that faults do not rupture this rock unit. For more details, see the Supplemental Material (see text footnote 1). Hamiel et al. (2022) |
Hamiel et al. (2022) |
| Fig. 8 - |

Color-keyed evolution of the faulting map on top of the new geological map is shown (Fig. 3). Black lines denote faults that ruptured pre-late Miocene Bira Formation rocks. Light-green lines denote faults that ruptured the late Miocene Bira Formation rocks. Yellow lines denote faults that ruptured the late Miocene–early Pliocene Gesher Formation rocks. Orange lines denote faults that rup-tured the early Pleistocene Wadi Malih Formation rocks. Red lines denote faults that ruptured the late Pleistocene Lisan Formation rocks. Note the migration of faulting to the NE direction over time. The locations of the Shadmot Mehola Fault (SMF), Mehola Fault (MF), and Wadi Malih Fault (WMF) are also indicated. The northeasternmost faults are found near the eastern part of Wadi Malih and the southern Beit She’an Valley. All faults south of this map and within the study area were found to rupture only middle Miocene or older rock units (black lines). Hamiel et al. (2022) |
Hamiel et al. (2022) |
| Fig. 9 - |

(A) Photo and (B) schematic cross section (vertical exaggeration of 1:2) show the Shadmot Mehola Fault exposed along an artificialslope cut. The location of this outcrop is marked by black dots in Figure 2. As observed, the ~250-m-wide fault zone consists of six major internal blocks that are reverse and normally displaced on major fault planes. Major and minor faults are marked by thick and thin solid vertical lines, respectively; stratigraphic contacts are marked by thin solid lines; bedding is marked by dashed lines.
Hamiel et al. (2022) |
Hamiel et al. (2022) |
| Fig. 10 - |

Hamiel et al. (2022) |
Hamiel et al. (2022) |
| Fig. 11 - |
 Fig. 11
Shaded relief map is based on our new airborne light detection and ranging data for the northern study area and shows the interaction between the Wadi Malih stream and the Shadmot Mehola Fault (SMF), Mehola Fault (MF), and Wadi Malih Fault (WMF). The black arrow shows the location where the SMF intersects with Wadi Malih Valley. At this location, a left-lateral shift of ~150 m in the ridge location and Wadi Malih valley occurs (Fig. 9A). Blue arrows indicate changes in the fow direction of Wadi Malih where it crosses the MF (Fig. 9B). Hamiel et al. (2022) |
Hamiel et al. (2022) |
| Fig. 12A - |
 Fig. 12A
Seismic lines acquired across major faults in the northern part of the study area are shown. The locations of the lines are presented in Figure 2. For more details, see the Supplemental Material (see text footnote 1). Seismic line L12 within the southern Beit She’an Valley shows no evidence for faulting within the valley. Hamiel et al. (2022) |
Hamiel et al. (2022) |
| Fig. 12B-D - |
 Fig. 12B-D
Hamiel et al. (2022) |
Hamiel et al. (2022) |
| Fig. 12C-E - |
 Fig. 12C-E
Hamiel et al. (2022) |
Hamiel et al. (2022) |
| Fig. 13 A - |

The tectonic evolution at the intersection between the Dead Sea Fault (DSF) and Carmel-Gilboa-Faria Fault System (CGFS) is shown. Map of the study area shows the area that deformed during the three main tectonic stages: early-middle Miocene (yellow area), late Miocene-Pliocene (light orange area), and Quaternary (dark orange area). Green area denotes the defor-mation zone of the DSF, which has been tectonically active since the early Miocene. Hamiel et al. (2022) |
Hamiel et al. (2022) |
| Fig. 13 B - |

The tectonic evolution at the intersection between the Dead Sea Fault (DSF) and Carmel-Gilboa-Faria Fault System (CGFS) is shown. A S—N schematic cross-section across the CGFS, west of the intersection with the DSF, shows the migration and localization of faulting during the main three tectonic stages that have occurred since the early Miocene. Note that normal faulting was the dominant component of deformation before the Pleistocene, and since then, a combination of sinistral and normal faulting has been observed. BSV-Beit She'an Valley. Hamiel et al. (2022) |
Hamiel et al. (2022) |
| Description | Image | Source |
|---|---|---|
| Fig. 1a - |
 Fig. 1a
Seismic experiments in the Middle East. The 260 km long wide-angle reflection/refraction profile (WRR, dark blue dots) crosses Palestine, Israel and Jordan. The near-vertical seismic reflection profile (NVR, cyan) coincides with the inner 100 km of the WRR. A red line and two red arrows indicate the Dead Sea Transform (DST) between the Dead Sea and the Red Sea. The white arrows indicate the left-lateral motion of 105 km between the African and Arabian plates. Red stars mark large earthquakes. (Inset) Tectonic setting of the DST. Weber et al. (2004) |
Weber et al. (2004) |
| Fig. 1b - |
 Fig. 1b
Previous wide-angle reflection / refraction experiments in the study area (dashed black; Ginzburg et al. 1979a; Ginzburg et al. 1979b; Makris et al. 1983; El-Isa et al. 1987) together with the WRR profile of DESERT (blue) and the DST (red). The black circles are boreholes used in the interpretation
|
Weber et al. (2004) |
| Fig. 2 - |
 Fig. 2
|
Weber et al. (2004) |
| Fig. 11 - |

|
Weber et al. (2004) |
| Fig. 13 - |
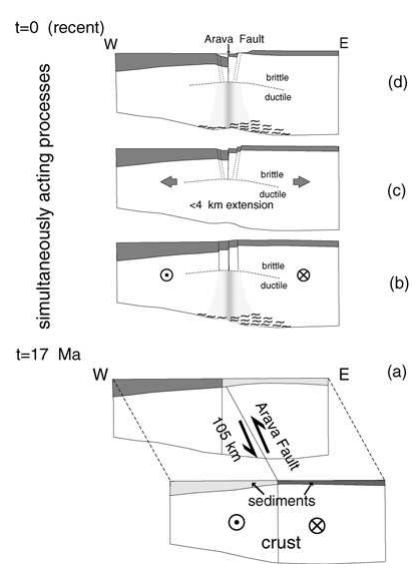
Sketch of the DST dynamics along the DESERT profile, based on results shown in Fig. 11 and the results of Sobolev (unpublished data).
|
Weber et al. (2004) |
| Description | Image | Source |
|---|---|---|
| Fig. 1a - |
Fig. 1a Seismic experiments in the Middle East. The 260 km long wide-angle reflection/refraction profile (WRR, dark blue dots) crosses Palestine, Israel and Jordan. The near-vertical seismic reflection profile (NVR, cyan) coincides with the inner 100 km of the WRR. A red line and two red arrows indicate the Dead Sea Transform (DST) between the Dead Sea and the Red Sea. The white arrows indicate the left-lateral motion of 105 km between the African and Arabian plates. Red stars mark large earthquakes. (Inset) Tectonic setting of the DST. Weber et al. (2004) |
Weber et al. (2004) |
| Fig. 1b - |
Fig. 1b Previous wide-angle reflection / refraction experiments in the study area (dashed black; Ginzburg et al. 1979a; Ginzburg et al. 1979b; Makris et al. 1983; El-Isa et al. 1987) together with the WRR profile of DESERT (blue) and the DST (red). The black circles are boreholes used in the interpretation
|
Weber et al. (2004) |
| Fig. 2 - |
Fig. 2
|
Weber et al. (2004) |
| Fig. 11 - |
|
Weber et al. (2004) |
| Fig. 13 - |
Sketch of the DST dynamics along the DESERT profile, based on results shown in Fig. 11 and the results of Sobolev (unpublished data).
|
Weber et al. (2004) |
 Fig. 2
 Fig. 4