Taninim Creek Dam
 Taninim Creek Dam on govmap.gov.il
click on image to explore this site on a new tab in govmap.gov.il
- Fig. 2a - Photo of the Dam
from Marco et al (2014)
 Fig. 2a
View of the dam looking northeastward
Marco et al (2014) - Fig. 2b - Closeup - Damaged
section of Dam from Marco et al (2014)
 Fig. 2b
A closeup view of the damaged section at the northern end of the dam. Building stones are shifted eastward (arrows) as if hit from the west
Marco et al (2014)
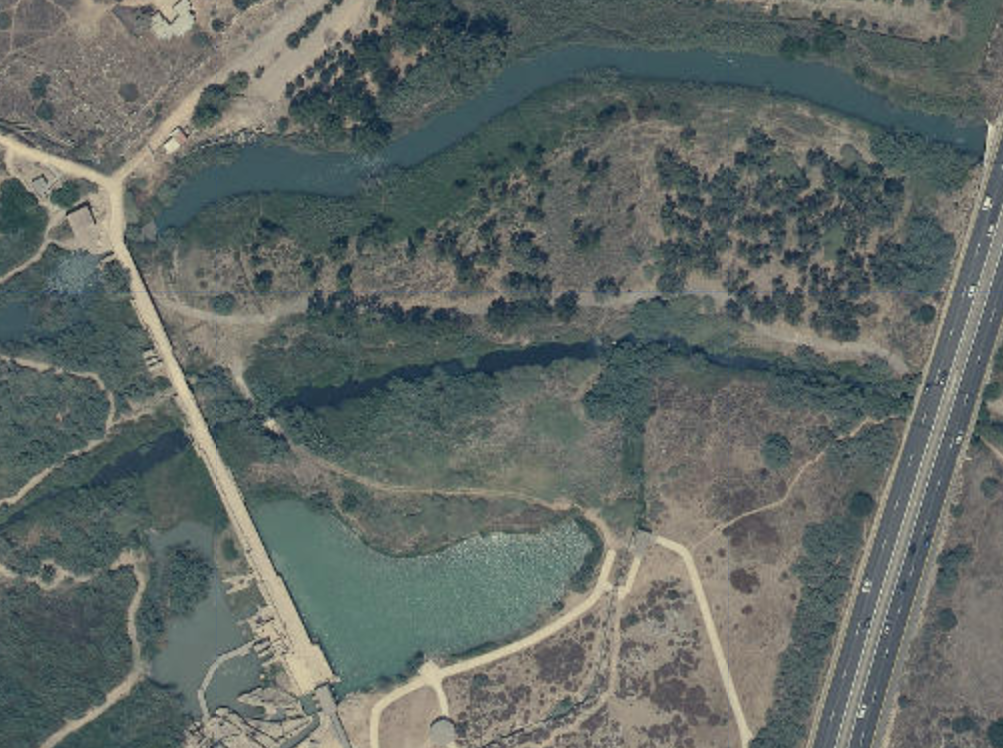
The dam on the Taninim Creek (Fig. 2a), which was built by the Byzantines in the fourth century CE as an artificial reservoir, was part of a flushing mechanism to clear silt from the Caesarea harbor, and for operating vertical flour mills as a by-product. The dam that is preserved along 193 m was originally more than 300 m long, 5.5 m wide at the base, and 4.5 m wide at the top. The top of the dam is 7 m above mean sea level.
A shallow fresh-brackish water lake was formed on the eastern side of the dam. Porat (2002) argues that the system was in use at least until the mid-sixth century, based on evidence from the ‘‘Christian Building’’, which received its water from the ‘‘Lower Aqueduct’’, a drinking-water carrier (bypassing the dam system) to Caesarea. After the Arab conquest in 640 CE, all the external water sources of Caesarea ceased to operate, included the studied dam reservoir. The inhabitants instead used water from wells that were dug in almost every house, as was told by the historian Al Mukadasi (cited by Porat 2002). However, a series of Ottoman flour mills powered by water from the dam reservoir indicate much later activity, possibly through the eighteenth century. We therefore argue that the lake persisted until the late Ottoman period.
A tilt of 7° from the vertical, leaning eastward (top moved eastward), most probably because of foundation settling, was fixed already in the dam’s early days. We recognize a late occurrence of damage at the dam’s northern end, where a 10-m section of the western face is destroyed; the upper part of the dam is missing, and the remaining stones are shifted eastward (Fig. 2b). A plausible explanation for the damage is that a large wave hit the dam, most intensely on its northern end. Later, the dam was repaired in the Ottoman period, when a massive support wall was built on the eastern face of the breached section, doubling the thickness of that part of the dam, and a series of 11 flour mills were built on the west side of the dam (Peleg 2002). We interpret the repair as supporting evidence for the operational condition of the dam when it was hit (Fig. 2a). The spillways of the Ottoman flour mills were opened in the dam lower than the watermark of the fourth century CE, possibly because the damaged dam could not hold the lake water at the original level.
- Fig. 1 - Location Map from
Marco et al (2014)
 Fig. 1
a general location map showing the Dead Sea Fault (solid black lines)
b A Google Earth image of the Taninim Creek area. Dashed lines delineate the eolianite sandstone (‘‘Kurkar’’) ridge, which is cut by the Taninim Creek between the settlements of Kibbutz Maagan Michael and Jisr el Zarka
Marco et al (2014) - Fig. 4 - Deduced transport directions
from Marco et al (2014)
 Fig. 4
The transport directions deduced from the flame structures asymmetry (white arrows) and schematic liquefaction intensity gradient (yellow overlay) showing decreasing intensity toward the east
Marco et al (2014) - The dam on the Taninim Creek
in Google Earth
 The dam on the Taninim Creek
click on image to explore this site on a new tab in Google Earth - The dam on the Taninim Creek
on govmap.gov.il
Taninim Creek Dam on govmap.gov.il
click on image to explore this site on a new tab in govmap.gov.il
- from Marco et al (2014)
 Fig. 3
Columnar section of the sediments in a trench east of the dam. The photograph mosaic on the left shows the location of samples. Arrow shows the horizon where flame structures are observed (Fig. 2). A single 14C age of detrital charcoal from TN8 is 245 ± 30 BP. The earthquakes that were associated with tsunamis according to historical accounts are listed. The temporal constraints imposed on the observed sedimentary section and the correlation with the archeological stratigraphy indicate that the liquefaction and the damage to the dam occurred after the deposition of the laminated lake sediments and accumulation of some 30 cm of clayey soil, and before the construction of the flour mills toward the end of the Ottoman period. The earthquake of November 25, 1759 is the most plausible cause for these features
Marco et al (2014)
- from Marco et al (2014)
 Table 1
Summary of injection structure characteristics in studied trenches (Fig. 3 c and d)
Marco et al (2014)
- Fig. 2a - Photo of the Dam
from Marco et al (2014)
Fig. 2a
View of the dam looking northeastward
Marco et al (2014) - Fig. 2b - Closeup - Damaged
section of Dam from Marco et al (2014)
Fig. 2b
A closeup view of the damaged section at the northern end of the dam. Building stones are shifted eastward (arrows) as if hit from the west
Marco et al (2014) - Fig. 2c - Load structures from
Marco et al (2014)
 Fig. 2c
Load structures were formed by liquefaction of the lower light-colored lacustrine silt that penetrated the overlaying dark clayey soil. We interpret the structure asymmetry and zigzag shapes as result of shear forces exerted on the lake bed sediments by waves sloshing back and forth
Marco et al (2014) - Fig. 2d - Load structures from
Marco et al (2014)
 Fig. 2d
Load structures were formed by liquefaction of the lower light-colored lacustrine silt that penetrated the overlaying dark clayey soil. We interpret the structure asymmetry and zigzag shapes as result of shear forces exerted on the lake bed sediments by waves sloshing back and forth
Marco et al (2014)
- from Marco et al (2014)
Fig. 3Columnar section of the sediments in a trench east of the dam. The photograph mosaic on the left shows the location of samples. Arrow shows the horizon where flame structures are observed (Fig. 2). A single 14C age of detrital charcoal from TN8 is 245 ± 30 BP. The earthquakes that were associated with tsunamis according to historical accounts are listed. The temporal constraints imposed on the observed sedimentary section and the correlation with the archeological stratigraphy indicate that the liquefaction and the damage to the dam occurred after the deposition of the laminated lake sediments and accumulation of some 30 cm of clayey soil, and before the construction of the flour mills toward the end of the Ottoman period. The earthquake of November 25, 1759 is the most plausible cause for these features
Marco et al (2014)
- from Marco et al (2014)
Fig. 4The transport directions deduced from the flame structures asymmetry (white arrows) and schematic liquefaction intensity gradient (yellow overlay) showing decreasing intensity toward the east
Marco et al (2014)
- Fig. 4 - Deduced transport directions
from Marco et al (2014)
Fig. 4
The transport directions deduced from the flame structures asymmetry (white arrows) and schematic liquefaction intensity gradient (yellow overlay) showing decreasing intensity toward the east
Marco et al (2014) - Fig. 3 - Columnar Section in
Trench E from Marco et al (2014)
Fig. 3
Columnar section of the sediments in a trench east of the dam. The photograph mosaic on the left shows the location of samples. Arrow shows the horizon where flame structures are observed (Fig. 2). A single 14C age of detrital charcoal from TN8 is 245 ± 30 BP. The earthquakes that were associated with tsunamis according to historical accounts are listed. The temporal constraints imposed on the observed sedimentary section and the correlation with the archeological stratigraphy indicate that the liquefaction and the damage to the dam occurred after the deposition of the laminated lake sediments and accumulation of some 30 cm of clayey soil, and before the construction of the flour mills toward the end of the Ottoman period. The earthquake of November 25, 1759 is the most plausible cause for these features
Marco et al (2014) - Fig. 2c - Load structures from
Marco et al (2014)
Fig. 2c
Load structures were formed by liquefaction of the lower light-colored lacustrine silt that penetrated the overlaying dark clayey soil. We interpret the structure asymmetry and zigzag shapes as result of shear forces exerted on the lake bed sediments by waves sloshing back and forth
Marco et al (2014) - Fig. 2d - Load structures from
Marco et al (2014)
Fig. 2d
Load structures were formed by liquefaction of the lower light-colored lacustrine silt that penetrated the overlaying dark clayey soil. We interpret the structure asymmetry and zigzag shapes as result of shear forces exerted on the lake bed sediments by waves sloshing back and forth
Marco et al (2014) - Table 1 - Summary of injection
structure characteristics from Marco et al (2014)
Table 1
Summary of injection structure characteristics in studied trenches (Fig. 3 c and d)
Marco et al (2014)
| Effect(s) | Location | Image(s) | Description |
|---|---|---|---|
| Load structures | Taninim Creek Dam
Fig. 4 The transport directions deduced from the flame structures asymmetry (white arrows) and schematic liquefaction intensity gradient (yellow overlay) showing decreasing intensity toward the east Marco et al (2014) |
Fig. 2c Load structures were formed by liquefaction of the lower light-colored lacustrine silt that penetrated the overlaying dark clayey soil. We interpret the structure asymmetry and zigzag shapes as result of shear forces exerted on the lake bed sediments by waves sloshing back and forth Marco et al (2014)
Fig. 2dLoad structures were formed by liquefaction of the lower light-colored lacustrine silt that penetrated the overlaying dark clayey soil. We interpret the structure asymmetry and zigzag shapes as result of shear forces exerted on the lake bed sediments by waves sloshing back and forth Marco et al (2014)
Table 1Summary of injection structure characteristics in studied trenches (Fig. 3 c and d) Marco et al (2014) |
|
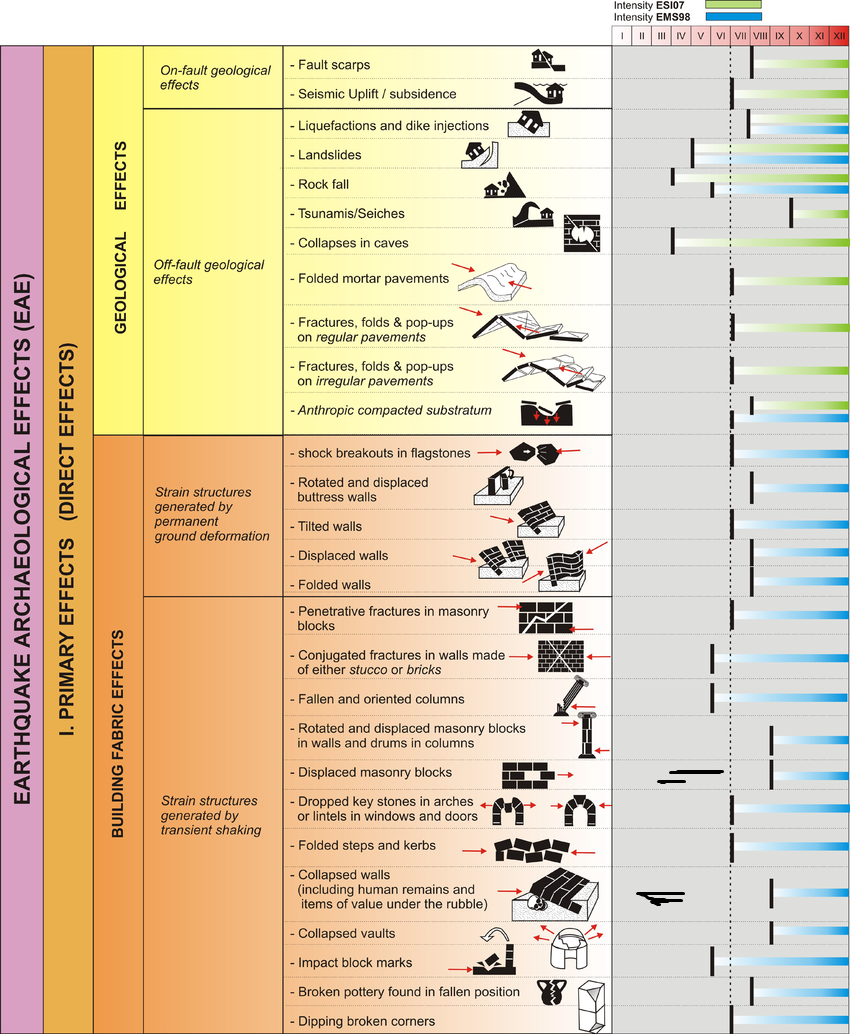
- Earthquake Archeological
Effects from Rodríguez-Pascua et al (2013: 221-224)
 Earthquake Archeological
Effects Chart
Earthquake Archeological
Effects Chart
Click on image to open in a new tab
Rodríguez-Pascua et al (2013) - Environmental Effects (ESI 2007)
 Graphic Representation of
ESI 2007 Intensity
Graphic Representation of
ESI 2007 Intensity
Click on image to open in a new tab
- Synoptic Table of ESI 2007
Intensity Degrees from Michetti et al. (2007)
 Synoptic Table of ESI 2007
Intensity Degrees
Synoptic Table of ESI 2007
Intensity Degrees
Accuracy improves in higher degrees, especially VIII–XII.
Click on image to open in a new tab
Michetti et al. (2007) - Environmental Effects vs. Intensity
from Michetti et al. (2007)
 Diagnostic ranges for
environmental effects by intensity
Diagnostic ranges for
environmental effects by intensity
Click on image to open in a new tab
Michetti et al. (2007)

| Effect(s) | Location | Image(s) | Description | Intensity |
|---|---|---|---|---|
| Load structures | Taninim Creek Dam
Fig. 4 The transport directions deduced from the flame structures asymmetry (white arrows) and schematic liquefaction intensity gradient (yellow overlay) showing decreasing intensity toward the east Marco et al (2014) |
Fig. 2c Load structures were formed by liquefaction of the lower light-colored lacustrine silt that penetrated the overlaying dark clayey soil. We interpret the structure asymmetry and zigzag shapes as result of shear forces exerted on the lake bed sediments by waves sloshing back and forth Marco et al (2014)
Fig. 2dLoad structures were formed by liquefaction of the lower light-colored lacustrine silt that penetrated the overlaying dark clayey soil. We interpret the structure asymmetry and zigzag shapes as result of shear forces exerted on the lake bed sediments by waves sloshing back and forth Marco et al (2014)
Table 1Summary of injection structure characteristics in studied trenches (Fig. 3 c and d) Marco et al (2014) |
|
Marco et al. (2014) write that M > 6.5 earthquake on the Dead Sea Fault, located ~60 km east of the site, would be capable of triggering liquefaction at Tanninim. This suggests a minimum local intensity of VII (calculated using SEISCALC). This value (VII) is consistent with the Earthquake Archeological Effects Chart of Rodríguez-Pascua et al (2013: 221-224) |