Event B at Nahal Ze'elim site ZA-1 is a 15 cm thick Type IV seismite with an estimated intensity of 9. ZA-1 was the first site in Nahal Ze'elim to be systematically investigated for Holocene paleoseismicity and established the basic framework for correlating earthquake-generated deformation structures with the historical earthquake record of the Dead Sea region. The site occupies a relatively landward position within the Ze'elim Terrace compared with the more seaward exposures examined in later studies such as Kagan et al. (2011). As a result, ZA-1 contains a greater proportion of shoreline and nearshore facies, whereas the later studies accessed more seaward sections characterized by thicker and more continuous lacustrine deposition. These more offshore settings preserved a larger number of earthquake-induced deformation horizons, resulting in a more complete Holocene paleoseismic record than was available at ZA-1.
Event B occurs within the northern gully at site ZA-1 and is hosted within the Ze'elim Formation, a sequence of laminated aragonite and detrital sediments deposited in the paleo-Dead Sea following the retreat of Lake Lisan. The deformed horizon occurs 146 cm above the base of the studied section and takes the form of a mixed layer composed of dark fine-grained sediment containing scattered tabular fragments of broken aragonite laminae. Event B is especially important because the mixed layer can be traced across all of the studied outcrops and across changing depositional facies. Where the lacustrine lithology passes into shoreline and nearshore sediments, the same deformation horizon changes character, producing features such as load casts, flame structures, and liquefied sandy beds. This lateral continuity across different depositional environments was one of the main observations used by Ken-Tor et al. (2001a) to argue that the deformation was caused by simultaneous earthquake shaking rather than by local slumping, flooding, or other non-seismic processes.
The age of Event B was constrained using multiple radiocarbon determinations from the interval between Events A and B and from the mixed layer itself. Four samples between the two events yielded ages of 1910 ± 40, 1990 ± 40, 1930 ± 50, and 1940 ± 40 radiocarbon years BP. Sample KIA32223 collected from within the Event B mixed layer yielded an age of 1950 ± 60 radiocarbon years BP, with a calibrated range of 100 BCE-230 CE. Taken together, Ken-Tor et al. (2001a) reduced the age of Event B to 50 BCE-230 CE ( 2σ) on stratigraphic grounds and correlated it with the historically documented 31 BCE Josephus earthquake. For Ken-Tor et al. (2001a), Event B served not only as a dated earthquake horizon, but also as a chronological anchor point for assessing the ages of other mixed layers in the ZA-1 profile. The later regional correlation study of Kagan et al. (2011) further demonstrated the importance of Event B both within Nahal Ze'elim and as a basin-wide seismite horizon.
- Fig. 1c Oblique aerial photo of
SW Dead Sea showing Masada and Zeelim Plain from Agnon et al. (2006)
An oblique air photo looking southward at the southwestern part of the Dead Sea showing faults (solid lines) and locations of studied late Pleistocene sections M and PZ. MFZ—Masada Fault Zone. The photo was taken in 1940 when the lake level was 395 m below sea level. The current level is 420 m below sea level; additional area has emerged, including the Ze' elim fan outcrop.
click on image to open in a new tab in Google Earth
Agnon et al. (2006)- Nahal Ze'elim outcrop areas
in Google Earth
ZA-I is a guesstimate
click on image to explore this site on a new tab in Google Earth- Fig. 2 Event B from Nahal Zeelim
from Agnon et al. (2006)
An intraclast breccia layer identified with the 31 B.C. earthquake (Ken-Tor et al., 2001a, 2001b).
click on image to open in a new tab in Google Earth
Agnon et al. (2006)- Figure 2 Annotated Lithosection
of ZA-1 with interpreted ages noted from Ken-Tor et al. (2001a)
The lithology and chronology of a composite section exposed in Ze'elim Plain. The section is described from two outcrops exposed in different gullies 300 m apart. The correlation between the outcrops is based on the sedimentary sequence, laminae counting, and 14C dates. Ages presented in 14C years B.P. Deformed units (mixed layers and liquefied sands) are marked by capital letters.
slightly modified by JW - red dates as interpreted by JW added
click on image to open in a new tab
Ken-Tor et al. (2001a)- Figure 8 Age Model for ZA-1
from Agnon et al. (2006)
A modified age model for the Ze'elim section studied in outcrop (Ken-Tor et al., 2001a) and drill core (Migowski et al., 2004). A–H denote events discussed in the text. The present model was constrained by two rules:
(1) each event horizon (top of each intraclast breccia) matches a historical earthquake of notice.
(2) each continuous deposition segment shows a uniform deposition rate.
Two outcomes support the model. Two of the breccia layers match pairs of earthquakes (64–31 BCE; 1202–1210 CE) such that the earlier event horizon is within the breccia layer and the later event matches the top. With these assignments for the event horizons, the model gives a uniform sedimentation rate of 0.5 cm/yr during the three periods separated by hiatuses.
click on image to open in a new tab
Agnon et al. (2006)- Figure 3 Age Model for ZA-1
from Ken-Tor et al. (2001a)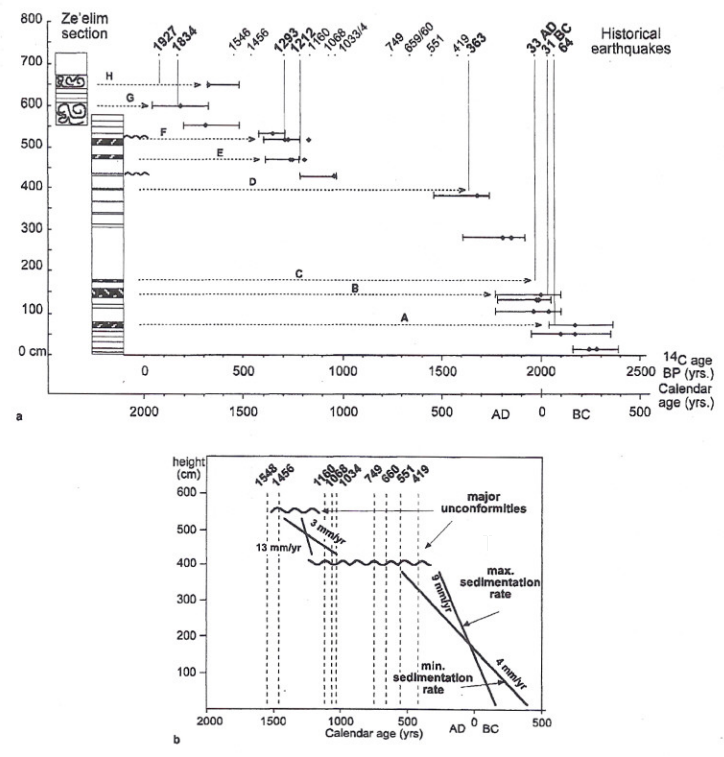
Table 1
- Chronology of the deformed units (seismites) in the Ze'elim section. Solid dots represent 14C ages in years B.P. Error bars represent the ranges in the calibrated ages (2σ) of all samples in each stratigraphic horizon. Vertical thin lines represent historical earthquakes in the Dead Sea area, which were correlated to the deformed units in the Ze'elim section. Horizontal dashed arrows are drawn from the deformed units (listed in capital letters) to the correlative earthquakes.
- Sedimentation rates calculated for the lower part of the composite section. The longest calibrated range was used for calculating the minimum sedimentation rate, and the shortest range for calculating the maximum sedimentation rate. Two clear unconformities are evident. The upper one is dated to 1290-1420 A.D., and the lower one to 1030-1210 A.D. The lower unconformity is marked by a sharp decrease in the sedimentation rate. Vertical dashed lines represent earthquakes that lie within the sedimentological hiatuses. Sedimentation rate of the upper part of the section was not calculated because datable samples were insufficient.
click on image to open in a new tab
Ken-Tor et al. (2001a)- Figure 4b. Calibration Curve Event B
from Ken-Tor et al.(2001b)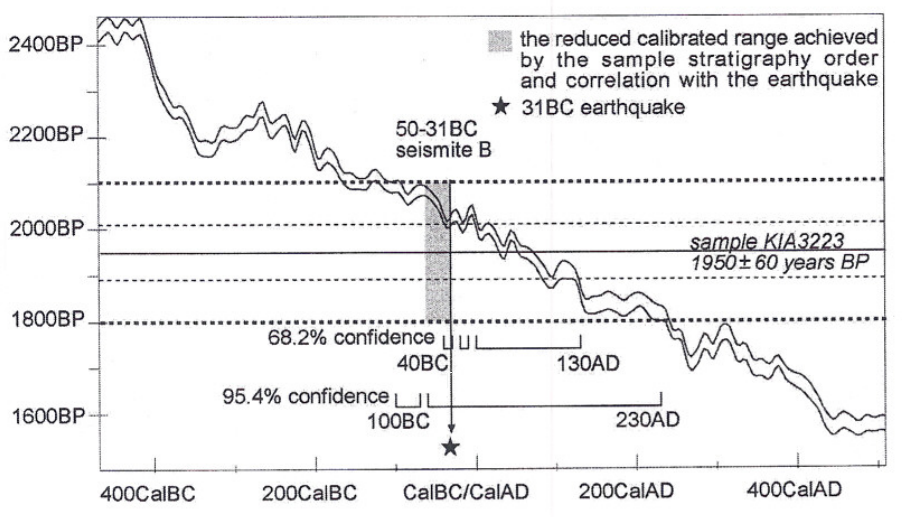
The calibration curve from Stuiver et al. (1998) and the intersection of the 14C age of the samples collected from the seismites of the Ze'elim sequence. Thick dashed lines represent the 2σ error (68.2% confidence) and fine dashed lines the 1σ error (95.4% confidence). The uncertainty in the ages of samples collected from the seismites is reduced by overlapping calibrated ranges of stratigraphically lower samples and by correlating with historical earthquakes (in gray).
Click on image to open a magnifiable image in a new tab
Ken-Tor et al. (2001b)- Table 1 Radiocarbon Table
from Ken-Tor et al. (2001b)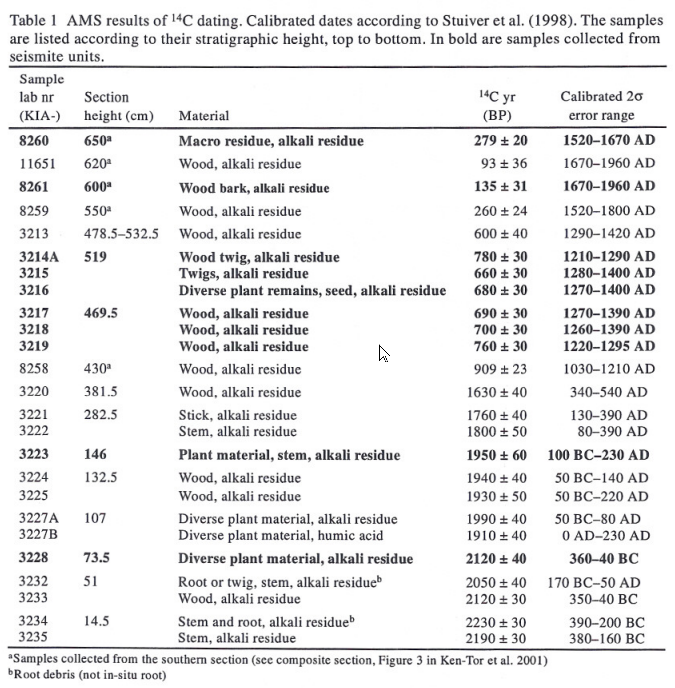
AMS results of 14C dating. Calibrated dates according to Stuiver et al. (1998). The samples are listed by stratigraphic height, from top to bottom. Samples collected from seismite units are shown in bold.
Click on image to open a magnifiable image in a new tab
Ken-Tor et al. (2001b)- Table 1 Radiocarbon Table
from Ken-Tor et al. (2001a)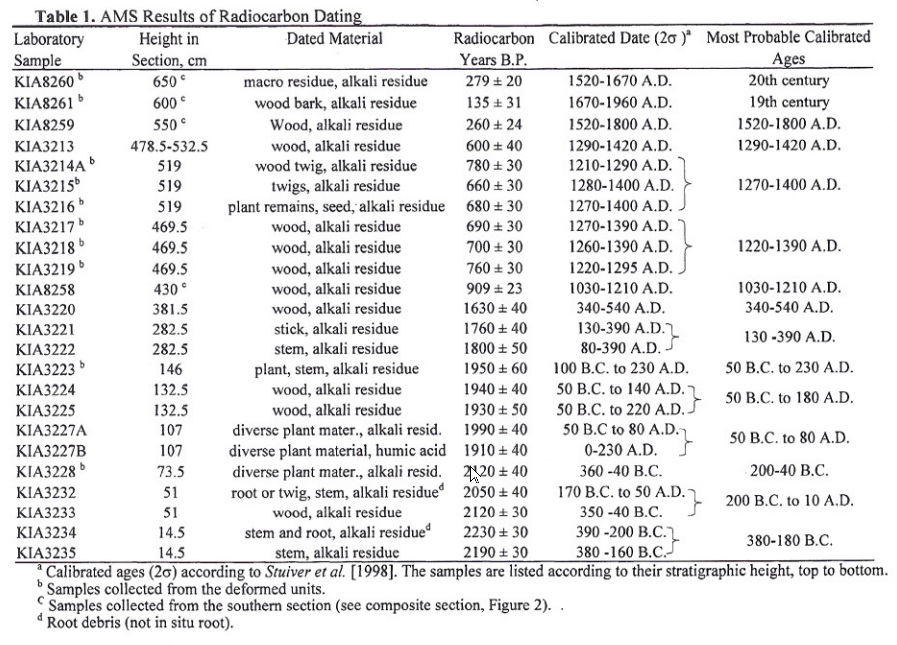
AMS Results of Radiocarbon Dating
click on image to open in a new tab
Ken-Tor et al. (2001a)- Table 2 Refined Radiocarbon Table
from Ken-Tor et al. (2001a)
The 14C Chronology of the Deformed Layers (Seismites)
click on image to open in a new tab
Ken-Tor et al. (2001a)- Figure 4e Calibrated Radiocarbon Ages
from Ken-Tor et al. (2001b)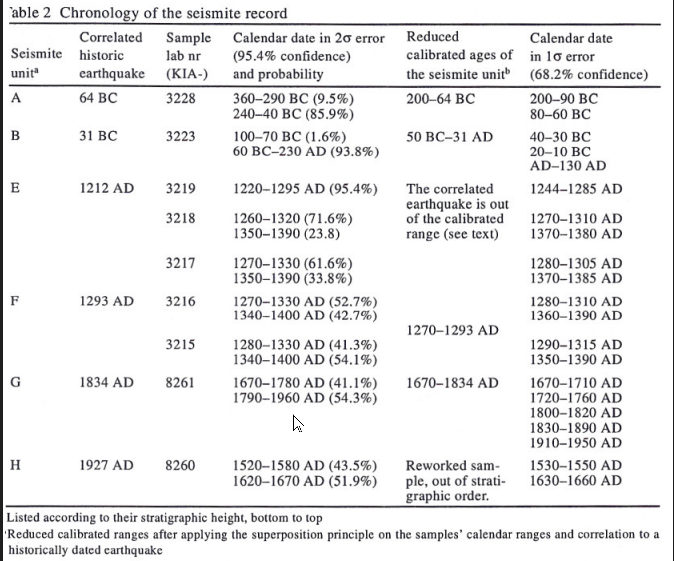
Chronology of the seismite record
click on image to open in a new tab
Ken-Tor et al. (2001b)- Fig. 2 Sediment Core comparisons
and Age-Depth Models for Ein Gedi, En Feshka, and Nahal Zeelim from Migowski et al. (2004)
Lithology of the sediment cores and the established age-depth models of the different profiles. The Ze'elim coring profile is paralleled by the Ze'elim gully wall. The Ein Gedi chronology is based on 20 radiocarbon dates and on the varve-counted section (black line) in the upper part.
click on image to open in a new tab
Migowski et al. (2004)- Correlated Trench Logs used
to Produce Composite ZA-1 Litholog from Revital Bookman (née Ken-Tor)
The final lithosection of Bookman (née Ken-Tor) is a composite litholog derived from multiple sites located up to approximately 300 m apart. ZA-1 refers to the location from which a large portion of the composite lithosection was constructed. More landward gullies were used to capture the most recent earthquakes, including Events G (1834 CE) and H (1927 CE). Bookman referred to site ZA-1 as Site 2.
click on image to open in a new tab
Revital Bookman (née Ken-Tor)
Left
Events B (Josephus Quake - 31 BCE) and C (Jerusalem Quake - 26-36 CE) at site ZA-1
Photo by Jefferson Williams (2000)
Right
Mixed layer B (see also Figure 2) composed of aragonite fragments suspended in fine dark detritus. The fragments are few millimeters to few centimeters long and do not show any preferred orientation. The overlying and underlying (not seen in the figure) laminated deposits are undisturbed. This layer is correlated with the 31 B.C. earthquake (see text)
Ken-Tor et al. (2001a)
click on either image to open in a new tab
