Nahal Ze'elim
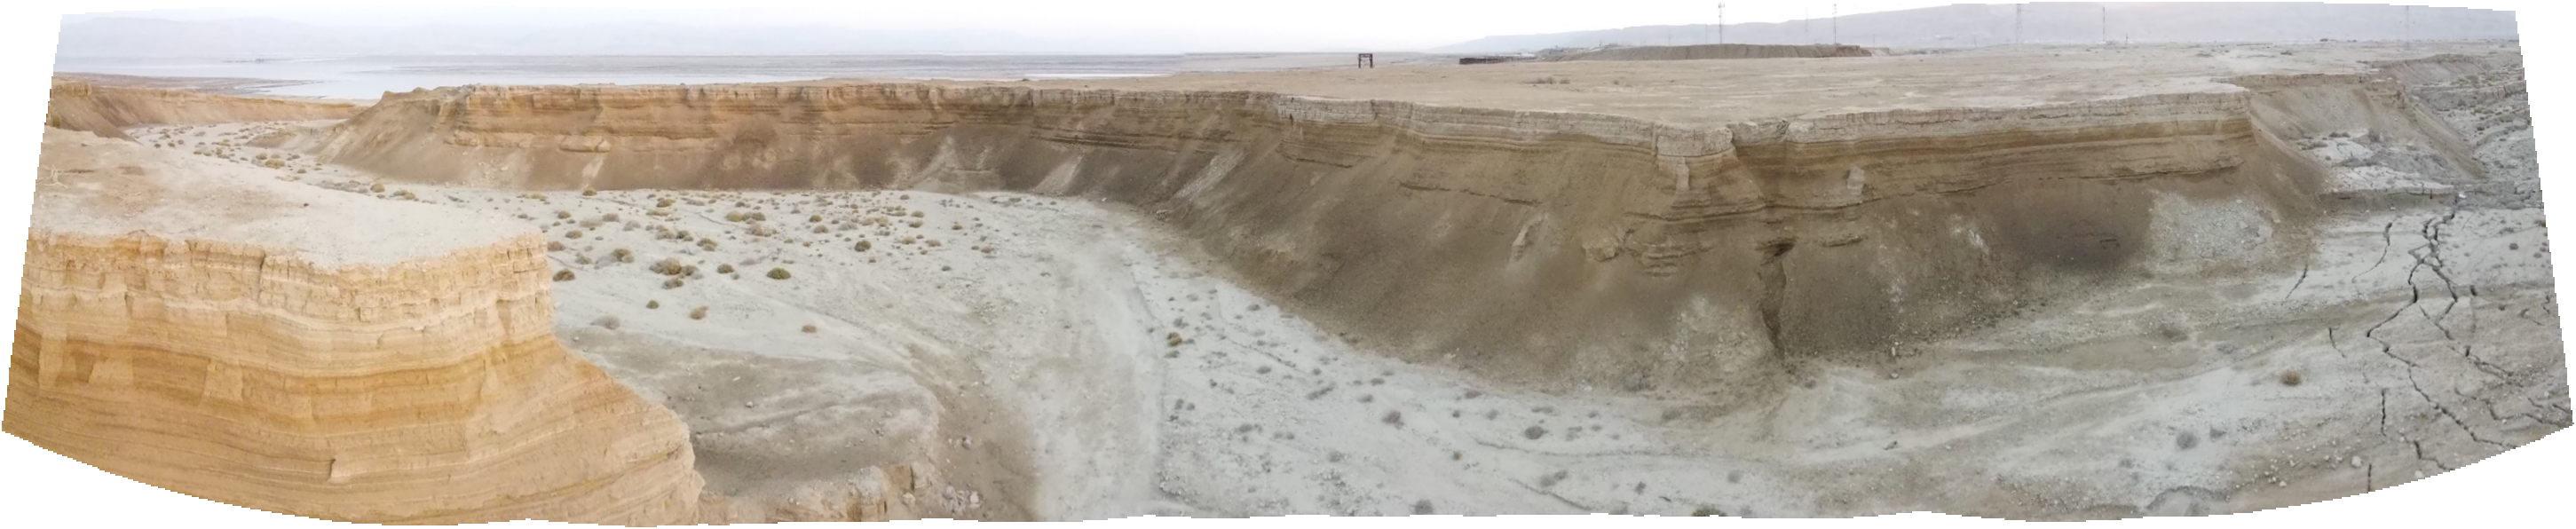
 Aerial shot of Nahal Ze'elim from the east
Click on Image for high resolution magnifiable image
Panorama from Drone Photos by Jefferson Williams 11 Feb. 2023
- Map of Gullies where
Revital Bookman did her work in ZA-1
 Map of Gullies where Revital Bookman (nee Ken-Tor) did her work
Revital Bookman (nee Ken-Tor) - Nahal Ze'elim outcrop areas
in Google Earth
 Nahal Ze'elim outcrop areas
ZA-I is a guesstimate
click on image to explore this site on a new tab in Google Earth - Nahal Ze'elim outcrop area
on govmap.gov.il
 Nahal Ze'elim outcrop area
click on image to explore this site on a new tab in govmap.gov.il - Aerial View of Nahal Ze'elim
outcrop area by Jefferson Williams
 Nahal Ze'elim outcrop area
click on image to open a higher resolution magnifiable image in a new tab
Panorama from Drone Photos taken by Jefferson Williams on 11 Feb. 2023 - DSW Site Map
 Dead Sea Works Site Map

- Map of Gullies where
Revital Bookman did her work in ZA-1
Map of Gullies where Revital Bookman (nee Ken-Tor) did her work
Revital Bookman (nee Ken-Tor) - Aerial View of Nahal Ze'elim
outcrop area by Jefferson Williams
Nahal Ze'elim outcrop area
click on image to open a higher resolution magnifiable image in a new tab
Panorama from Drone Photos taken by Jefferson Williams on 11 Feb. 2023 - DSW Site Map
Dead Sea Works Site Map
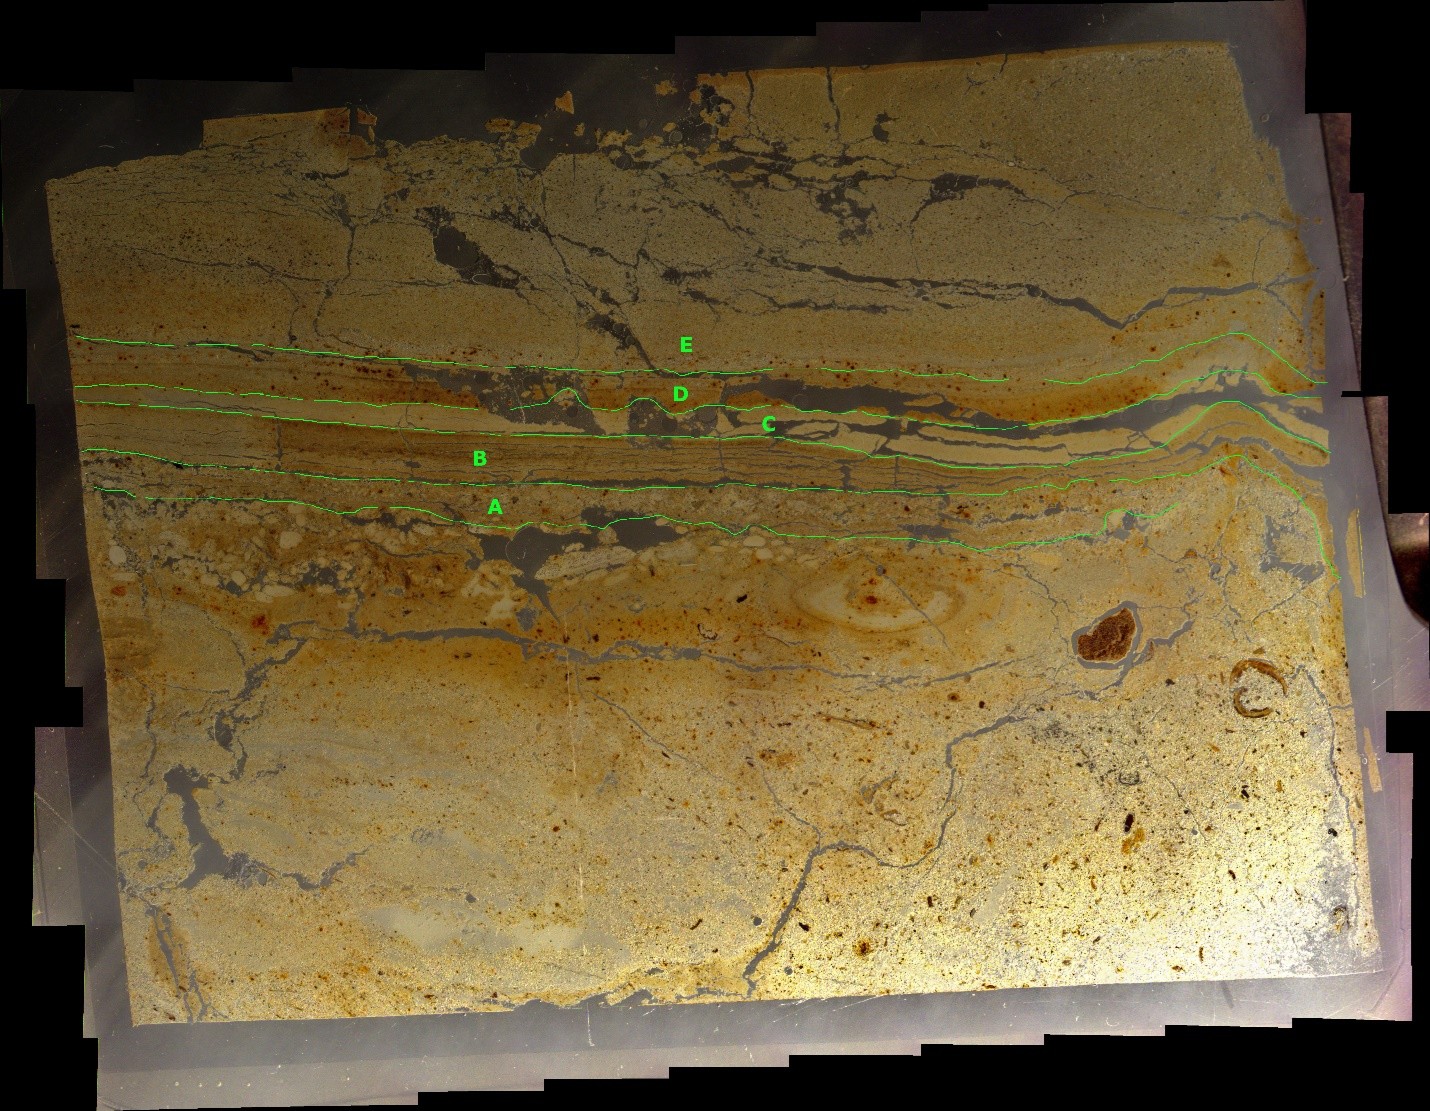
 Figure 2
The lithology and chronology of a composite section exposed in Ze'elim Plain. The section is described from two outcrops exposed in different gullies 300 m apart. The correlation between the outcrops is based on the sedimentary sequence, laminae counting, and 14C dates. Ages presented in 14C years B.P. Deformed units (mixed layers and liquefied sands) are marked by capital letters.
slight modification by Williams
Ken-Tor et al. (2001a)
 Figure 2
The lithology and chronology of a composite section exposed in Ze'elim Plain. The section is described from two outcrops exposed in different gullies 300 m apart. The correlation between the outcrops is based on the sedimentary sequence, laminae counting, and 14C dates. Ages presented in 14C years B.P. Deformed units (mixed layers and liquefied sands) are marked by capital letters.
Ken-Tor et al. (2001a)
 Figure 1d
Sedimentary scheme of the Ze'elim outcrop profile and radiocarbon chronology (modified from Bookman (Ken-Tor) et al., 2004). ZA11B2 sediment block represent the late 19th e early 20th centuries high-stand. ZA11B3R, ZA11B4L and ZA11B5L sediment blocks represent the Hellenistic-early Roman high-stand. Aragonite crusts were deposited in a coastal to terrestrial environment, while the aragonite laminae (discussed in this study) were deposited in a lacustrine environment. (For interpretation of the references to colour in this figure legend, the reader is referred to the web version of this article.)
click on image to open in a new tab
López-Merino et al. (2016)
- from Leroy et al. (2010)
 Figure 2
The lithology and chronology of the section exposed at the Ze'elim site. Ages presented in 14C yr BP. Marked are the seismites dated to the 31 BC and AD 363 earthquakes. Calibrated dates of the seismites in Ken-Tor et al. (2001a, b).
click on image to open in a new tab
Leroy et al. (2010)
 Correlated Trench Logs used to produce composite ZA-1 litholog
The final lithosection of Bookman (nee Ken-Tor) is a composite lithologs derived from multiple sites as far as, I think, 300 meters apart. ZA-1 refers to the location where a large part of the composite lithosection was derived. More landward gullies were used to capture the most recent earthquakes - Events G (1834) and H (1927). Bookman referred to site ZA-1 as site 2.
Revital Bookman (nee Ken-Tor)
 Figure 8
A modified age model for Ze'elim section studied in outcrop (Ken-Tor et al., 2001a) and drill core (Migowski et al., 2004). A-H denote events discussed in the text. The present model was constrained by two rules
(1) each event horizon (top of each intraclast breccia) matches a historical earthquake of notice
(2) each continuous deposition segment shows a uniform deposition rate.
Two outcomes support the model: Two of the breccia layers match pairs of earthquakes (64-31 B.C.; 1202-1210 A.D.) such that the earlier event horizon is within the breccia layer and the later event matches the top. With these assignments for the event horizons, the model gives a uniform rate of sedimentation of 0.5 cm/yr during the three periods separated by hiatuses.
Agnon et al (2006)
Age Model for ZA-1.
(a) Chronology of the deformed units (seismites) in the Ze'elim section. Solid dots represent 14C ages in years B.P. Error bars represent the ranges in the calibrated ages (2σ) of all samples in each stratigraphic horizon. Vertical thin lines represent historical earthquakes in the Dead Sea area, which were correlated to the deformed units in the Ze'elim section. Horizontal dashed arrows are drawn from the deformed units (listed in capital letters) to the correlative earthquakes.
(b) Sedimentation rates calculated for the lower part of the composite section. The longest calibrated range was used for calculating the minimum sedimentation rate, and the shortest range for calculating the maximum sedimentation rate. Two clear unconformities are evident: the upper one is dated to 1290-1420 A.D. and the lower one to 1030-1210 A.D. The lower unconformity is marked by a sharp decrease in the sedimentation rate. Vertical dashed lines represent earthquakes that lie within the sedimentological hiatuses. Sedimentation rate of the upper part of the section was not calculated because datable samples were insufficient.
click on image to open in a new tab
Ken-Tor et al. (2001a)

 Figure 3
Calibrated date distribution for samples from the Ze'elim sequence (Tables I and 2). The samples are arranged in stratigraphic order from bottom to top. Samples collected from the seismite record are marked in capital letters (A-H). Correlated earthquakes are marked with arrows. The calibrated ranges of the samples collected from seismites E and F are very similar but show differences in their distribution. The distribution of the older samples from seismite E is larger in the older part of the range (in gray and labeled II), while that of the younger samples from seismite F is shifted towards the younger range (labeled I). The difference in the distribution of the samples is in accordance with the stratigraphic order of the samples and supports the correlation of the 1212 and 1293 AD earthquakes.
click on images to open in a new tab
Ken-Tor et al. (2001b)
 Figure 4a
The calibration curve from Stuiver et al. (1998) and the intersection of the 14C age of the samples collected from the seismites of the Ze'elim sequence. Thick dashed lines represent the 2σ error (68.2% confidence) and fine dashed lines the 1σ error (95.4% confidence). The uncertainty in the ages of samples collected from the seismites is reduced by overlapping calibrated ranges of stratigraphically lower samples and by correlating with historical earthquakes (in gray).
click on images to open in a new tab
Ken-Tor et al. (2001b)
 Figure 4b
The calibration curve from Stuiver et al. (1998) and the intersection of the 14C age of the samples collected from the seismites of the Ze'elim sequence. Thick dashed lines represent the 2σ error (68.2% confidence) and fine dashed lines the 1σ error (95.4% confidence). The uncertainty in the ages of samples collected from the seismites is reduced by overlapping calibrated ranges of stratigraphically lower samples and by correlating with historical earthquakes (in gray).
click on images to open in a new tab
Ken-Tor et al. (2001b)
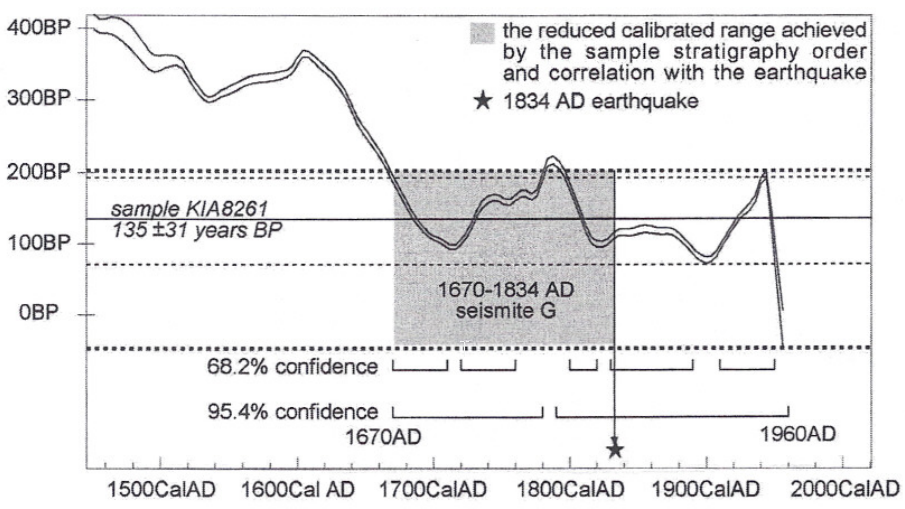 Figure 4e
The calibration curve from Stuiver et al. (1998) and the intersection of the 14C age of the samples collected from the seismites of the Ze'elim sequence. Thick dashed lines represent the 2σ error (68.2% confidence) and fine dashed lines the 1σ error (95.4% confidence). The uncertainty in the ages of samples collected from the seismites is reduced by overlapping calibrated ranges of stratigraphically lower samples and by correlating with historical earthquakes (in gray).
click on images to open in a new tab
Ken-Tor et al. (2001b)
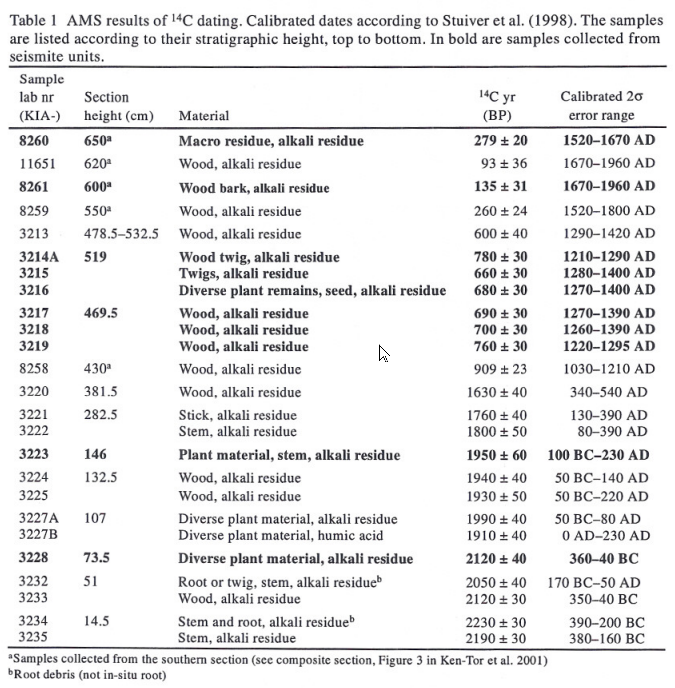 Table 1
AMS results of 14C dating. Calibrated dates according to Stuiver et al. (1998). The samples are listed units according to their stratigraphic height, top to bottom. In bold are samples collected from seismite units
click on image to open in a new tab
Ken-Tor et al. (2001b)
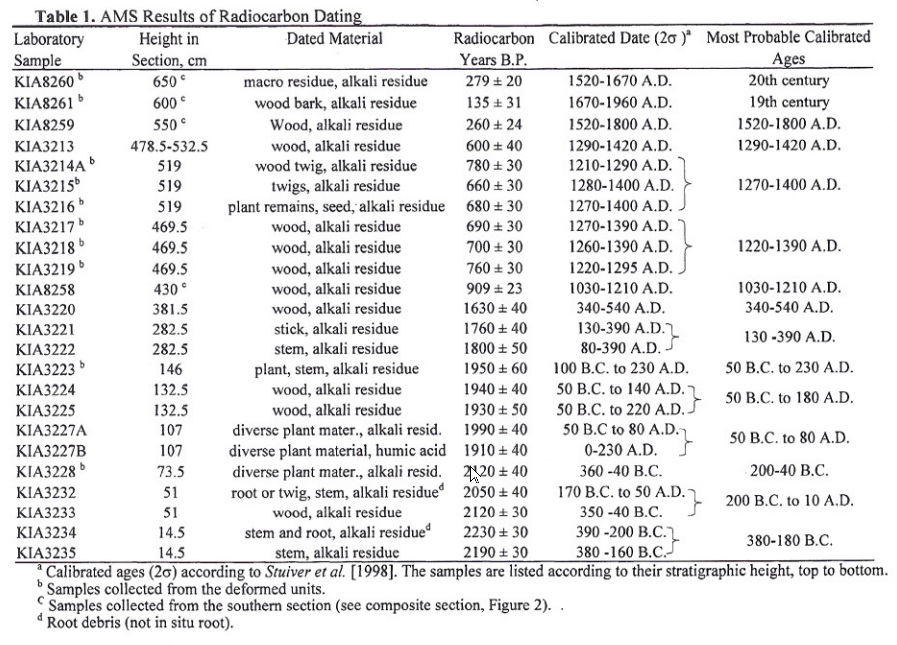 Table 1
AMS Results of Radiocarbon Dating
click on image to open in a new tab
Ken-Tor et al. (2001a)
 Table 2
The 14C Chronology of the Deformed Layers (Seismites)
click on image to open in a new tab
Ken-Tor et al. (2001a)
- from Kagan et al. (2011)
- these have been incorporated into the Master Seismic Events Tables for all sites

Ze'elim and Ein Feshka Seismites with Model Ages and Historic Event Correlation
- LS, local source, moderate earthquake, not appearing in the historical catalogs, may have produced these seismites
- Gully depth below fan delta surface
- Seismite type
A, Intraclast breccia layer
B, Microbreccia (“homogenite” to the naked eye)
C, liquefied sand
D, Folded laminae
E, Small offsets
Q, Questionable as seismite. See Table 1 and Figure 2. - Model ages of seismites extrapolated from deposition model (see section 5 for details)
- Fit of historical earthquake dates within 1σ or 2σ calibrated age ranges of seismites. Although model ages are tabulated here with 1 year precision for convenience, event fit considers the realistic precision of 10 years (see section 5.1)
- All other possible events within the age probability range (1σ or 2σ range) of the designated earthquake; 1068a refers to March 1068 A.D., and 1068b refers to May 1068 A.D. (see Table A1)
- Outside model range, extrapolated from model (Figure 4)
- Outside model range, estimated based on below and above radiocarbon ages (Figure 4)
- Alternately, this historic earthquake could have formed seismites below or above the one marked
Kagan et al (2011)
- from Kagan et al. (2011)
- these have been incorporated into the Master Seismic Events Tables for all sites
 Table 4
Multisite Comparison of Holocene Seismites from four lacustrine sediments sites along the Western Dead Sea Basin
Kagan et al (2011)
- from Kagan et al. (2011)
 Figure 7
Recurrence intervals and cumulative number of breccias in time.
- Ein Feshkha (EFE)
- Ein Gedi (EG)
- Zeelim (ZA1 and ZA2)
- Diamonds represent breccias
- circled diamonds are the IBS (intrabasin seismites)
- Horizontal gray bars indicate periods of seismic quiescence
(left) the earlier period is recorded at EG and ZA, and (right) the younger quiescence period is recorded at all three sites. Horizontal lines connect IBS events at the three sites.
Kagan et al (2011)
Table 2The 14C Chronology of the Deformed Layers (Seismites)
Ken-Tor et al (2001a)
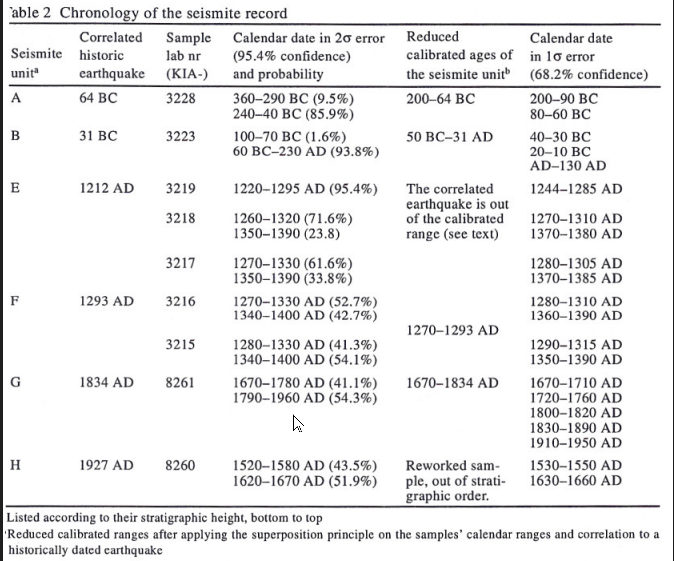 Table 2
Chronology of the seismite record
click on images to open in a new tab
Ken-Tor et al. (2001b)
- Event B has been assigned to the 31 BCE Josephus Quake
- Event C has been assigned to the Jerusalem Quake which is currently dated to 26-36 CE
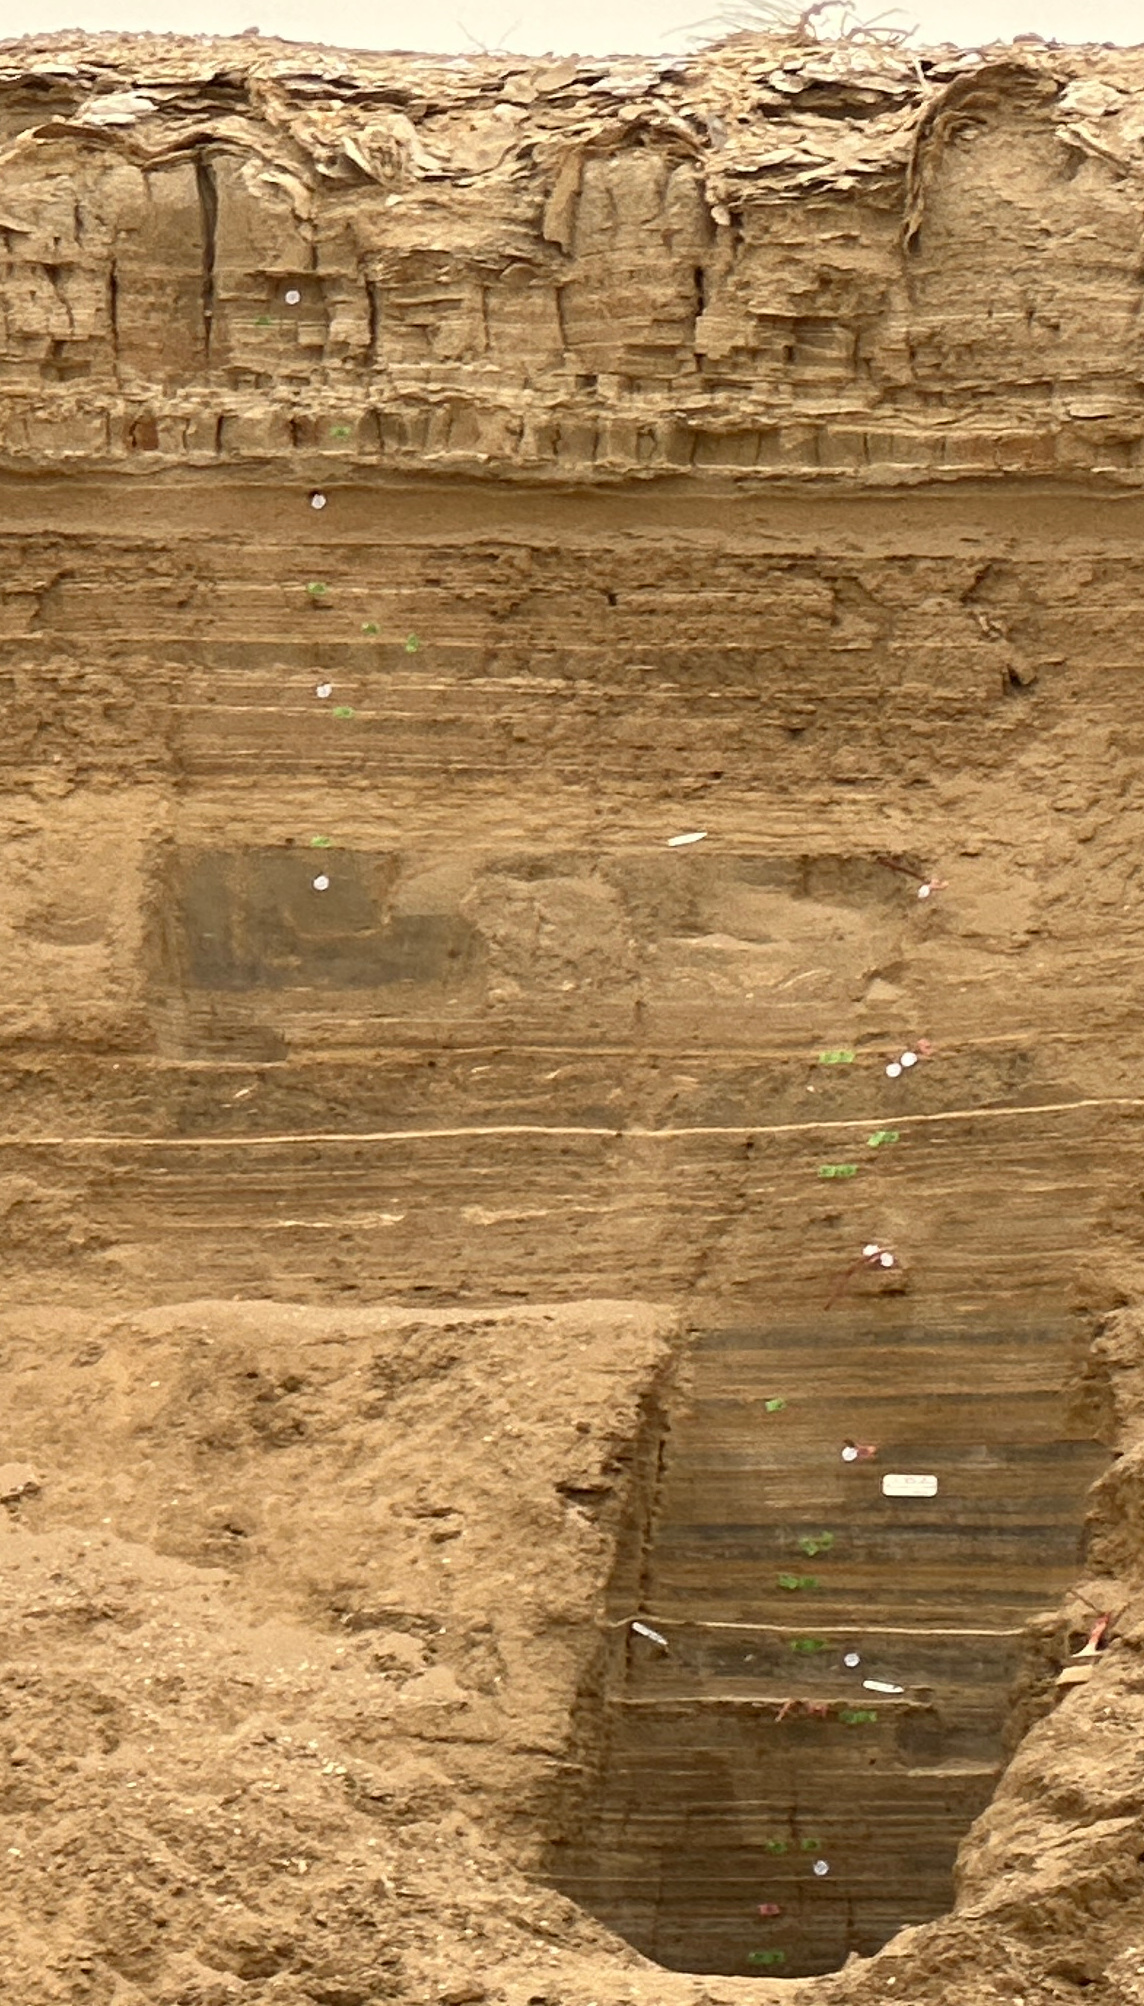
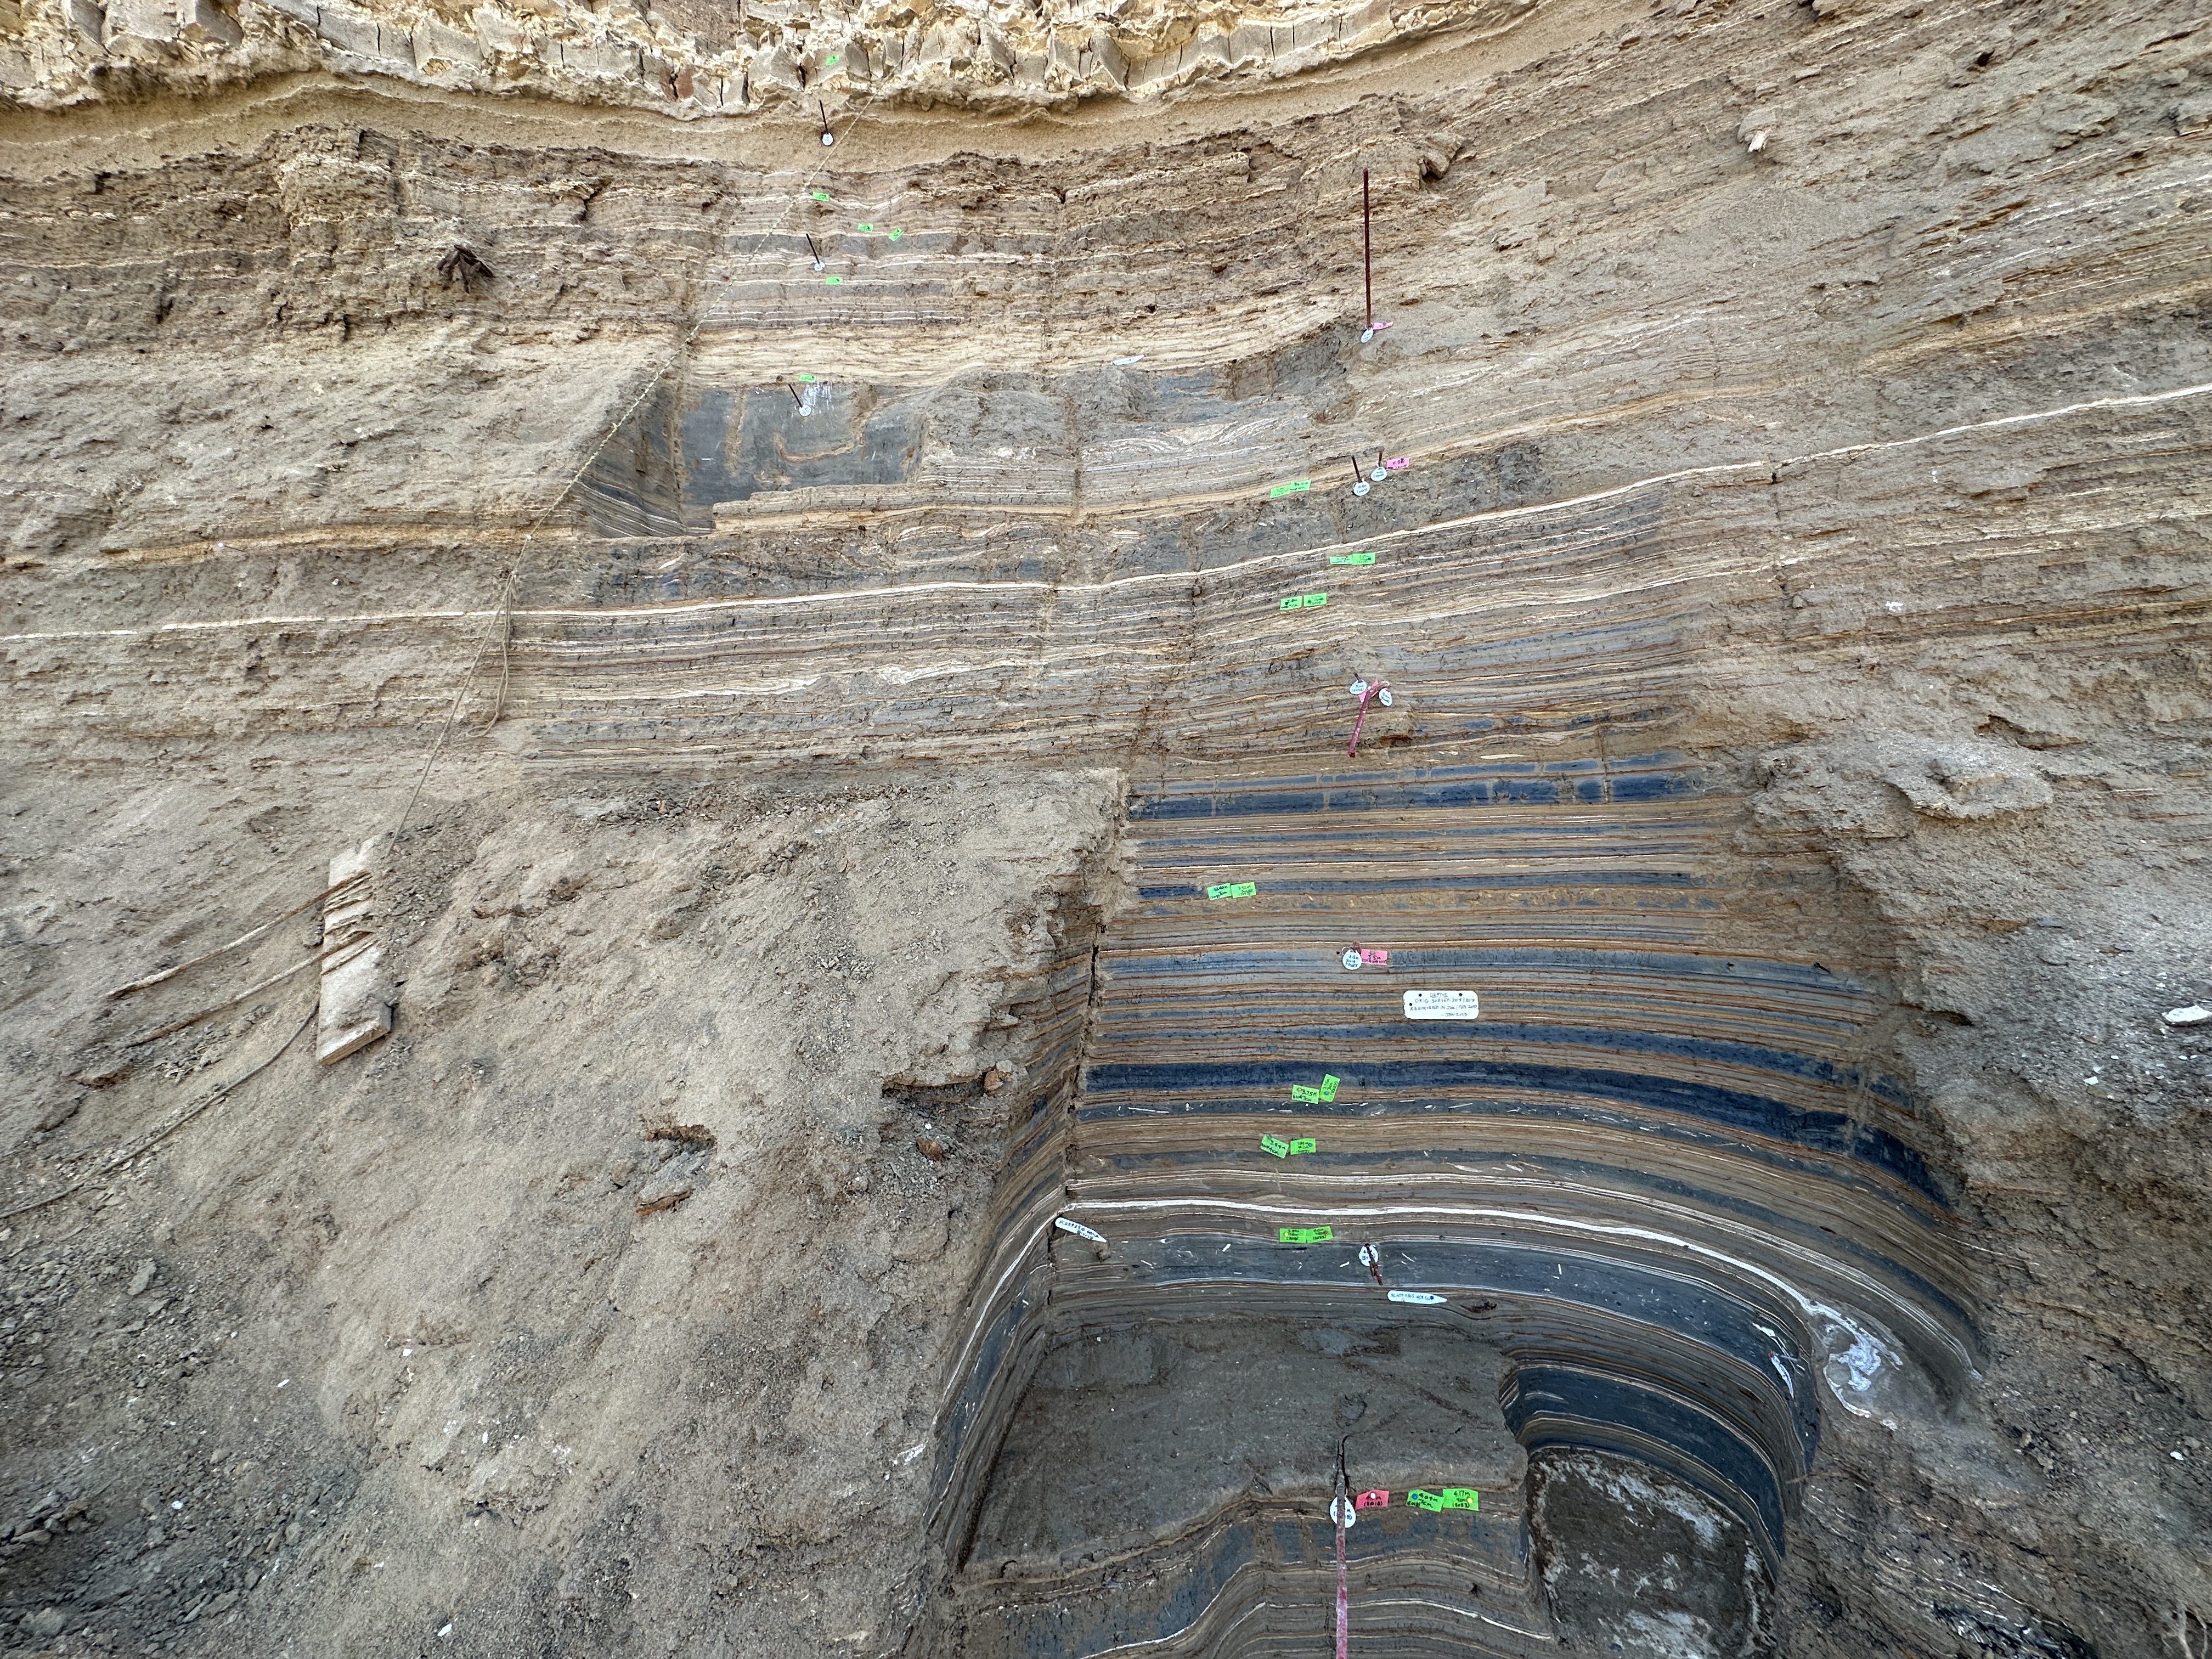
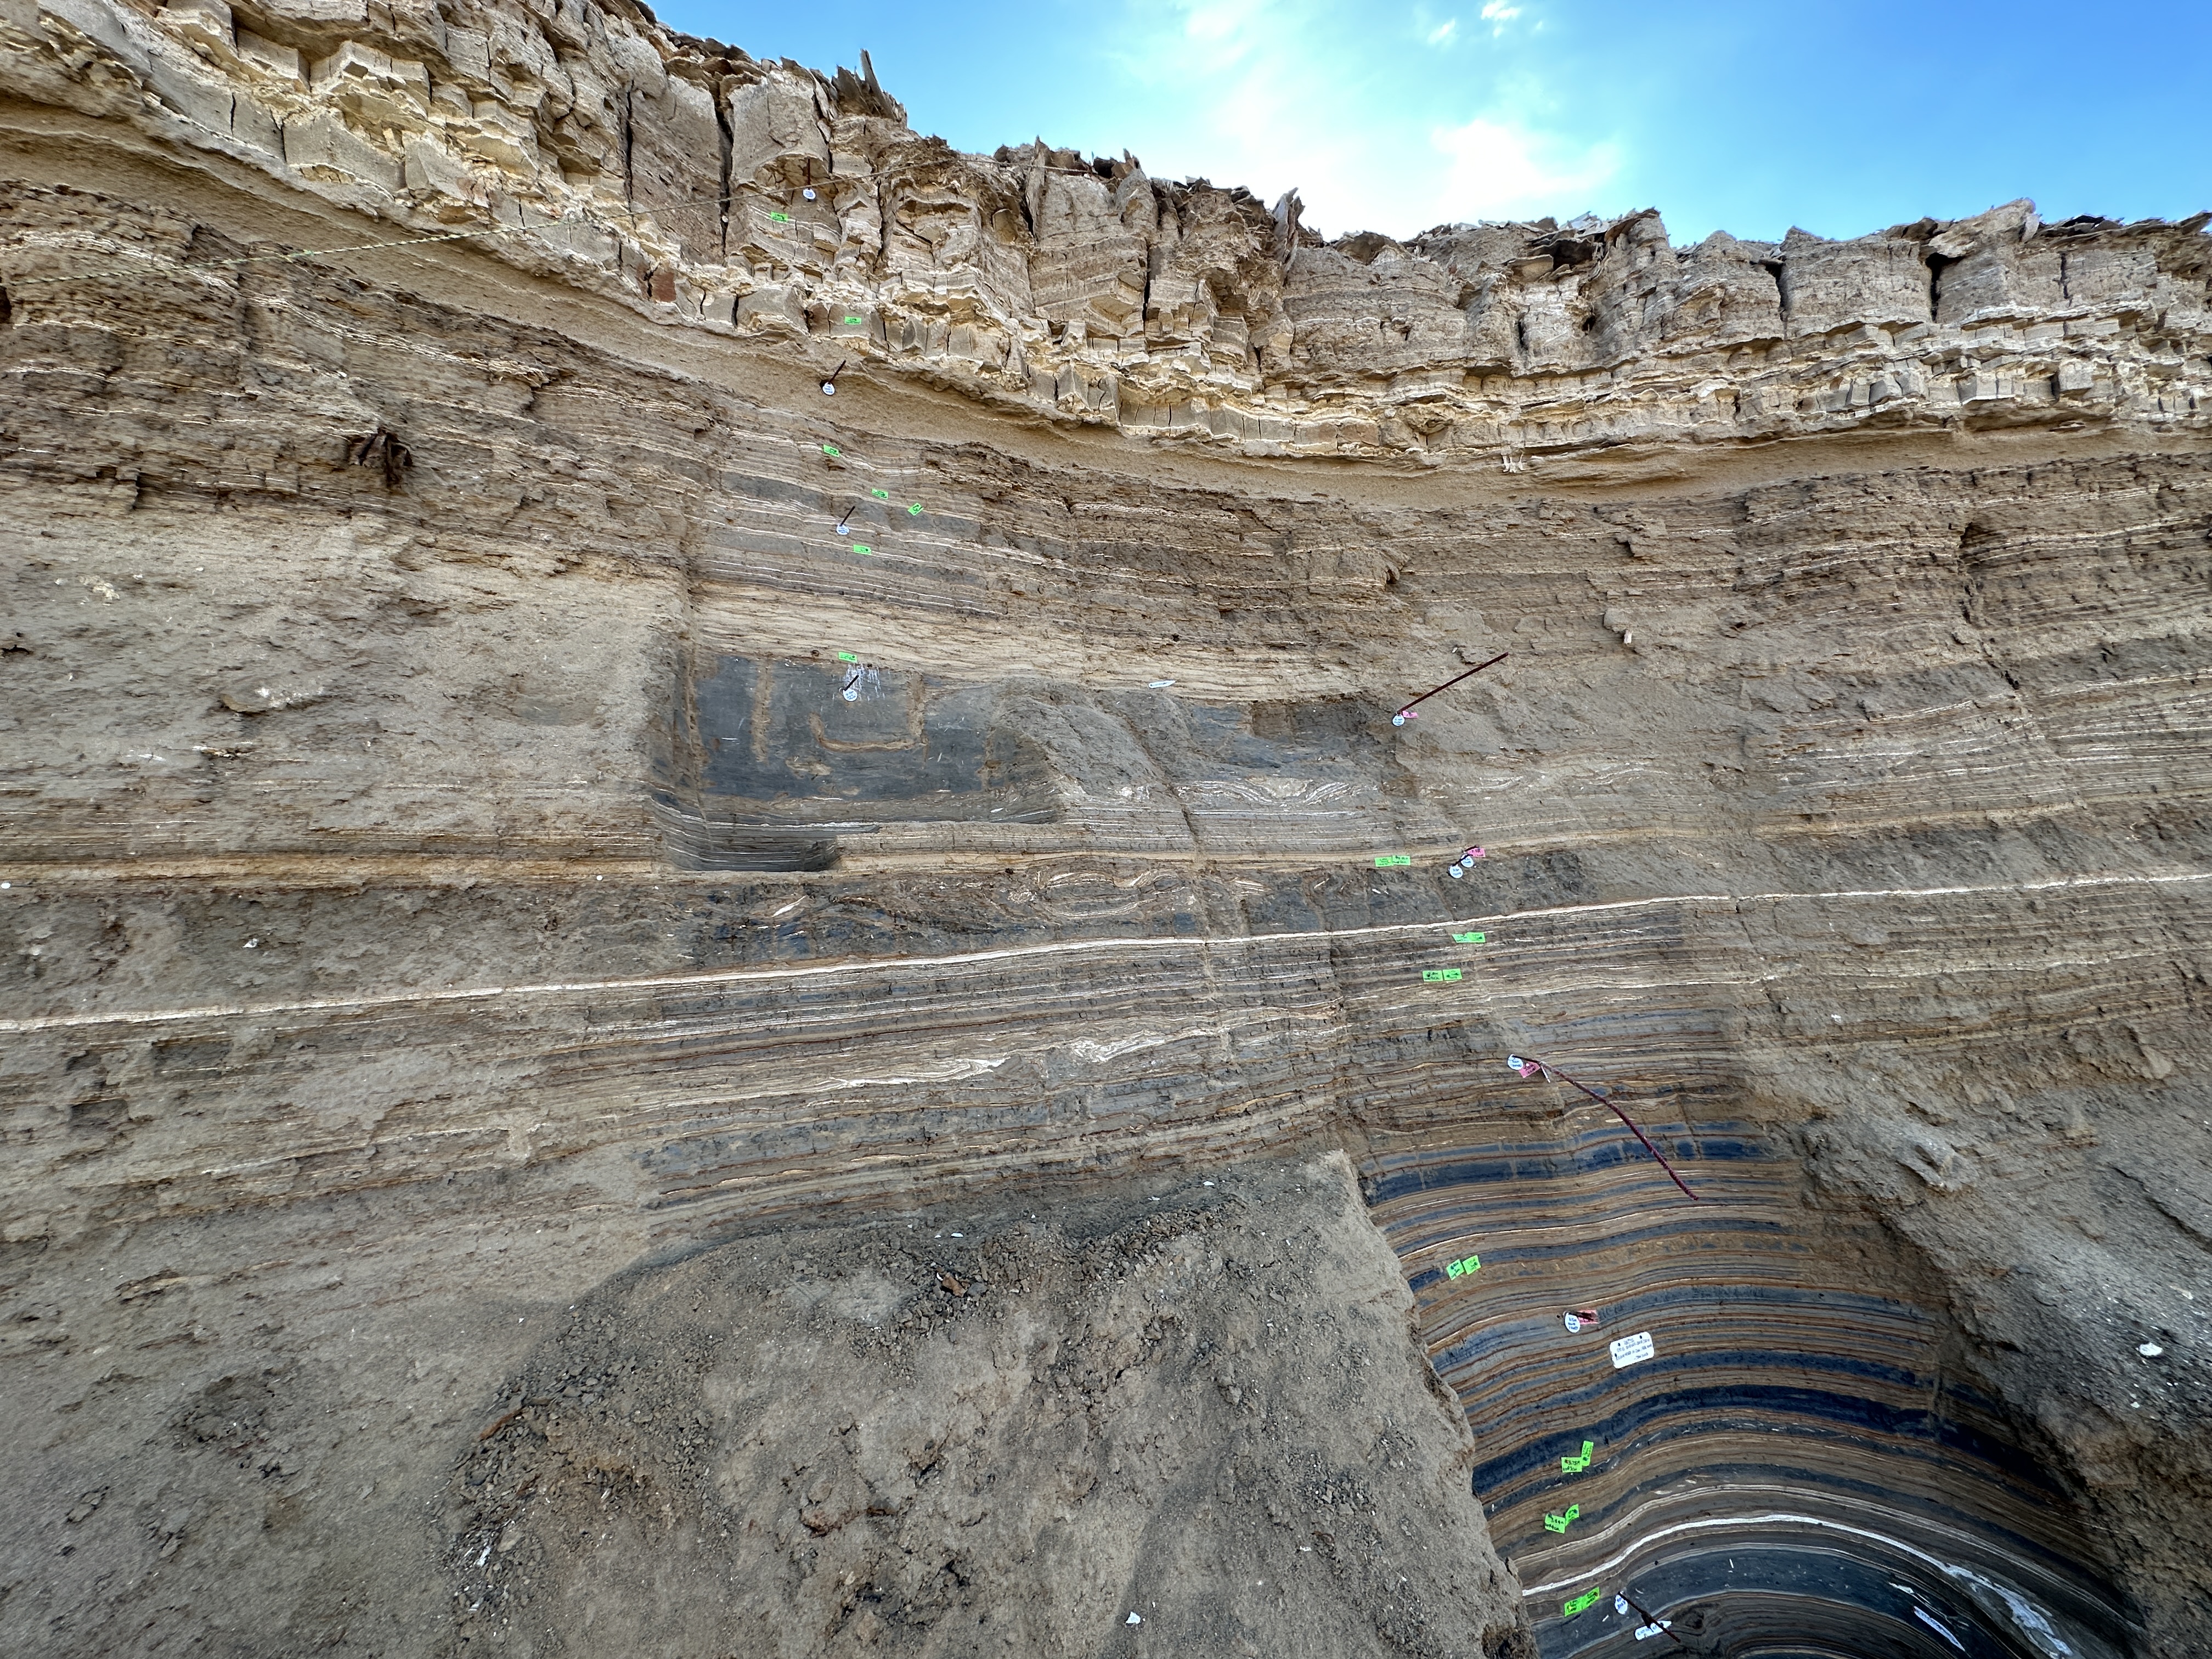
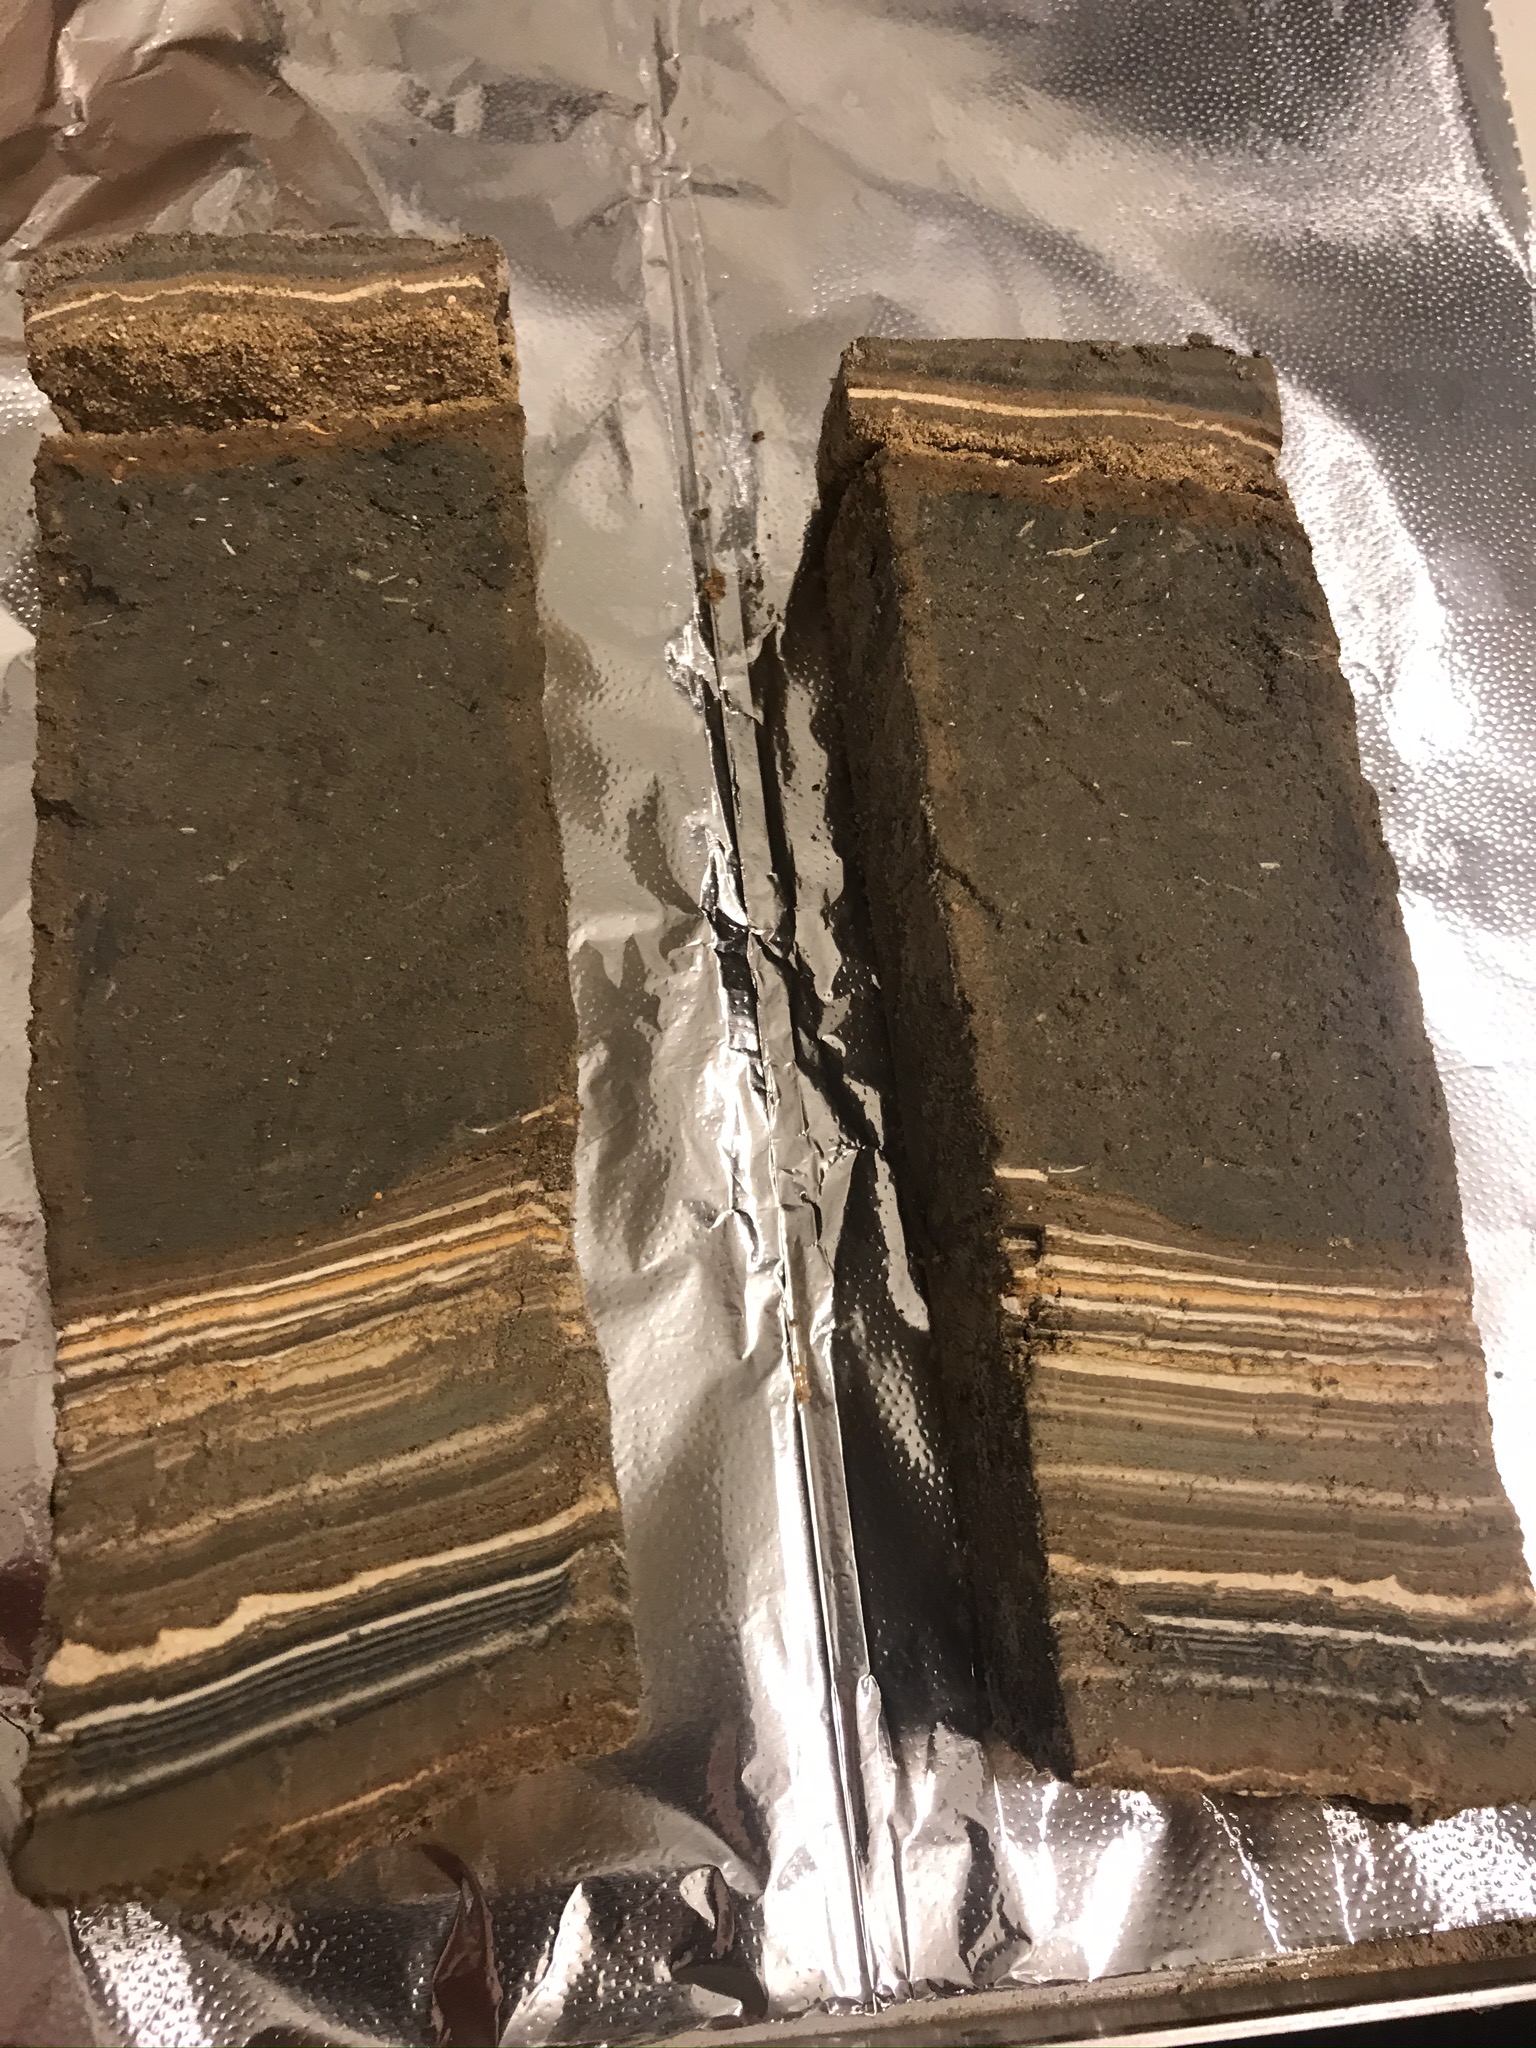
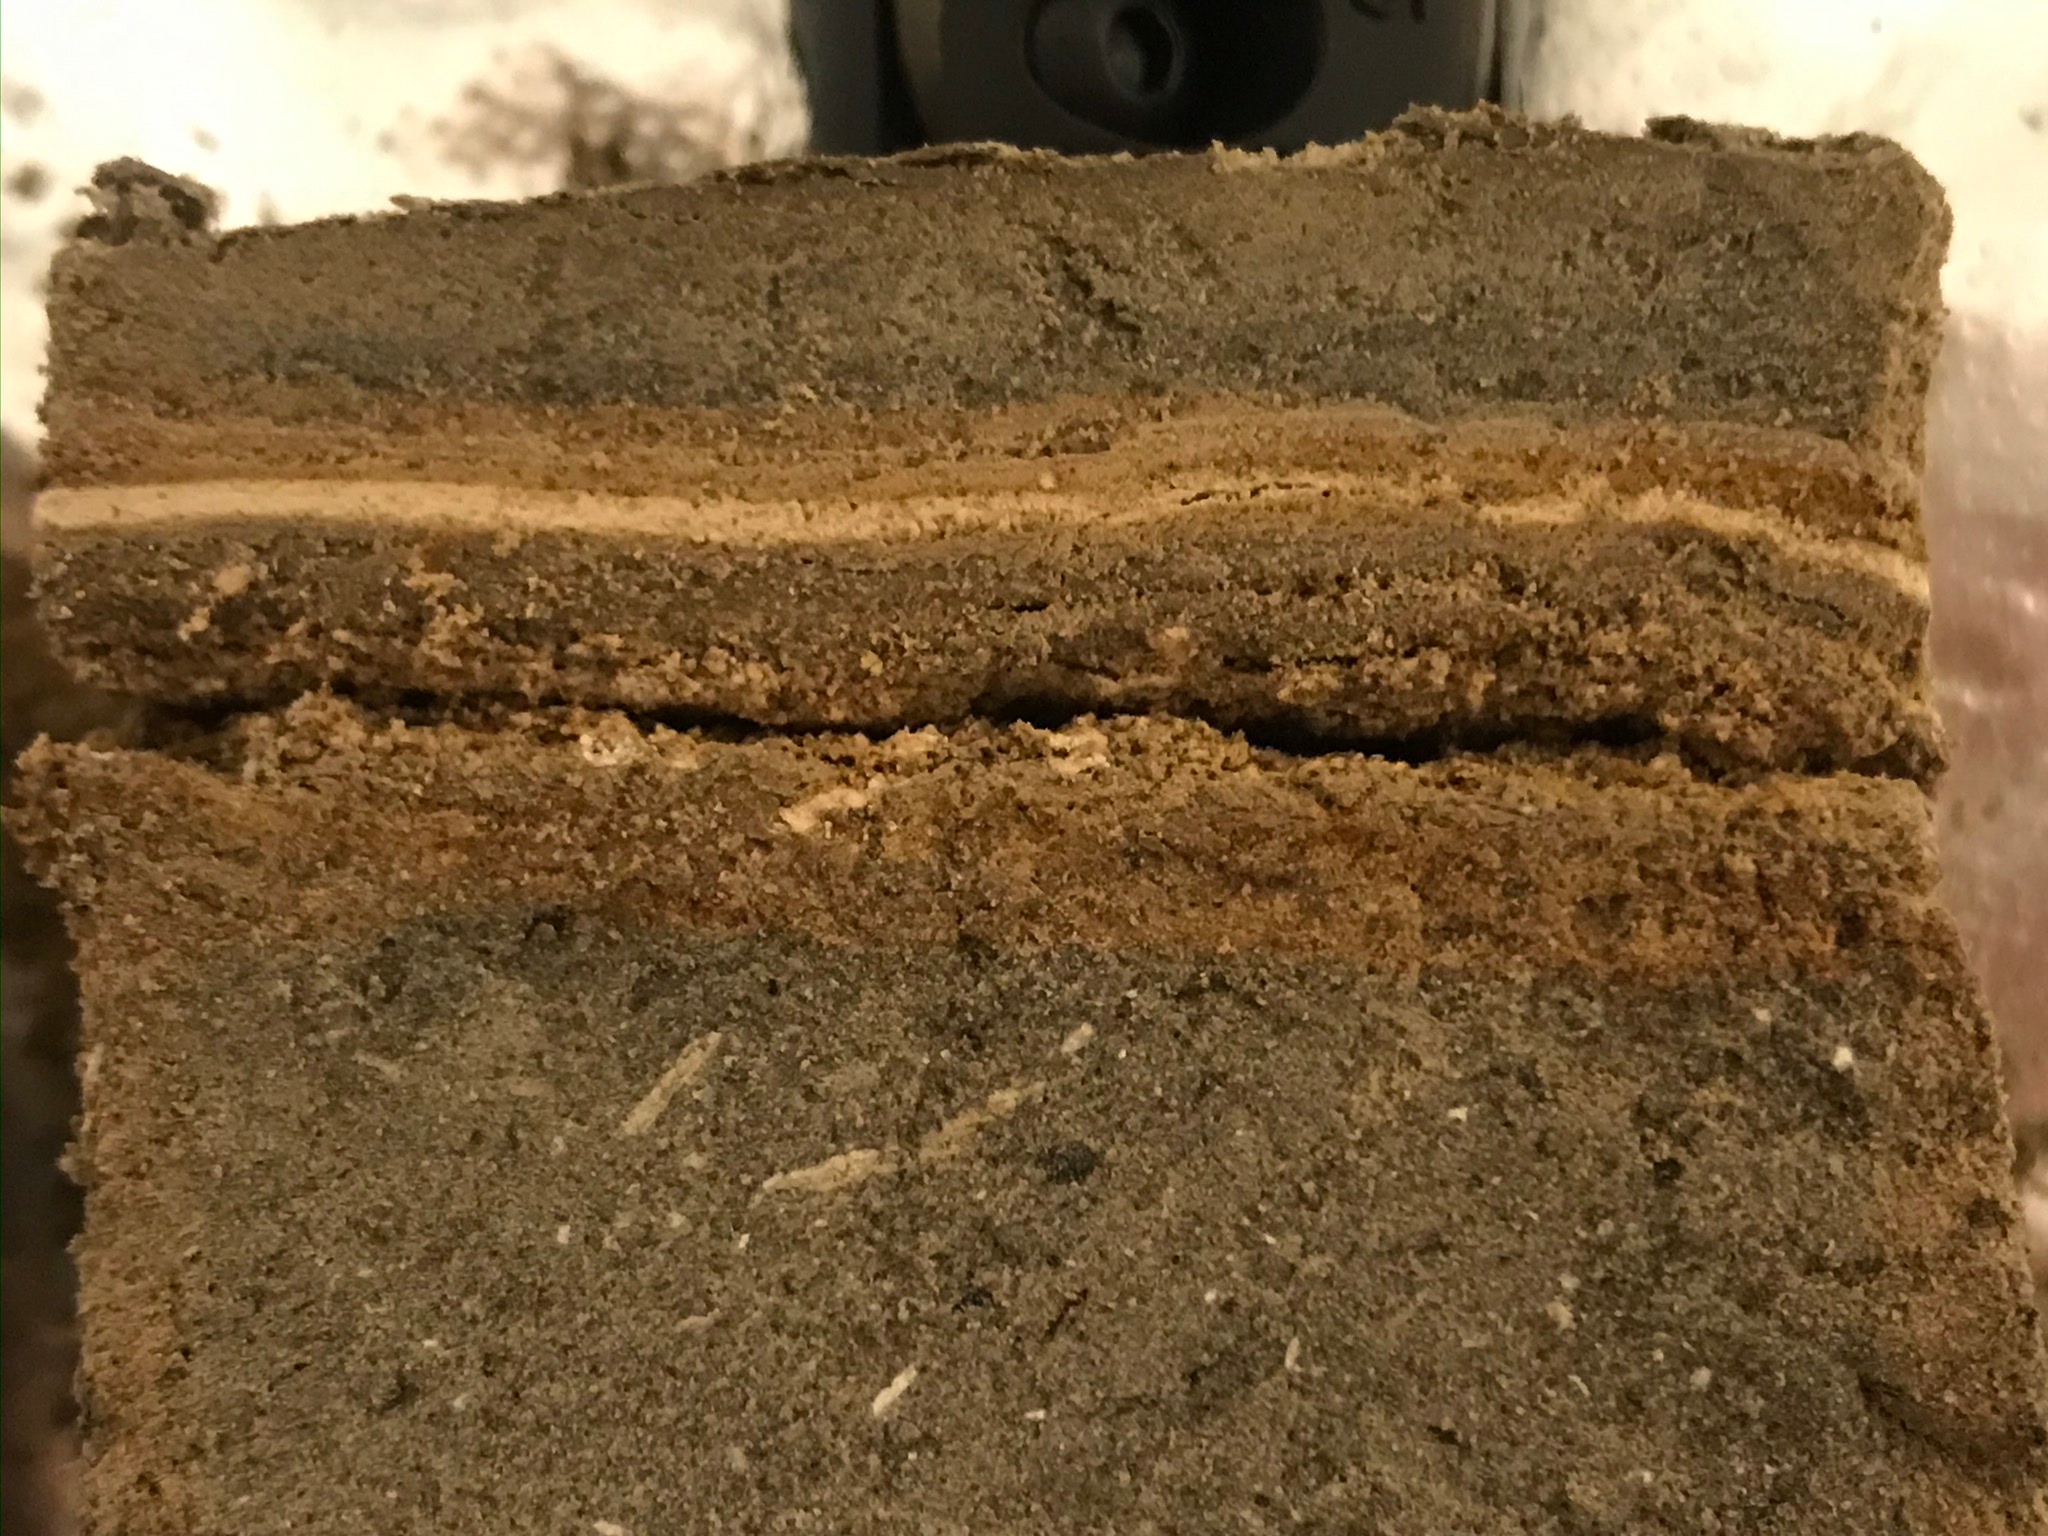
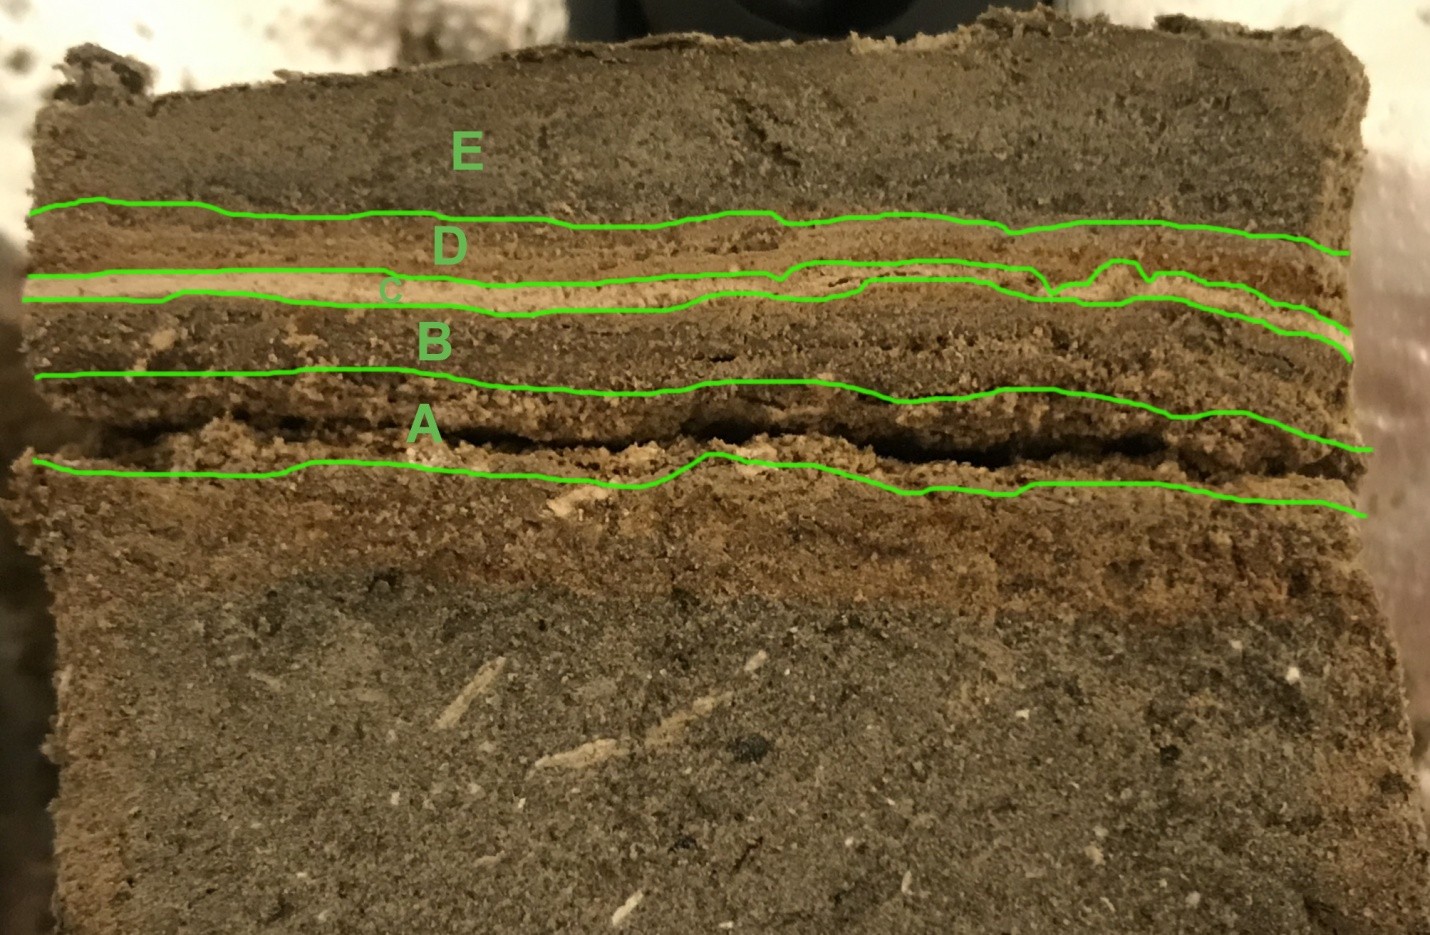
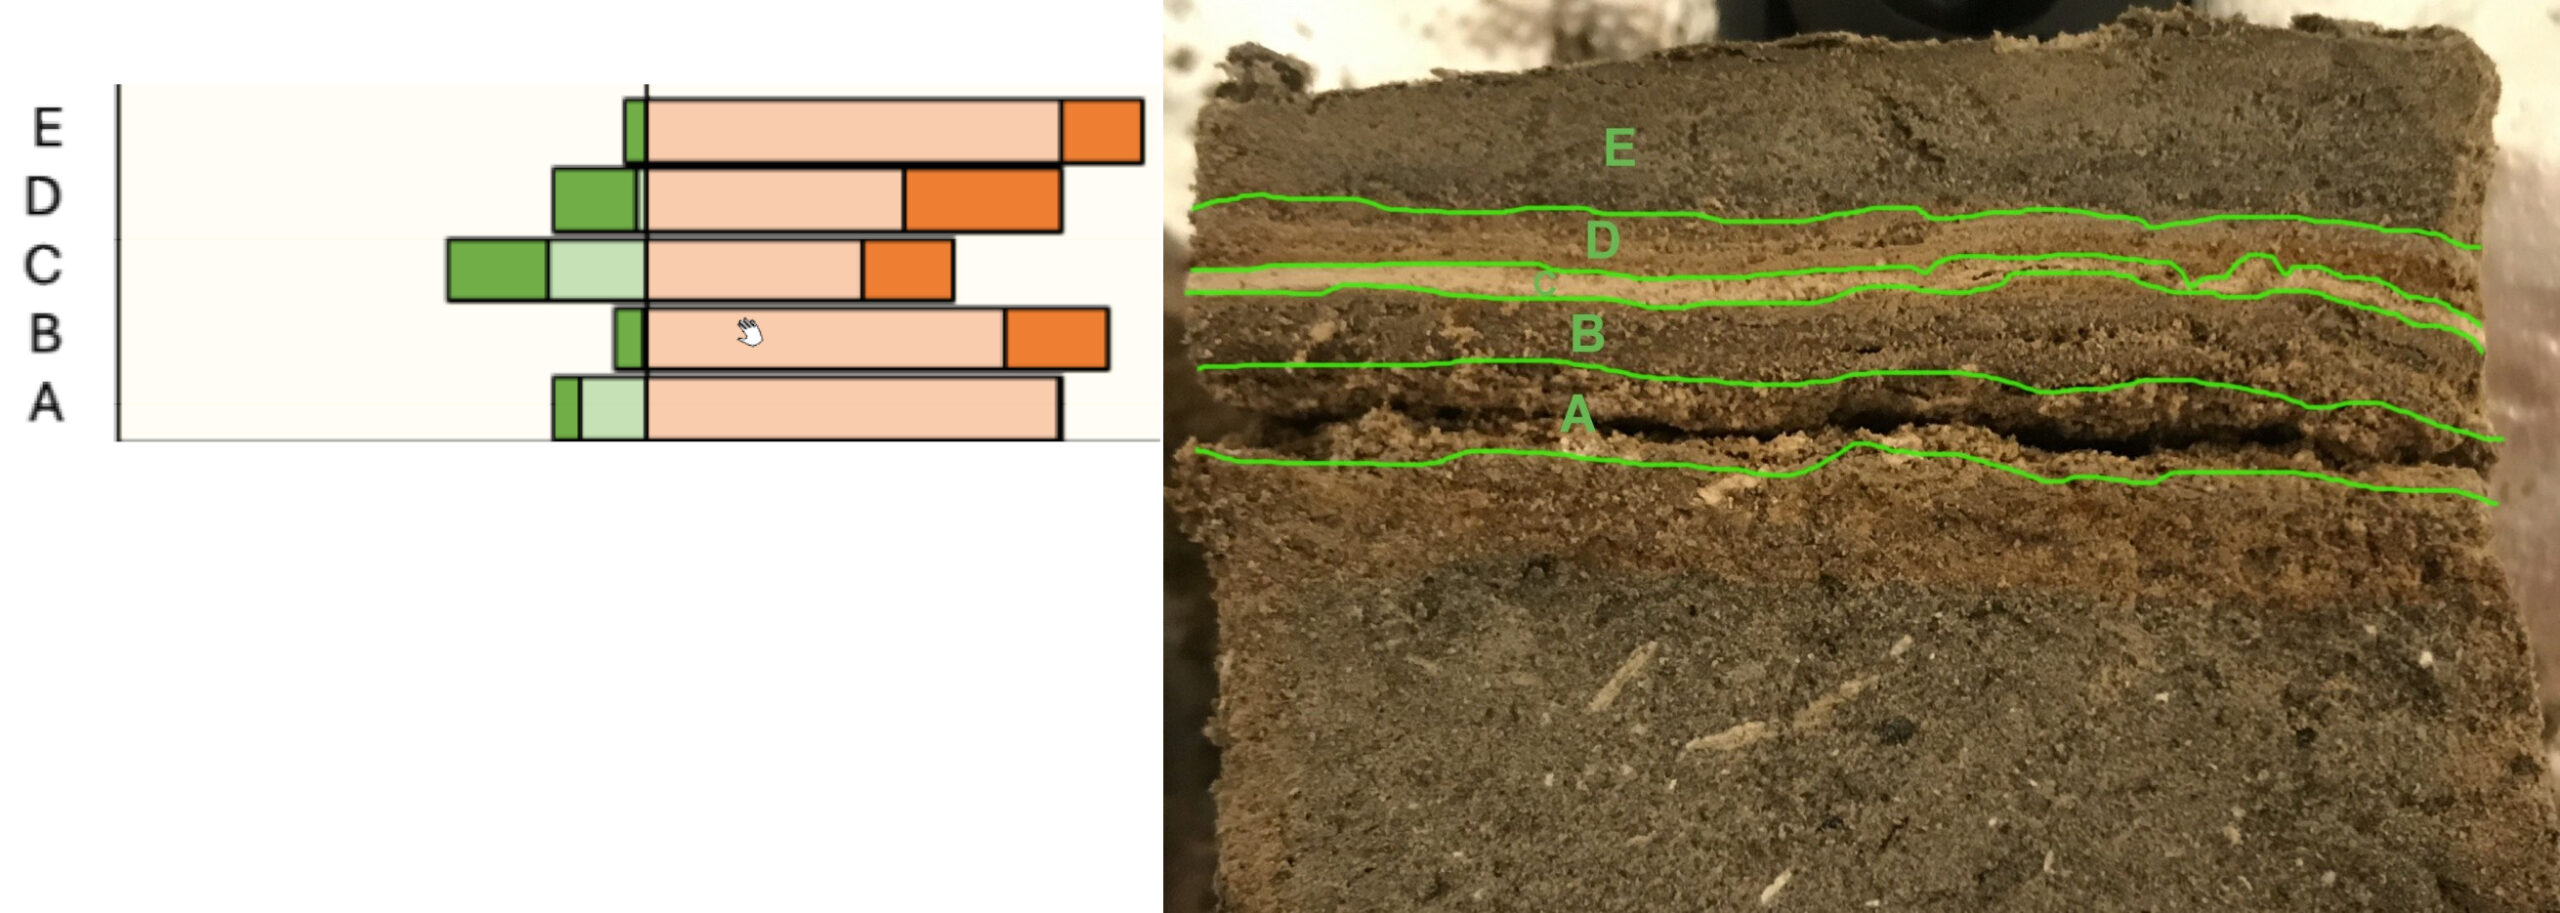
 Events B (Josephus Quake - 31 BCE) and C (Jerusalem Quake - 26-36 CE) at site ZA-1
Photo by Jefferson Williams (2000)
 Thin Section Slide from sample taken at site ZA-1
Jefferson Williams (2000)
- from Leroy et al. (2010)
 Figure 3
Photographs of the location of samples in the wall of gully A in and above the seismites of 31 BC and AD 363 in the Ze’elim site
click on image to open in a new tab
Leroy et al. (2010)
- from Leroy et al. (2010)
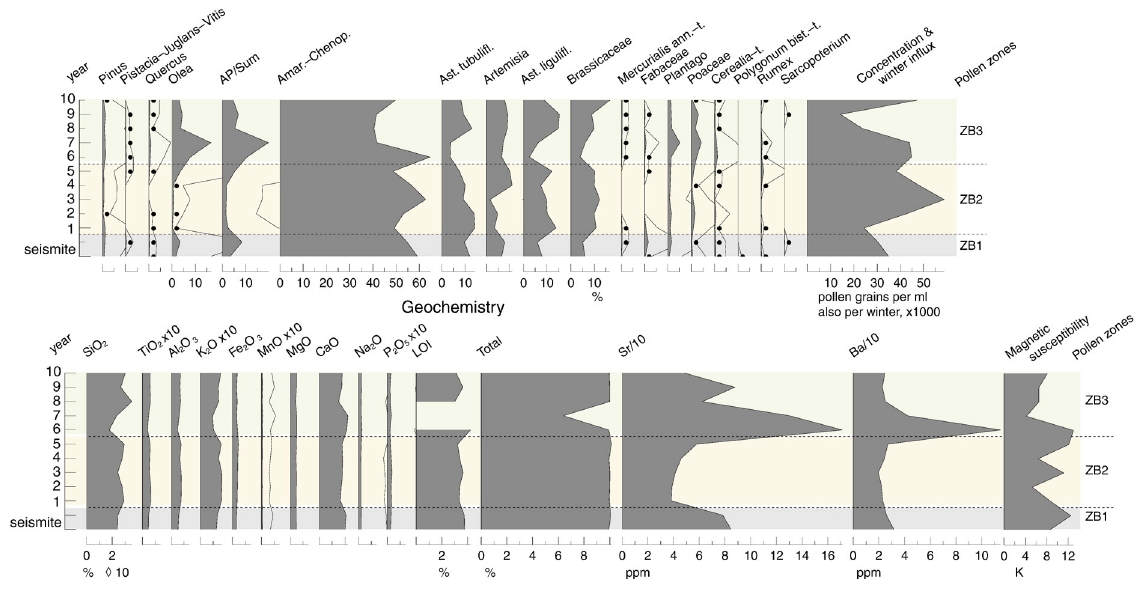 Figure 5
Earthquake at 31 BC in the Ze’elim site (seismite B). Top: Pollen and spore diagram for selected curves. Bottom: geochemistry and magnetic susceptibility. Thin line: 10× exaggeration curve. Black dots: values <0.5%. Vertical axis: years after earthquake
click on image to open in a new tab
Leroy et al. (2010)
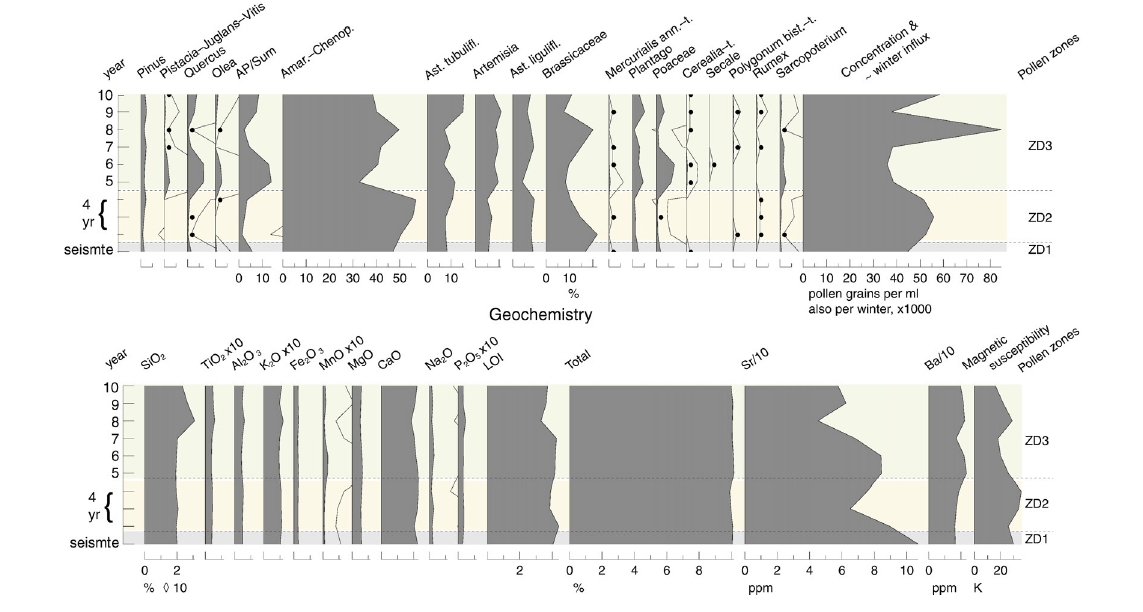 Figure 6
Earthquake at AD 363 in the Ze’elim site (seismite D). Top: Pollen and spore diagram for selected curves. Bottom: geochemistry and magnetic susceptibility. Thin line: 10× exaggeration curve. Black dots: values <0.5%. Vertical axis: years after earthquake.
click on image to open in a new tab
Leroy et al. (2010)
- from Leroy et al. (2010)
 Figure 4
Various hypotheses for calculating pollen influx after each earthquake (pollen concentration in varying numbers of years after the earthquake). Bottom is seismite B; top is seismite D. The thick line represents the best hypothesis because of the stable influx.
click on image to open in a new tab
Leroy et al. (2010)
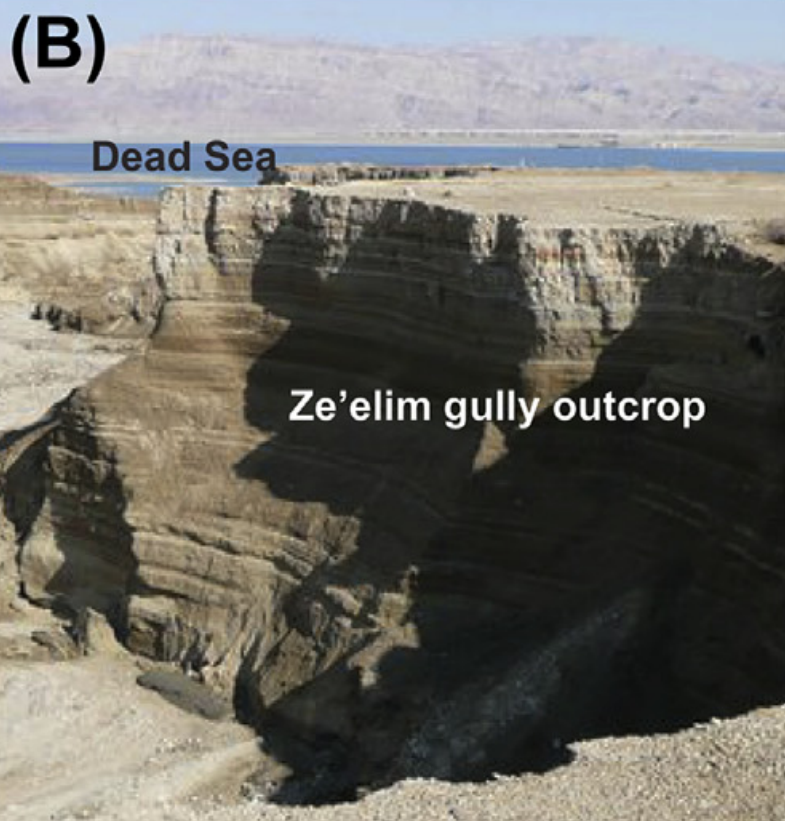 Figure 1b
Photo of the Ze'elim gully outcrop sampled in this study (Photo by L. Lopez-Merino).
click on image to open in a new tab
López-Merino et al. (2016)
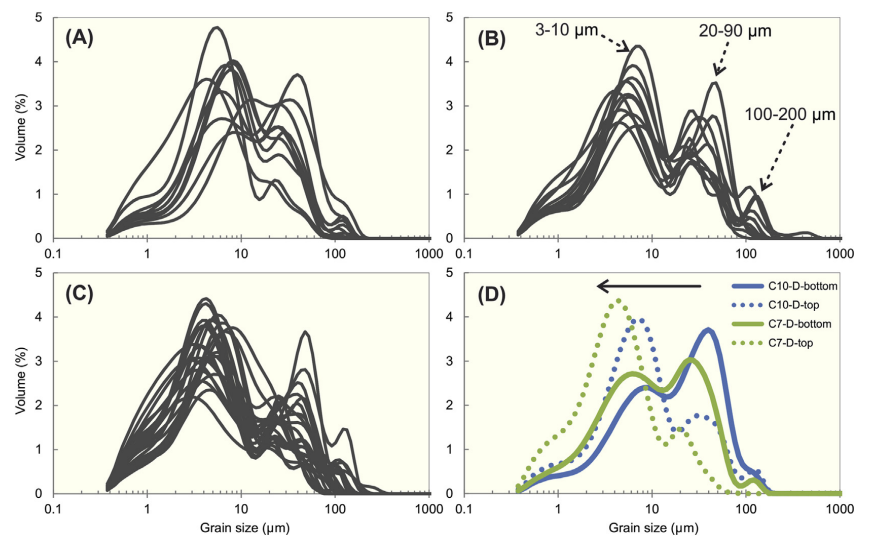 Figure 2
Grain-size distribution in detrital samples from blocks ZA11B2 (A), ZA11B3R (B) and ZA11B5L (C). Grain-size distribution of detrital laminae C7 and C10 (numbers as in Supplementary Table S2) from block ZA11B2 showing upward fining pointing to graded bedding during flash-flood events are also shown (D)
click on image to open in a new tab
López-Merino et al. (2016)
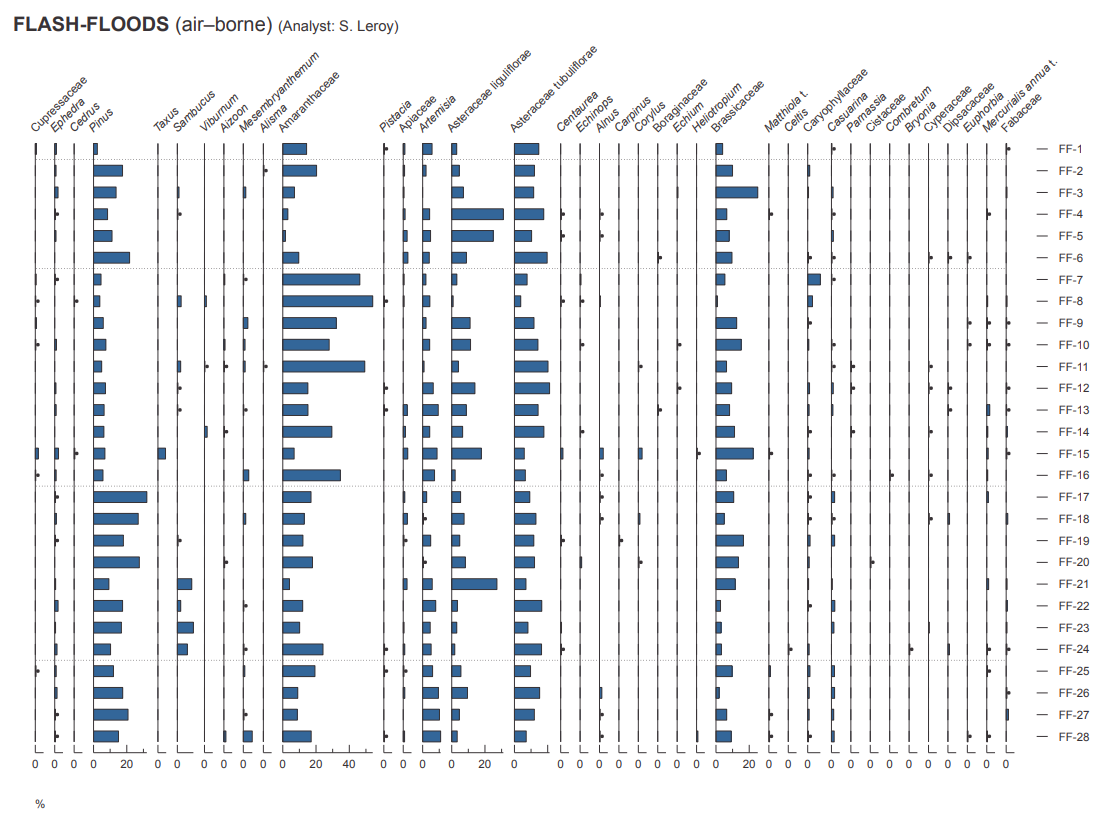 Figure 3
Percentage diagram of well-preserved pollen (air-borne) in modern flash-flood samples. Black dots represent percentages below 0.5%. Flash-flood samples are grouped by months and ordered from North to South. Details on flash-flood samples are given in Supplementary Table S3.
click on image to open in a new tab
López-Merino et al. (2016)
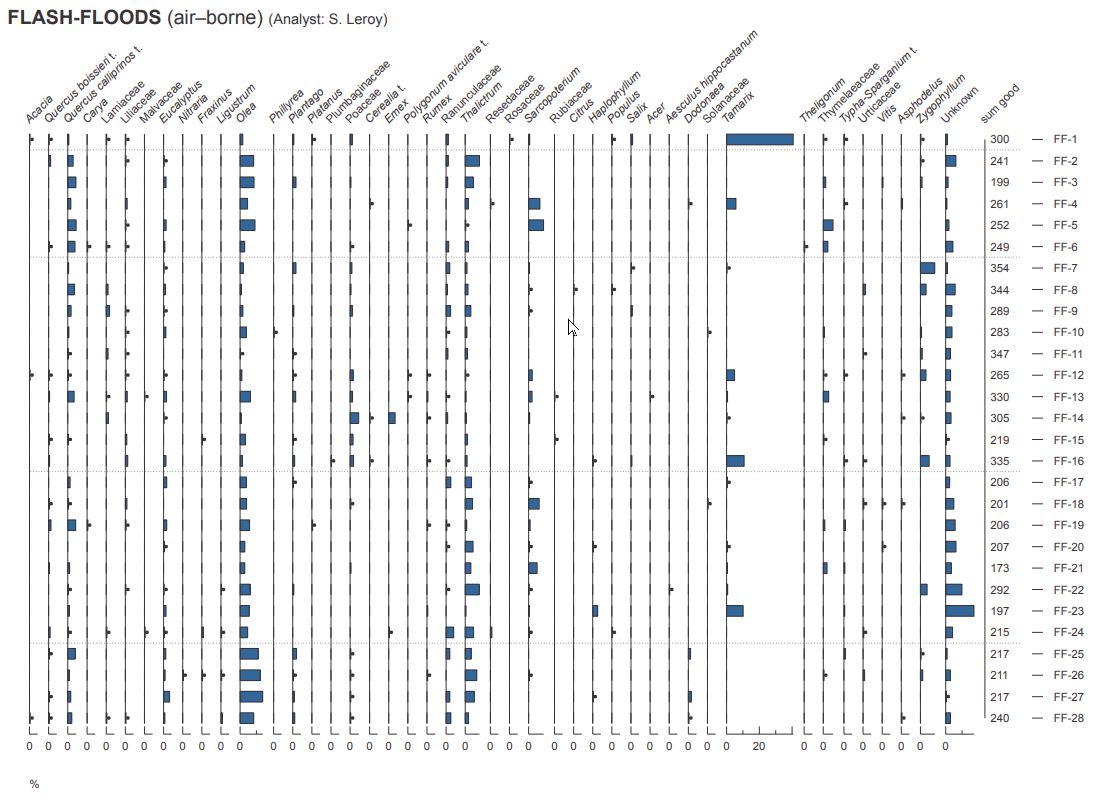 Figure 3
Percentage diagram of well-preserved pollen (air-borne) in modern flash-flood samples. Black dots represent percentages below 0.5%. Flash-flood samples are grouped by months and ordered from North to South. Details on flash-flood samples are given in Supplementary Table S3.
click on image to open in a new tab
López-Merino et al. (2016)
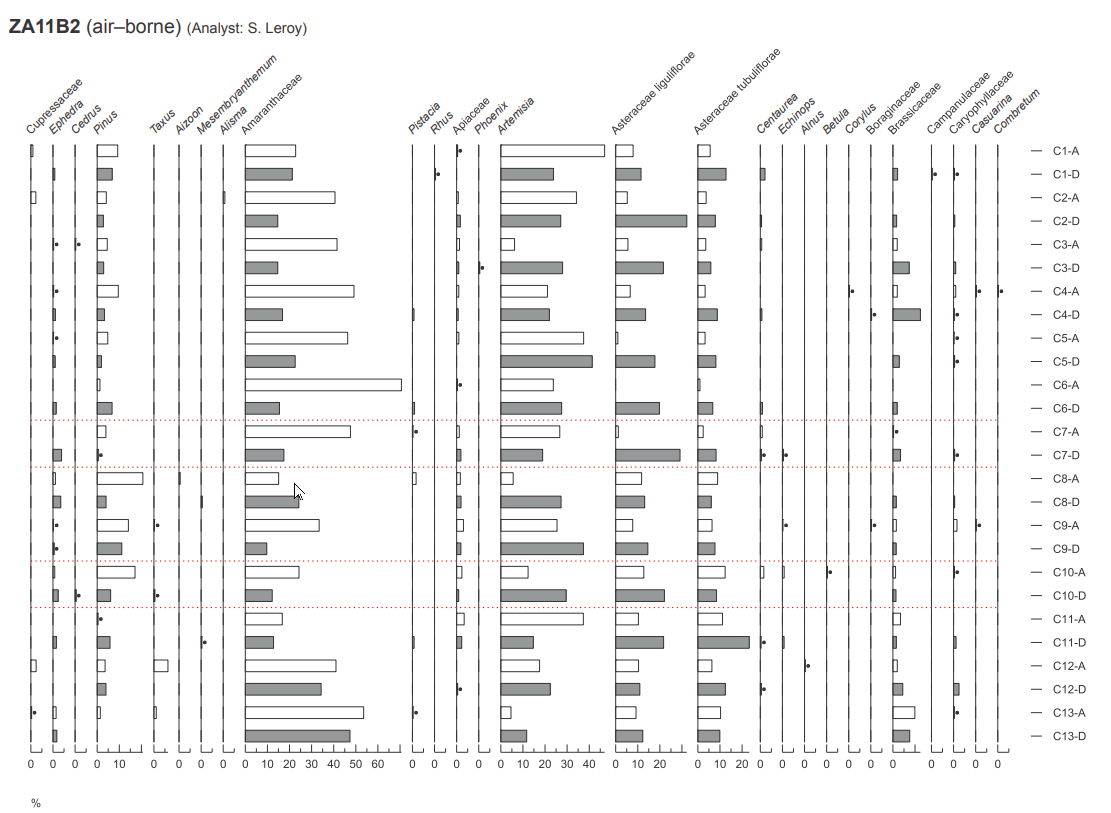 Figure 4
Percentage diagram of well-preserved pollen (air-borne) of block ZA11B2 (late 19th early 20th century high-stand). Black dots represent percentages below 0.5%. Red lines separate non-contiguous samples. Detrital laminae are in grey and aragonite laminae in white. Numbers of the detrital-aragonite couplets are as in Supplementary Table S2. (For interpretation of the references to colour in this figure legend, the reader is referred to the web version of this article.)
click on image to open in a new tab
López-Merino et al. (2016)
Figure 4
Percentage diagram of well-preserved pollen (air-borne) of block ZA11B2 (late 19th early 20th century high-stand). Black dots represent percentages below 0.5%. Red lines separate non-contiguous samples. Detrital laminae are in grey and aragonite laminae in white. Numbers of the detrital-aragonite couplets are as in Supplementary Table S2. (For interpretation of the references to colour in this figure legend, the reader is referred to the web version of this article.)
click on image to open in a new tab
López-Merino et al. (2016)
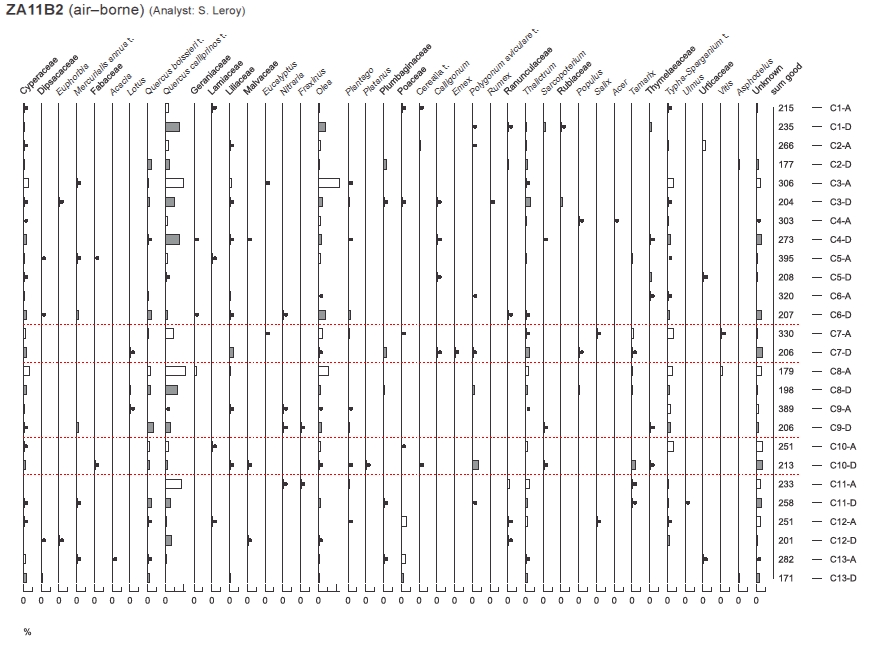 Figure 4
Percentage diagram of well-preserved pollen (air-borne) of block ZA11B2 (late 19th early 20th century high-stand). Black dots represent percentages below 0.5%. Red lines separate non-contiguous samples. Detrital laminae are in grey and aragonite laminae in white. Numbers of the detrital-aragonite couplets are as in Supplementary Table S2. (For interpretation of the references to colour in this figure legend, the reader is referred to the web version of this article.)
click on image to open in a new tab
López-Merino et al. (2016)
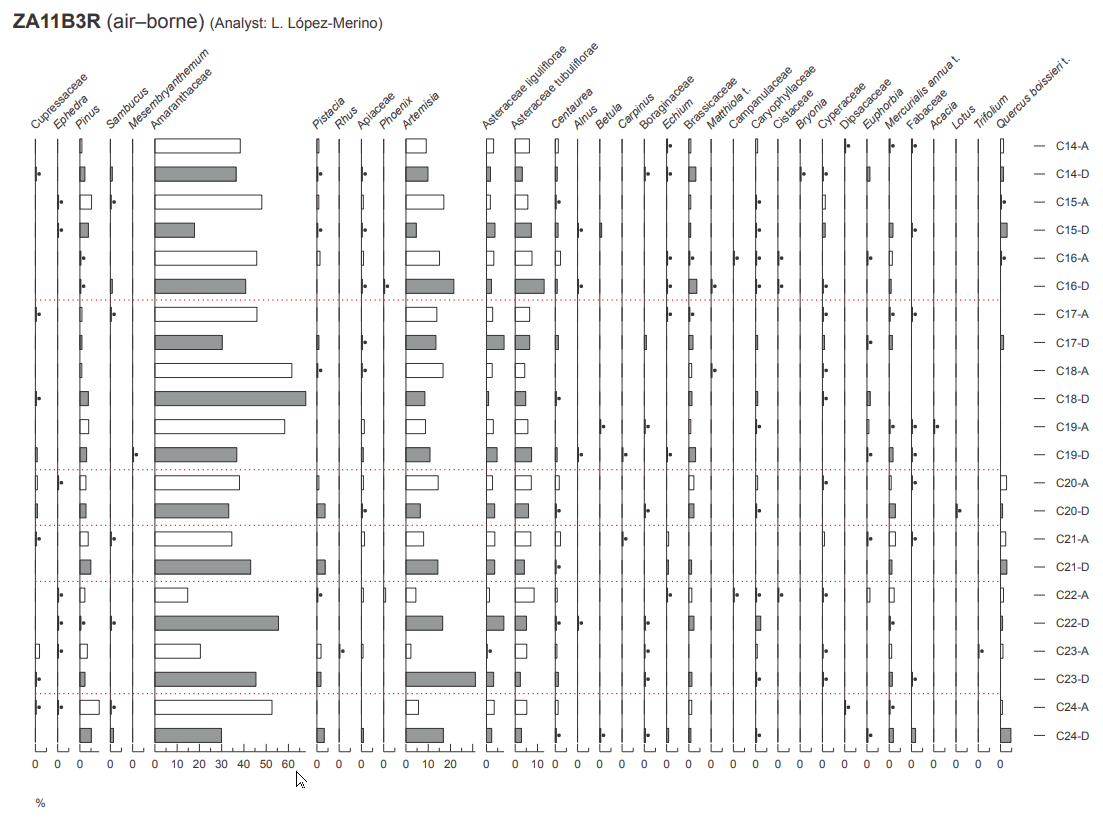 Figure 5
Percentage diagram of well-preserved pollen (air-borne) of block ZA11B3R (Hellenistic-early Roman high-stand). Black dots represent percentages below 0.5%. Red lines separate non-contiguous samples. Detrital laminae are in grey and aragonite laminae in white. Numbers of the detrital-aragonite couplets are as in Supplementary Table S2. (For interpretation of the references to colour in this figure legend, the reader is referred to the web version of this article.)
click on image to open in a new tab
López-Merino et al. (2016)
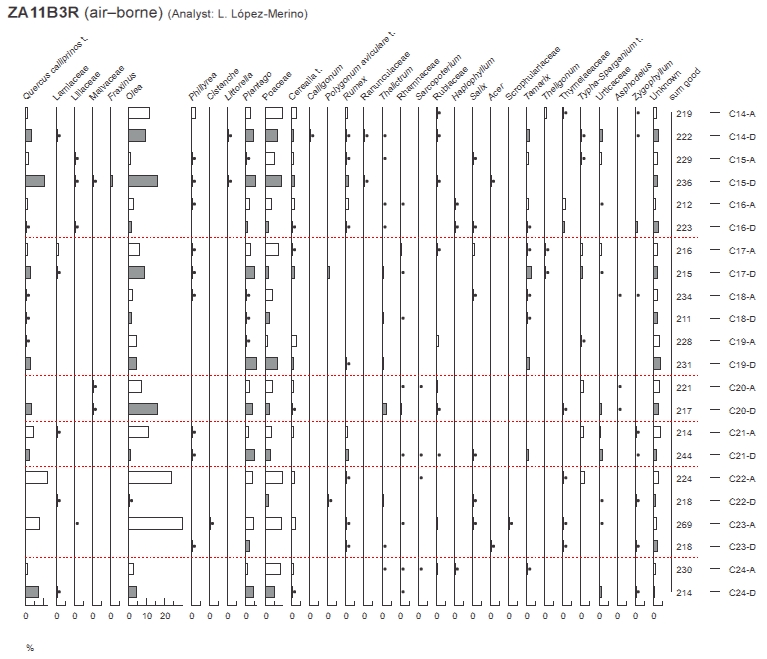 Figure 5
Percentage diagram of well-preserved pollen (air-borne) of block ZA11B3R (Hellenistic-early Roman high-stand). Black dots represent percentages below 0.5%. Red lines separate non-contiguous samples. Detrital laminae are in grey and aragonite laminae in white. Numbers of the detrital-aragonite couplets are as in Supplementary Table S2. (For interpretation of the references to colour in this figure legend, the reader is referred to the web version of this article.)
click on image to open in a new tab
López-Merino et al. (2016)
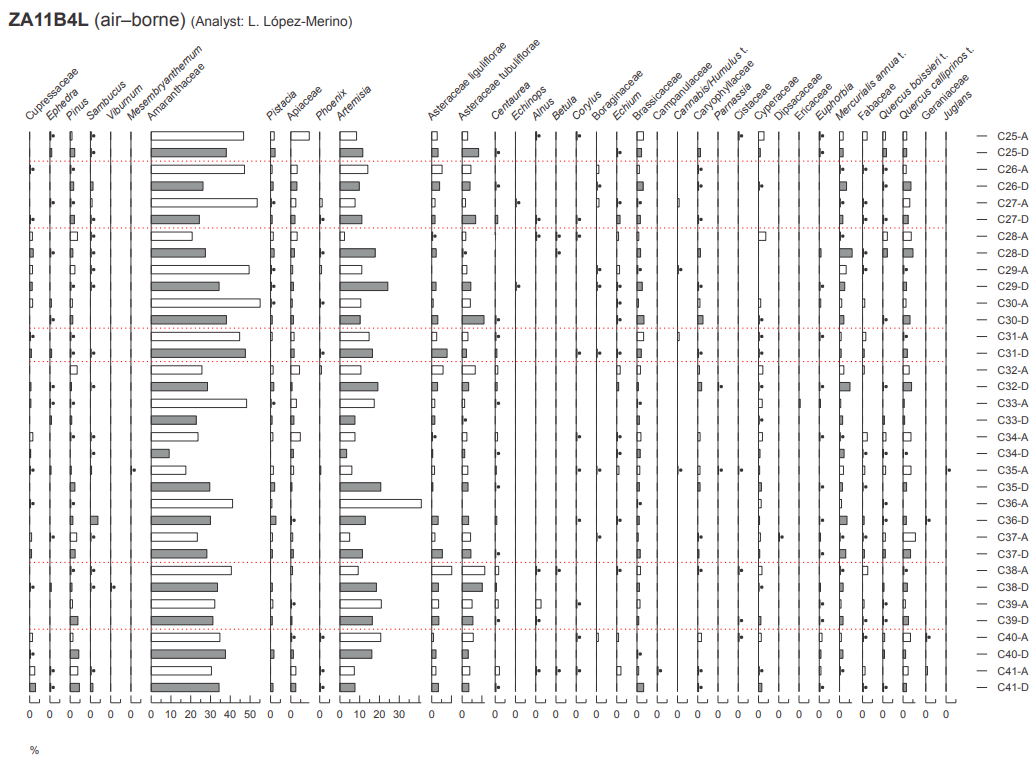 Figure 6
Percentage diagram of well-preserved pollen (air-borne) of block ZA11B4L (Hellenistic-early Roman high-stand). Black dots represent percentages below 0.5%. Red lines separate non-contiguous samples. Detrital laminae are in grey and aragonite laminae in white. Numbers of the detrital-aragonite couplets are as in Supplementary Table S2. (For interpretation of the references to colour in this figure legend, the reader is referred to the web version of this article.)
click on image to open in a new tab
López-Merino et al. (2016)
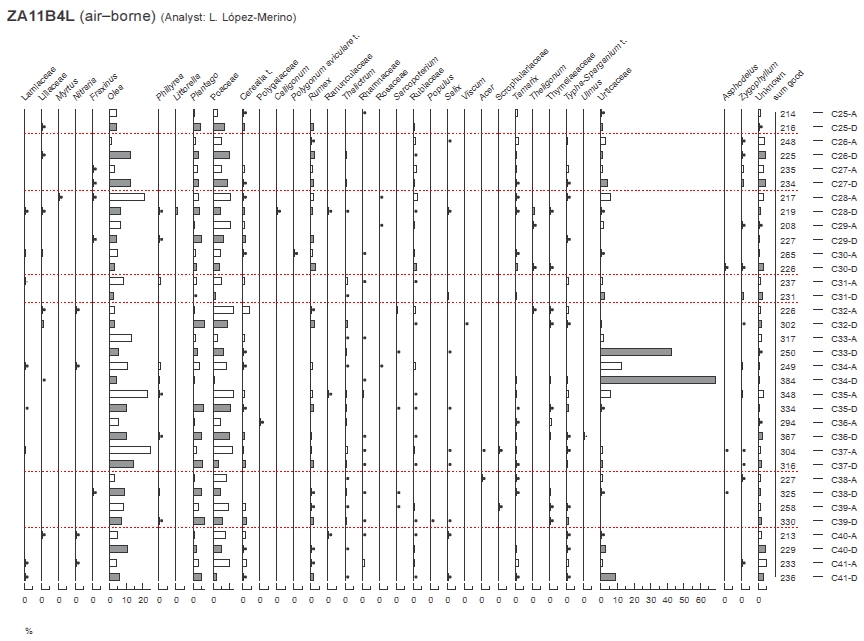 Figure 6
Percentage diagram of well-preserved pollen (air-borne) of block ZA11B4L (Hellenistic-early Roman high-stand). Black dots represent percentages below 0.5%. Red lines separate non-contiguous samples. Detrital laminae are in grey and aragonite laminae in white. Numbers of the detrital-aragonite couplets are as in Supplementary Table S2. (For interpretation of the references to colour in this figure legend, the reader is referred to the web version of this article.)
click on image to open in a new tab
López-Merino et al. (2016)
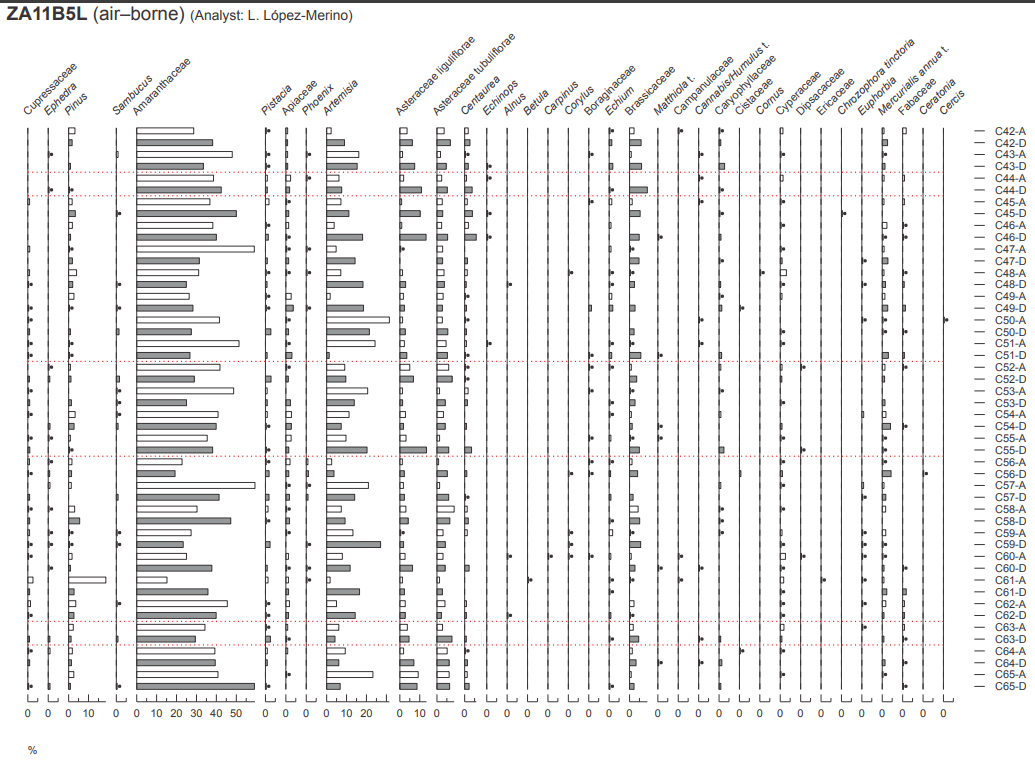 Figure 7
Percentage diagram of well-preserved pollen (air-borne) of block ZA11B5L (Hellenistic-early Roman high-stand). Black dots represent percentages below 0.5%. Red lines separate non-contiguous samples. Detrital laminae are in grey and aragonite laminae in white. Numbers of the detrital-aragonite couplets are as in Supplementary Table S2. (For interpretation of the references to colour in this figure legend, the reader is referred to the web version of this article.)
click on image to open in a new tab
López-Merino et al. (2016)
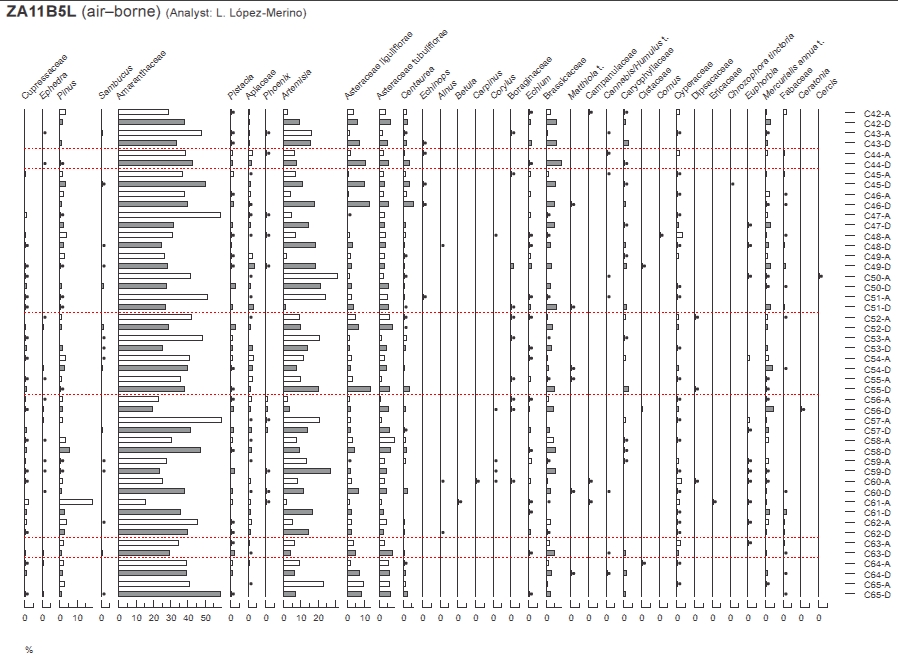 Figure 7
Percentage diagram of well-preserved pollen (air-borne) of block ZA11B4L (Hellenistic-early Roman high-stand). Black dots represent percentages below 0.5%. Red lines separate non-contiguous samples. Detrital laminae are in grey and aragonite laminae in white. Numbers of the detrital-aragonite couplets are as in Supplementary Table S2. (For interpretation of the references to colour in this figure legend, the reader is referred to the web version of this article.)
click on image to open in a new tab
López-Merino et al. (2016)
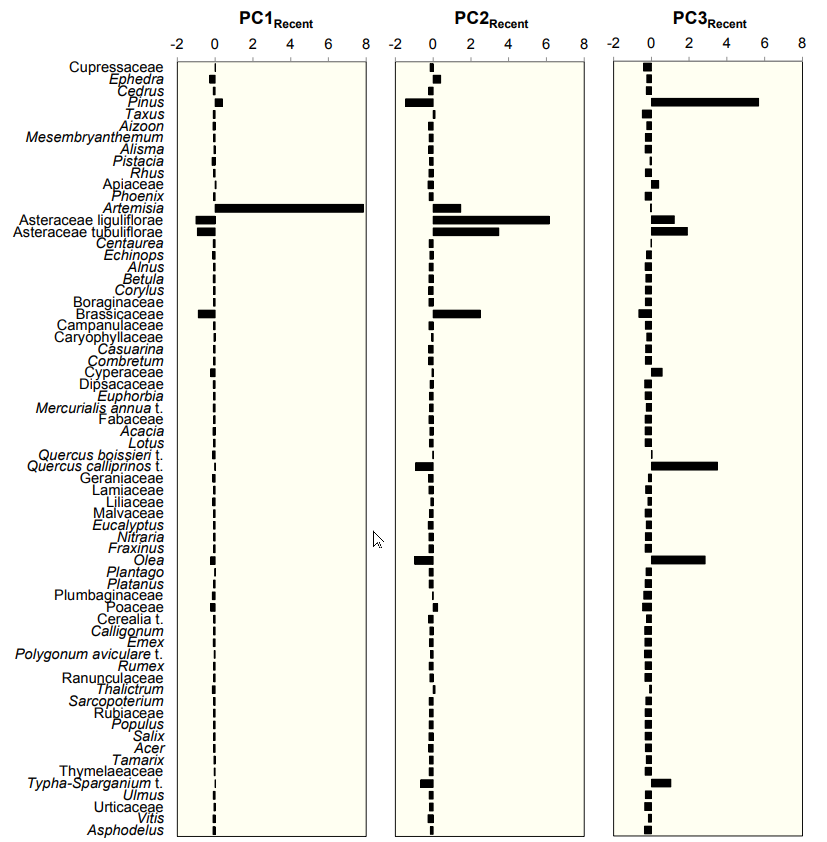 Figure 8
Factor scores of the three principal components (transposed matrix) obtained for the air-borne component of the late 19th early 20th centuries high-stand samples (block ZA11B2).
click on image to open in a new tab
López-Merino et al. (2016)
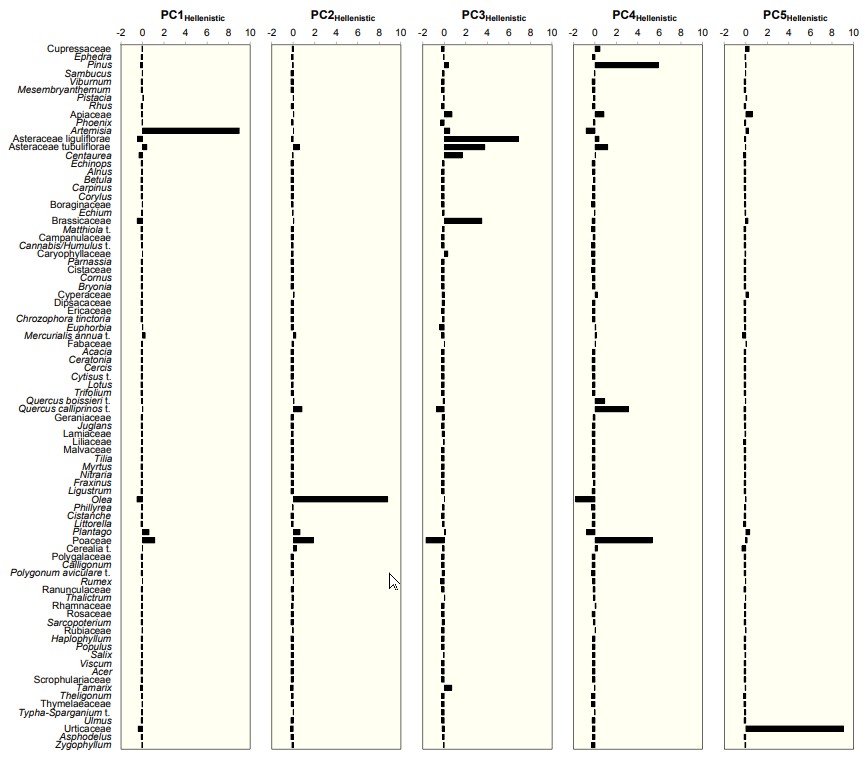 Figure 9
Factor scores of the five principal components (transposed matrix) obtained for the air-borne component of the Hellenistic-early Roman high-stand samples (blocks ZA11B3R, ZA11B4L and ZA11B5L).
click on image to open in a new tab
López-Merino et al. (2016)
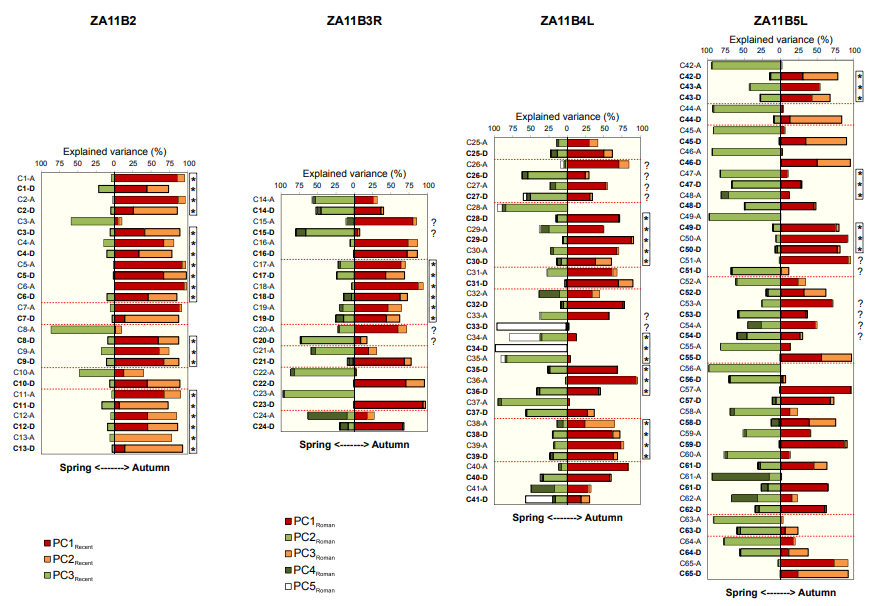 Figure 10
Percentage of explained variance (square of factor loadings x 100) of the principal components extracted for the late 19th early 20th centuries high-stand samples (PC1Recent, PC2Recent and PC3Recent) and the Hellenistic-early Roman high-stand samples (PC1Hellenistic, PC2Hellenistic, PC3Hellenistic, PC4Hellenistic and PC5Hellenistic). Proportion of variance that can be explained by the extracted principal components (communalities) is shown for each lamina. The graphs can be read as a sequence of laminae deposition (detrital and following aragonite), with the percentage of the variance explained by the principal components with autumn palynological assemblages plotting to the right and by the principal components with spring palynological assemblages plotting to the left. Asterisks (*) highlight the laminae in which it is possible that more than one detrital-aragonite couplet have been deposited in one year. Question marks (?) highlight the eight couplets with an anomalous result likely due to contamination during sampling. Red lines separate noncontiguous samples. Numbers of the detrital-aragonite couplets are as in Supplementary Table S2. (For interpretation of the references to colour in this figure legend, the reader is referred to the web version of this article.)
click on image to open in a new tab
López-Merino et al. (2016)
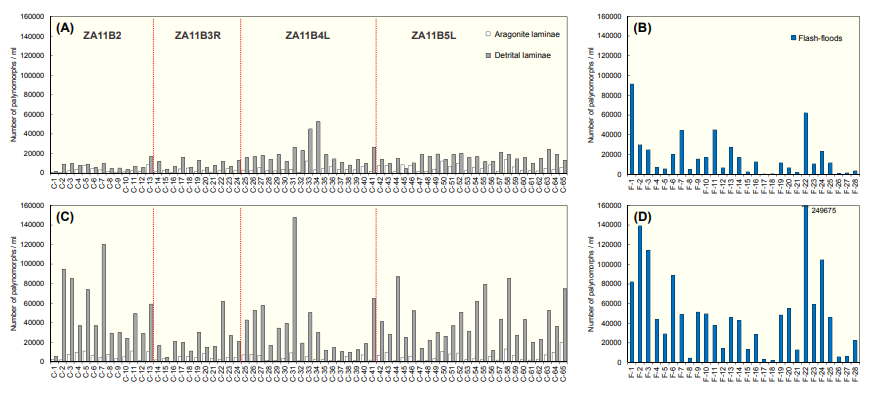 Figure 11
(A) Concentration of Total well-preserved pollen grains in the Ze'elim detrital-aragonite couplets. (B) Concentration of Total well-preserved pollen grains in modern flashflood samples. (C) Concentration of Total reworked pollen grains in the Ze'elim detrital-aragonite couplets. (D) Concentration of Total reworked pollen grains in the modern flashflood samples. Numbers of the detrital-aragonite couplets are as in Supplementary Table S2. Numbers of the flash-flood samples are given in Supplementary Table S3.
click on image to open in a new tab
López-Merino et al. (2016)
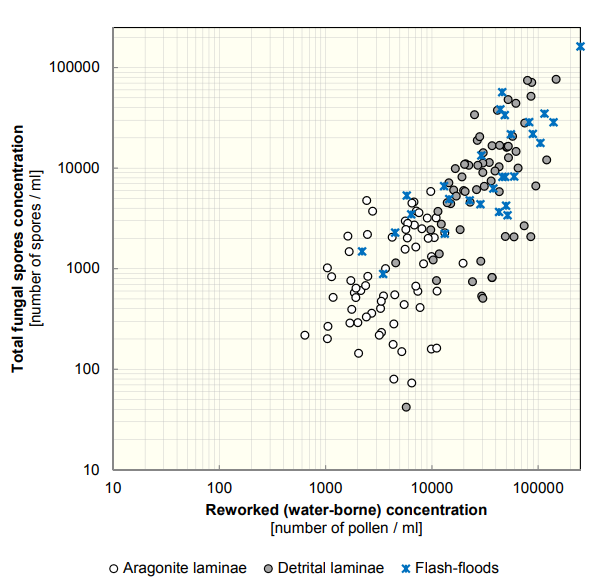 Figure 12
Concentration of Total reworked pollen grains (water-borne) versus Total fungal spores for detrital and aragonite laminae in the Ze'elim outcrop and contemporary flash-flood samples.
click on image to open in a new tab
López-Merino et al. (2016)
 Orthophoto of Site ZA-2 and ZA-3
Click on Image for high resolution magnifiable image
Drone photos by Jefferson Williams 10 Feb. 2023
 Panorama of Site ZA-2 (South Wall)
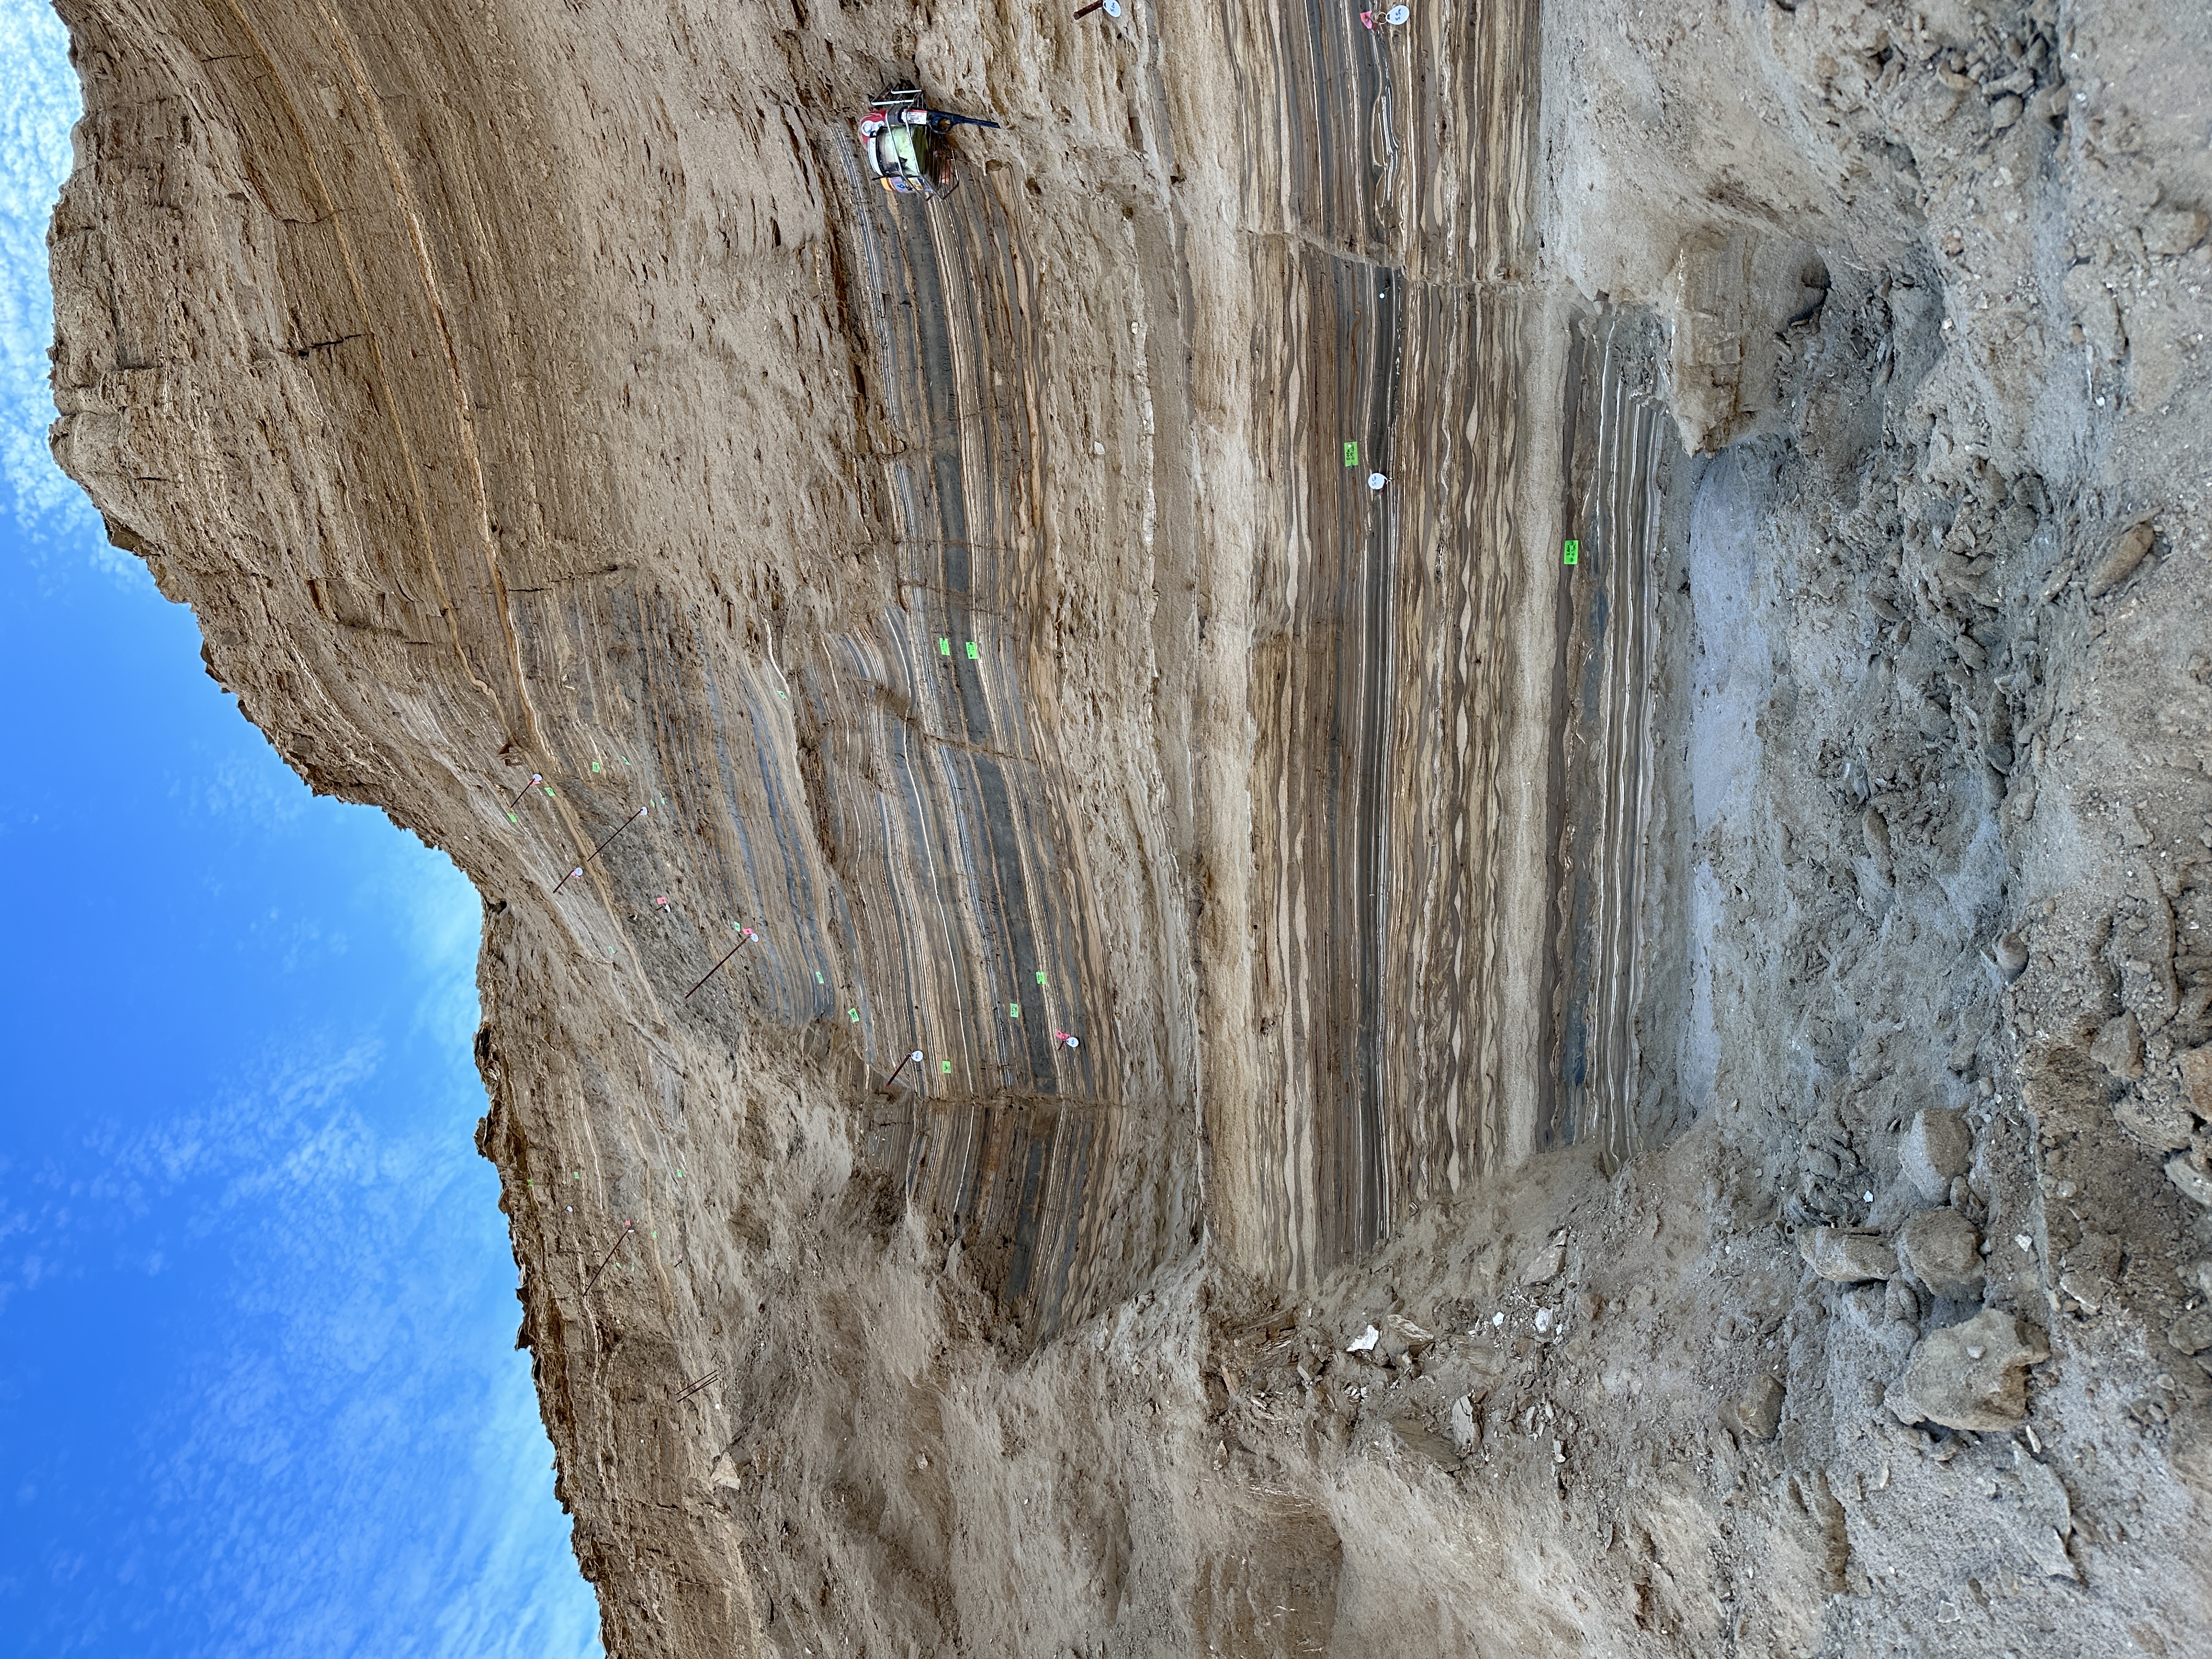
Click on Image for high resolution magnifiable image
Drone photos by Jefferson Williams 12 Feb. 2023
 Panorama of Site ZA-2 (South Wall)
Click on Image for high resolution magnifiable image
Drone photos by Jefferson Williams 13 Feb. 2023
 Panorama of Site ZA-2 (South Wall)
Click on Image for high resolution magnifiable image
Drone photos salvaged on iPhone by Jefferson Williams 22 Feb. 2023
 Panorama of Site ZA-3 (North Wall)
Click on Image for high resolution magnifiable image
Drone photos by Jefferson Williams 12 March 2023
 Panorama of Site ZA-3 (North Wall)
Click on Image for high resolution magnifiable image
Drone photos by Jefferson Williams 12 Feb. 2023
 Panorama of Site ZA-3 (North Wall)
Click on Image for high resolution magnifiable image
Drone photos by Jefferson Williams 13 Feb. 2023
 Panorama of Site ZA-3 (North Wall)
Click on Image for high resolution magnifiable image
Drone photos salvaged from iPhone by Jefferson Williams 22 Feb. 2023
- Lat N 31.33454°
- Long E 035.40615°
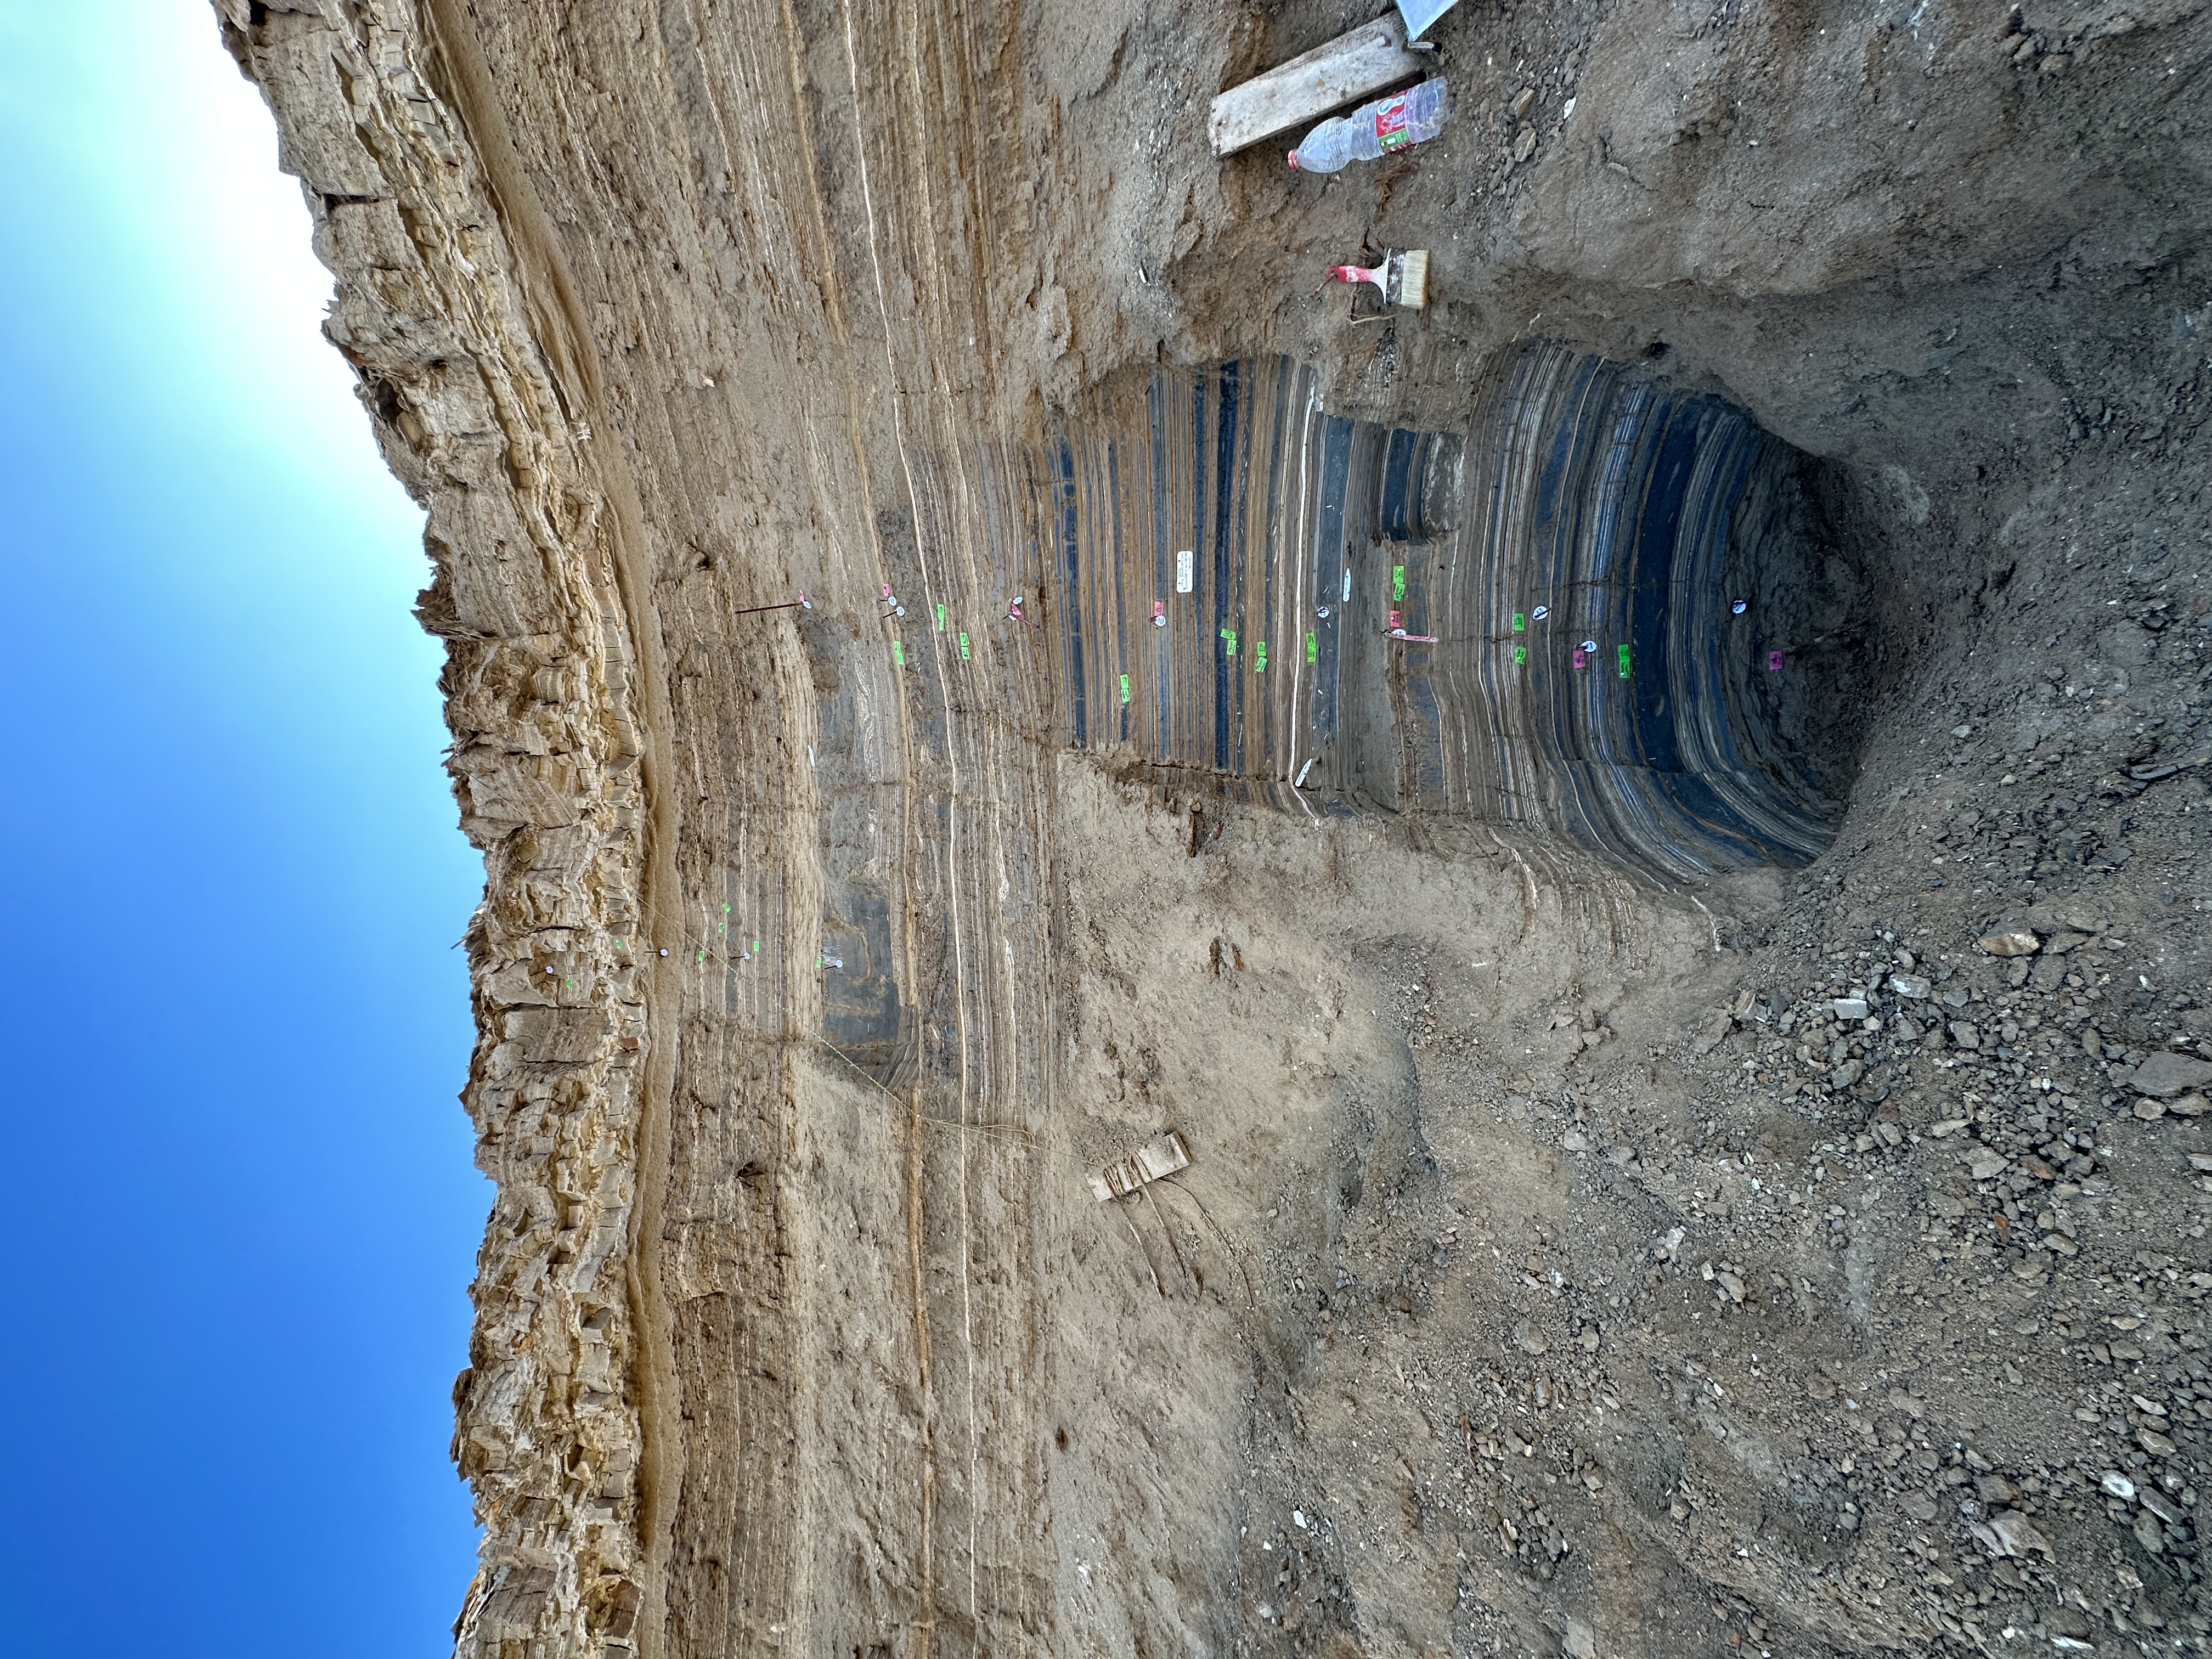
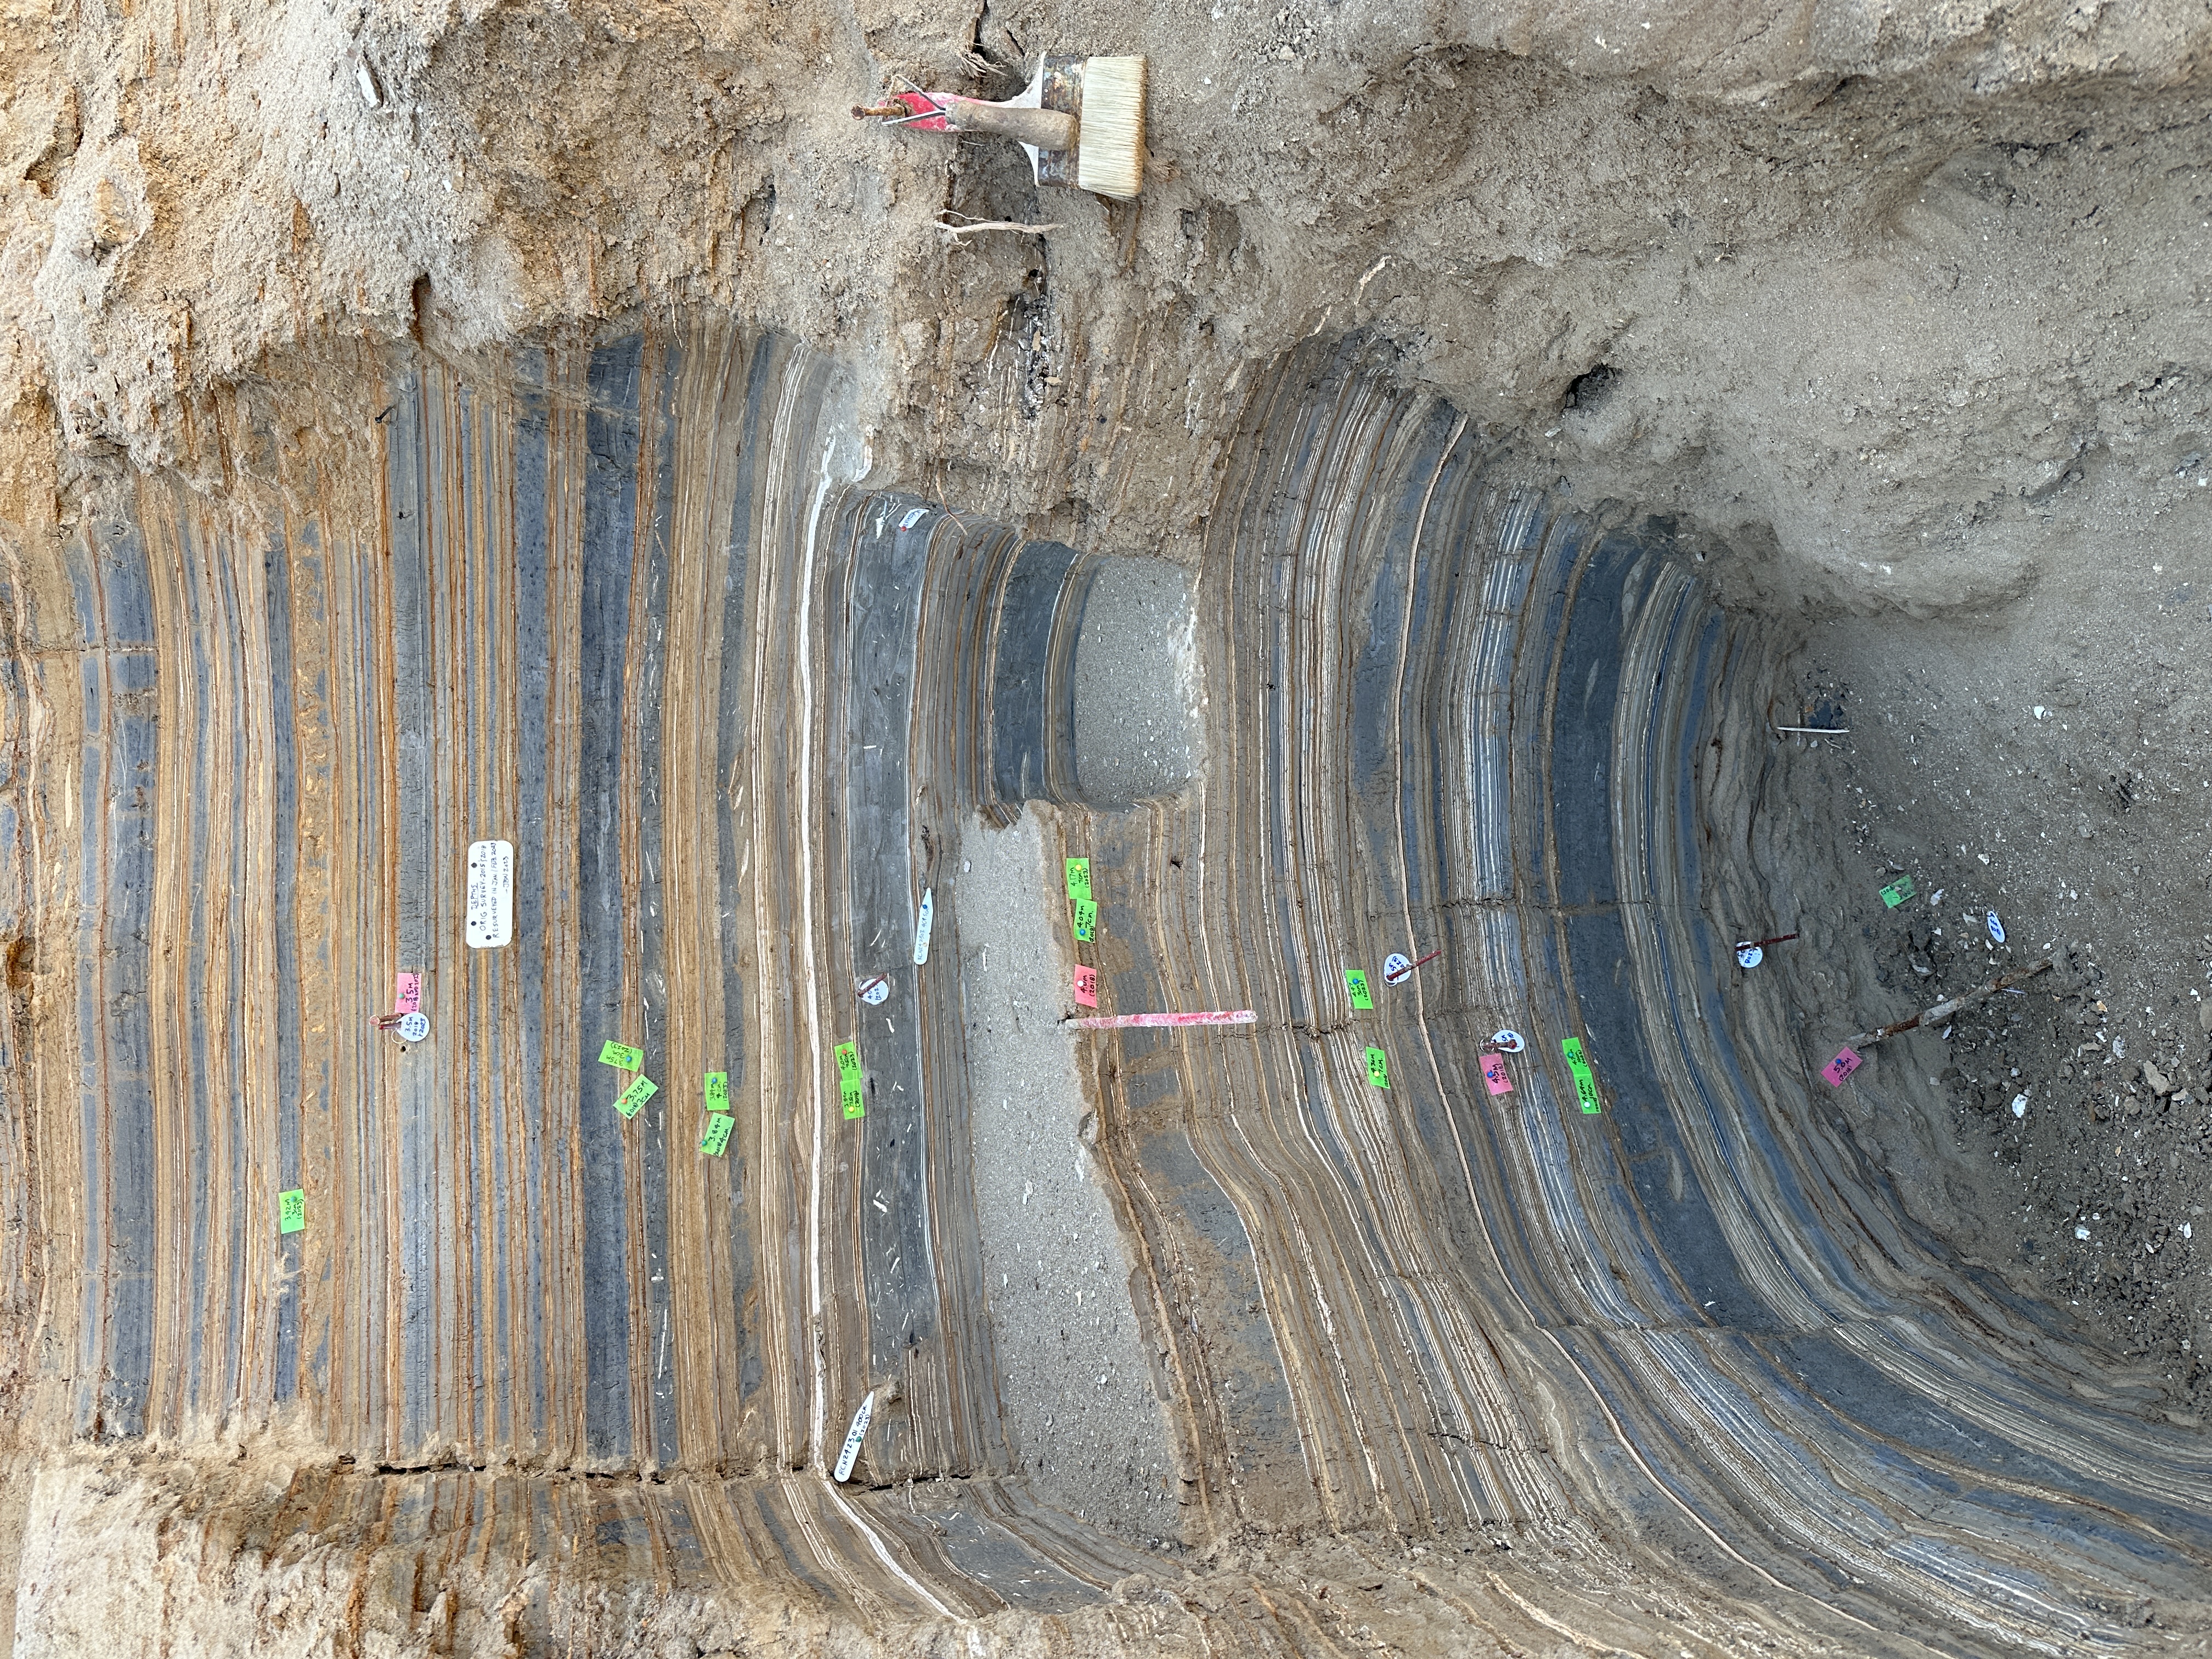
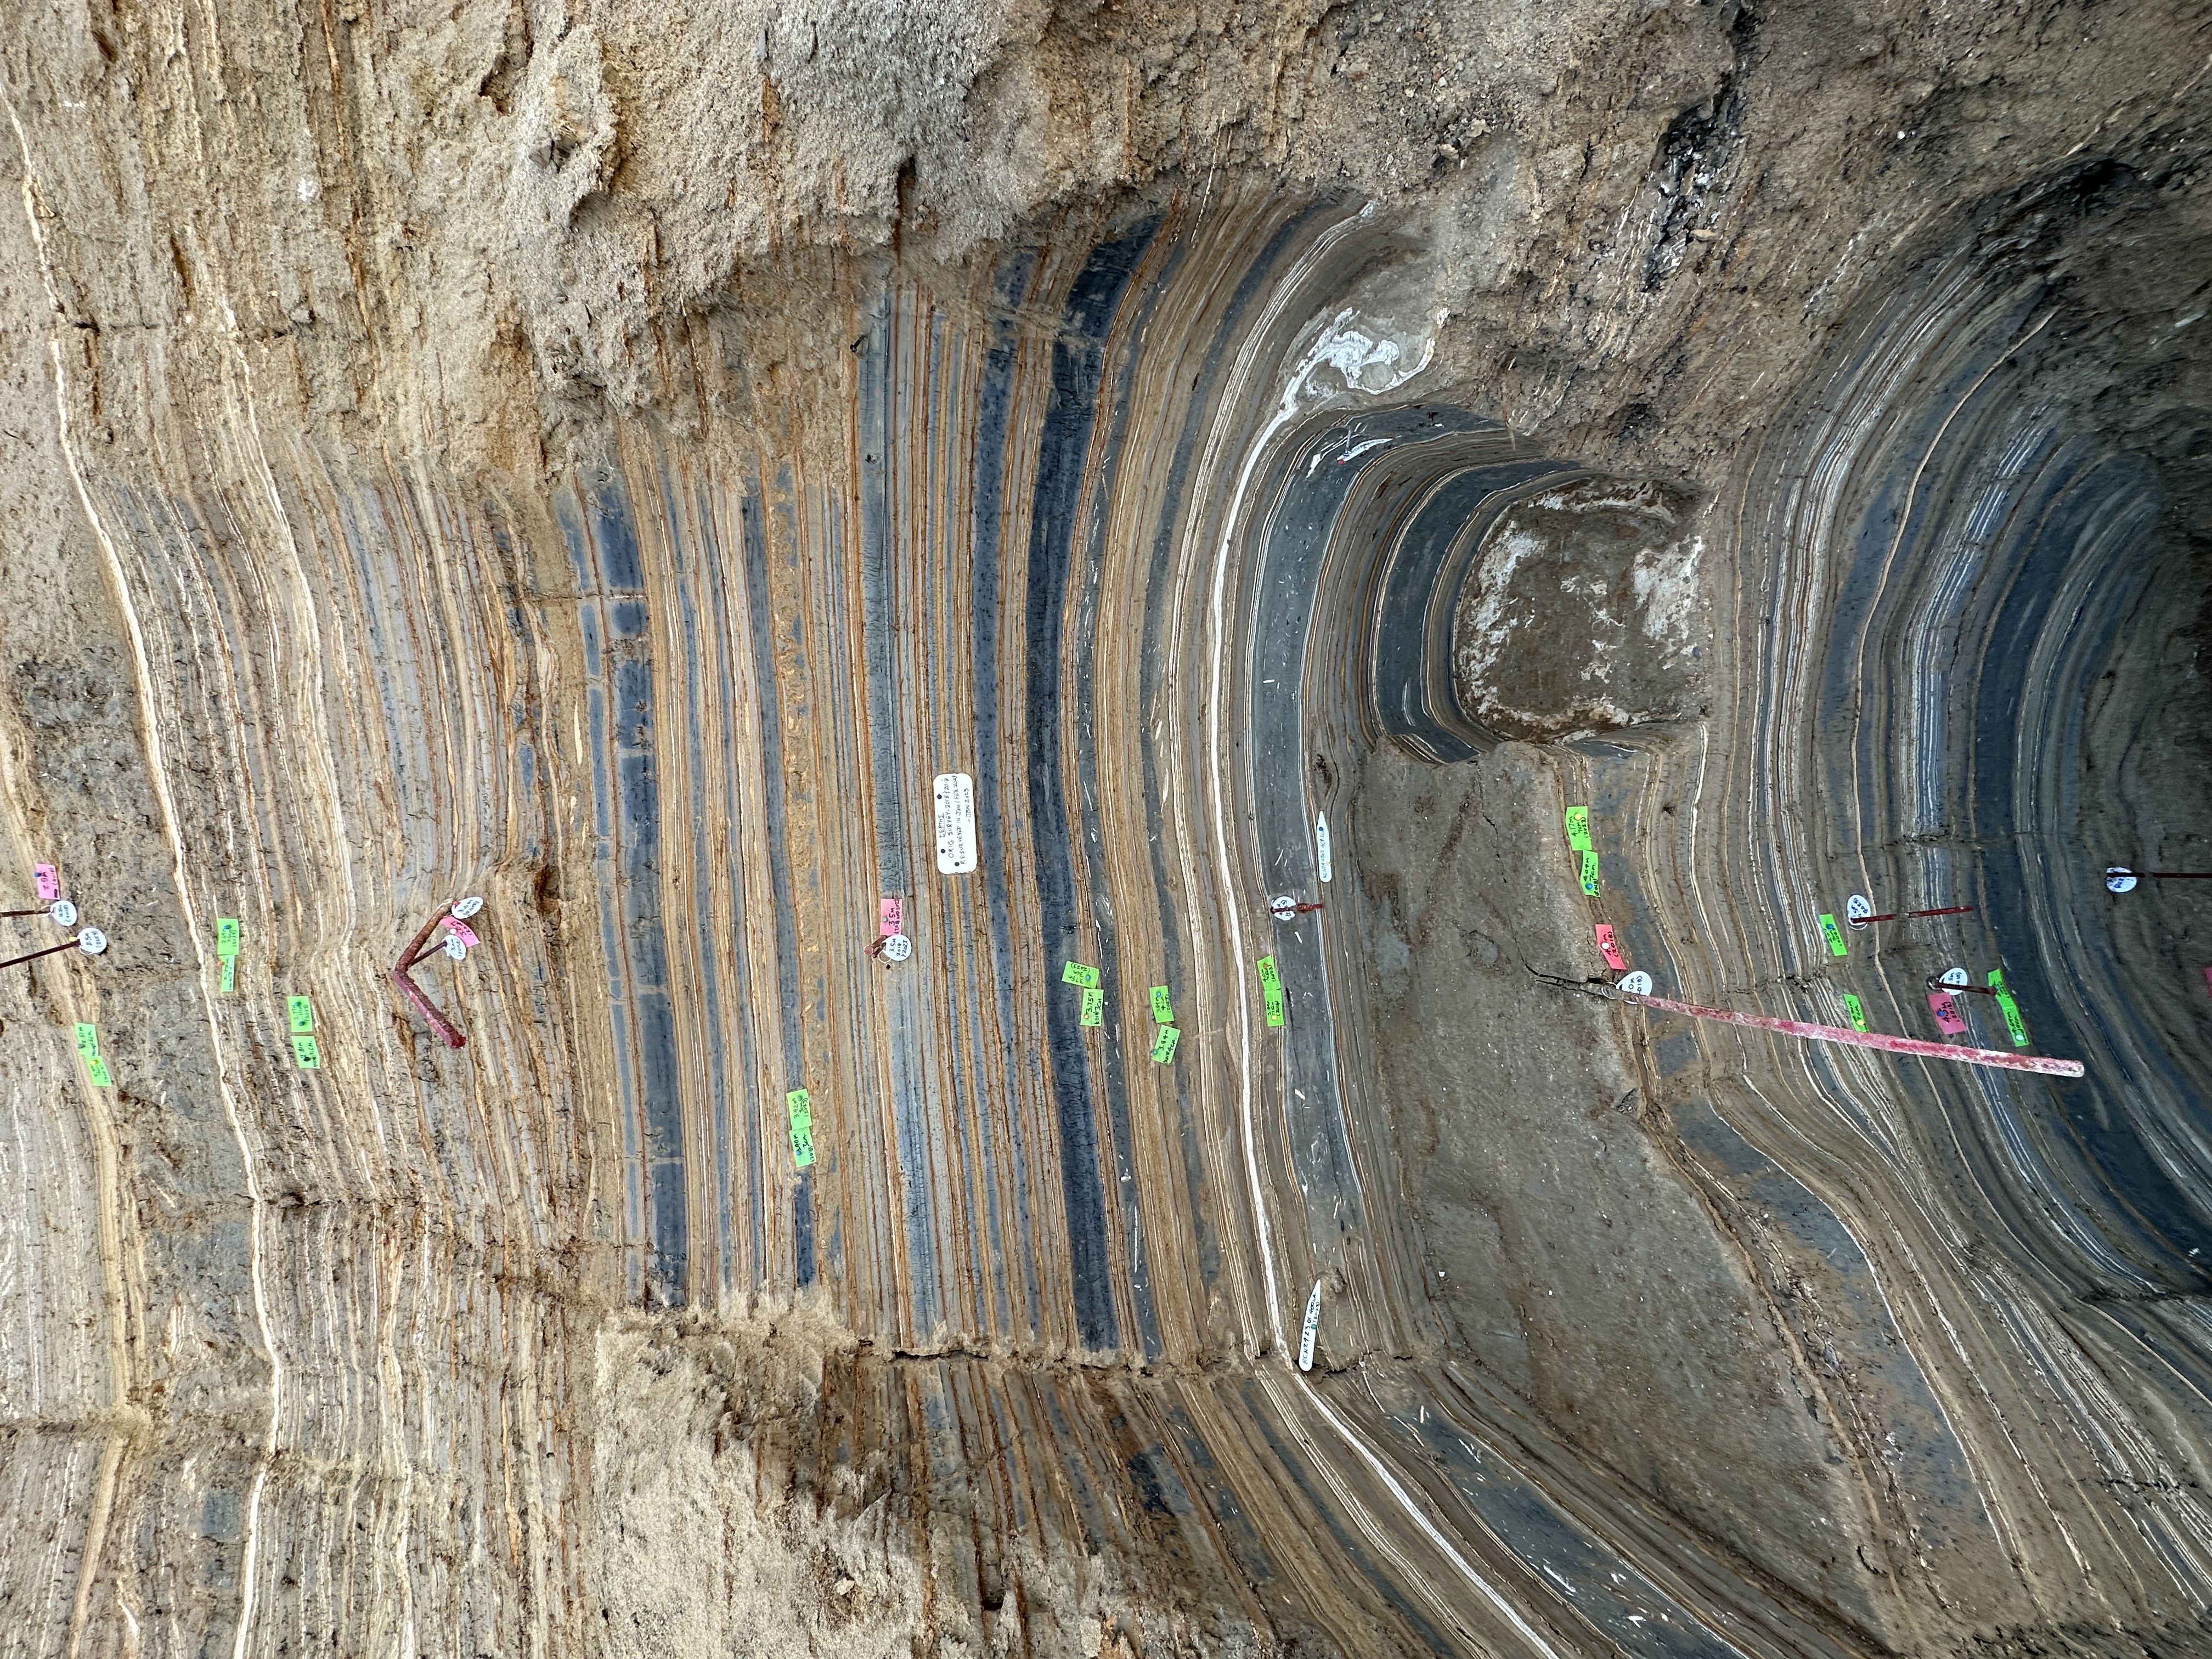
 Amos Quakes at site ZA-3 (North Wall)
- Lat N 31.33454°
- Long E 035.40615°
Click on Image for high resolution magnifiable image
Photos by Jefferson Williams 12 March 2023
- from Kagan et al. (2011)
- these have been incorporated into the Master Seismic Events Tables for all sites
Ze'elim and Ein Feshka Seismites with Model Ages and Historic Event Correlation
- LS, local source, moderate earthquake, not appearing in the historical catalogs, may have produced these seismites
- Gully depth below fan delta surface
- Seismite type
A, Intraclast breccia layer
B, Microbreccia (“homogenite” to the naked eye)
C, liquefied sand
D, Folded laminae
E, Small offsets
Q, Questionable as seismite. See Table 1 and Figure 2. - Model ages of seismites extrapolated from deposition model (see section 5 for details)
- Fit of historical earthquake dates within 1σ or 2σ calibrated age ranges of seismites. Although model ages are tabulated here with 1 year precision for convenience, event fit considers the realistic precision of 10 years (see section 5.1)
- All other possible events within the age probability range (1σ or 2σ range) of the designated earthquake; 1068a refers to March 1068 A.D., and 1068b refers to May 1068 A.D. (see Table A1)
- Outside model range, extrapolated from model (Figure 4)
- Outside model range, estimated based on below and above radiocarbon ages (Figure 4)
- Alternately, this historic earthquake could have formed seismites below or above the one marked
Kagan et al (2011)
- from Kagan et al. (2011) Correction
- these have been incorporated into the Master Seismic Events Tables for all sites
 Table 4
Multisite Comparison of Holocene Seismites from four lacustrine sediments sites along the Western Dead Sea Basin
Kagan et al (2011)
 Table 4
Multisite Comparison of Holocene Seismites from four lacustrine sediments sites along the Western Dead Sea Basin
Kagan et al (2011)
- from Kagan et al. (2011)
- these have been incorporated into the Master Seismic Events Tables for all sites
Table 4Multisite Comparison of Holocene Seismites from four lacustrine sediments sites along the Western Dead Sea Basin
Kagan et al (2011)
- from Kagan et al. (2011)
Figure 7Recurrence intervals and cumulative number of breccias in time.
- Ein Feshkha (EFE)
- Ein Gedi (EG)
- Zeelim (ZA1 and ZA2)
- Diamonds represent breccias
- circled diamonds are the IBS (intrabasin seismites)
- Horizontal gray bars indicate periods of seismic quiescence
(left) the earlier period is recorded at EG and ZA, and (right) the younger quiescence period is recorded at all three sites. Horizontal lines connect IBS events at the three sites.
Kagan et al (2011)
 Figure 4
Stratigraphic section of Ze’elim (ZA2) and (right) age-depth deposition model derived by OxCal 4.1. The top 7.5 m are modeled, while the bottom of the section is presented as single calibrated dates. Probability density functions (histograms) on the graph give model ages for radiocarbon samples (details are given in Table 3). The histograms give the distributions for the single calibrated dates while the darker center part of each histogram take into account the stratigraphic information (see Bronk Ramsey [2008] for model specifics). The depth model curves are envelopes for the 95% (outer, lighter, approximately 2σ) and 68% (inner, darker, approximately 1σ) highest probability density ranges. The dashed line near the top is the extrapolation of the model upward, while the ellipse represents the uppermost seismite.
Kagan et al (2011)
 Figure 3.1.5
Correlation of historic earthquakes to age-depth model.
Ze' elim Gully outcrop.
Squares indicate historic earthquake ages correlated to ages of seismites. Some historic earthquake dates are shown.
Kagan (2011)
 Figure 3
ZA-3 outcrop section with main archaeological periods and elevations.
Kagan et al (2015)
- JW: This is north of ZA-3
 Fig. 1.2a
Gullies of the Zeʾelim fan delta cut into terraces created by the recession of the Dead Sea (Google Earth); the red circle marks the sampling location
Langgut and Finkelstein (2023)
 Fig. 1.2b
The Zeʾelim sediment section where we conducted our palynological and sedimentological investigations, with main archaeological periods and elevations; presented in meters below msl
(photo: Dafna Langgut)
Langgut and Finkelstein (2023)
- from Kagan et al. (2011)
 Figure 8
Photograph of liquefaction structure >1 m thick at Ze’elim Gully, correlative to the 1927 earthquake at the northern Dead Sea.
click on image to open in a new tab
Kagan et al. (2011
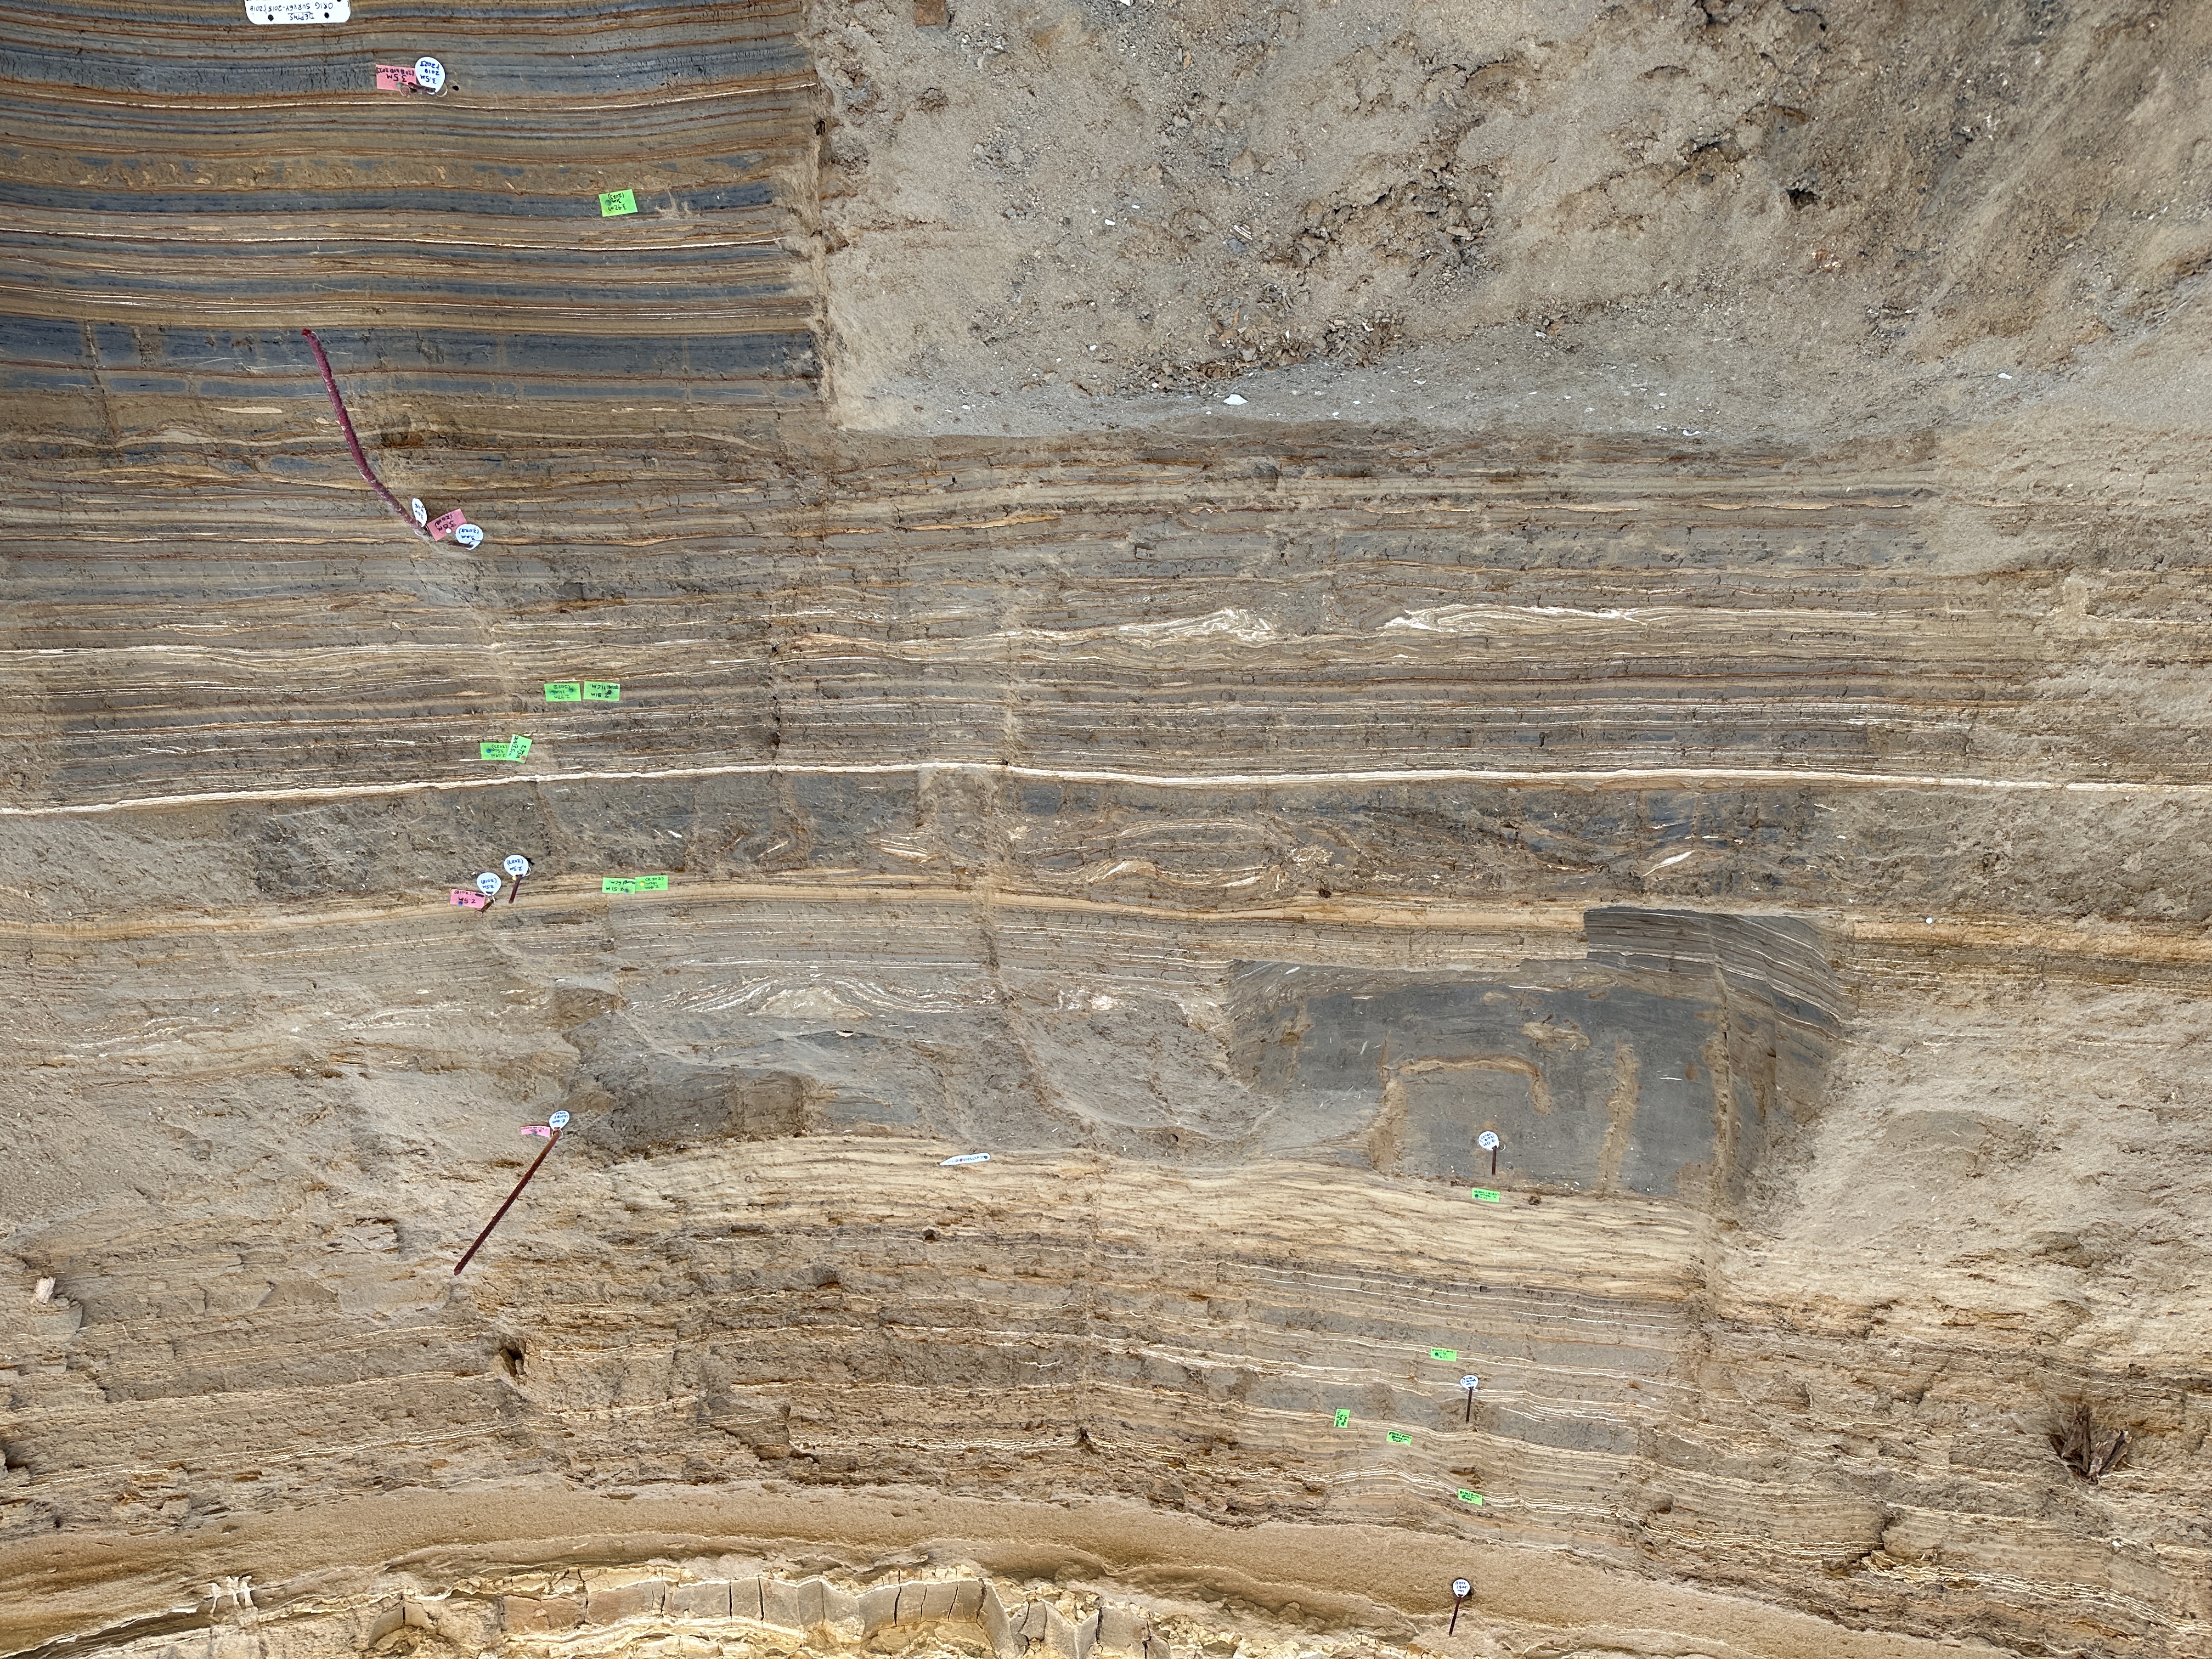
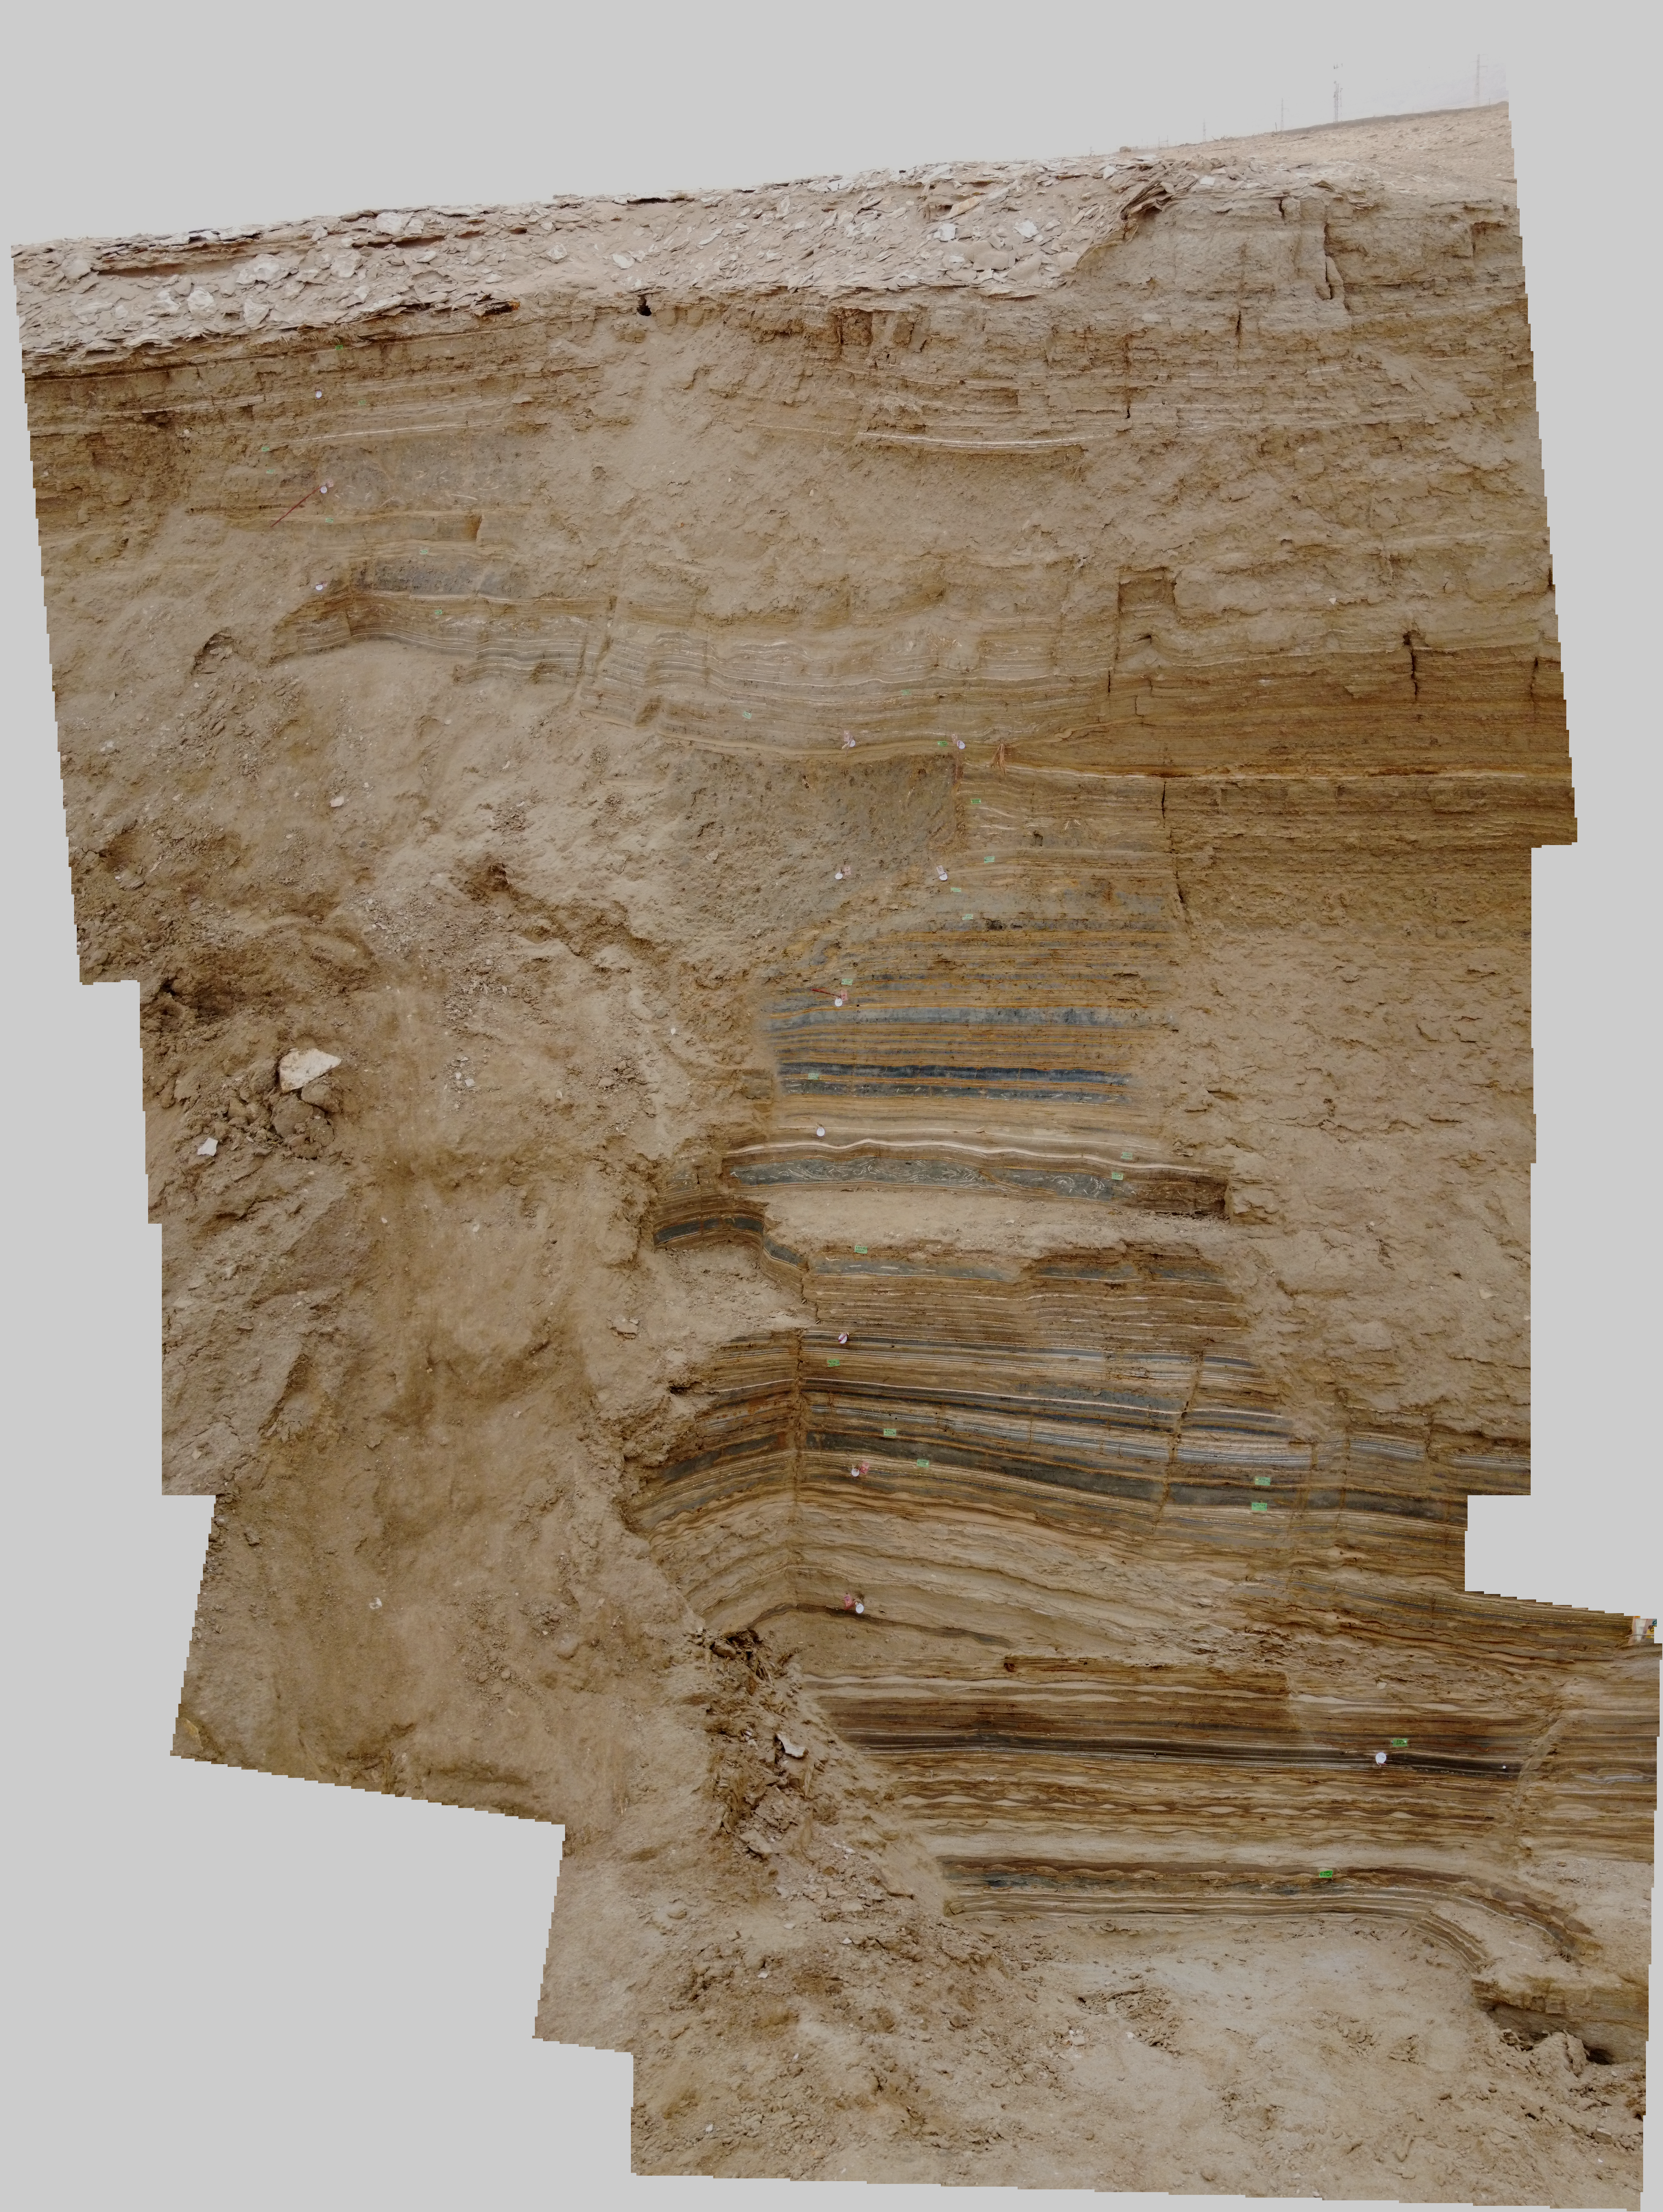
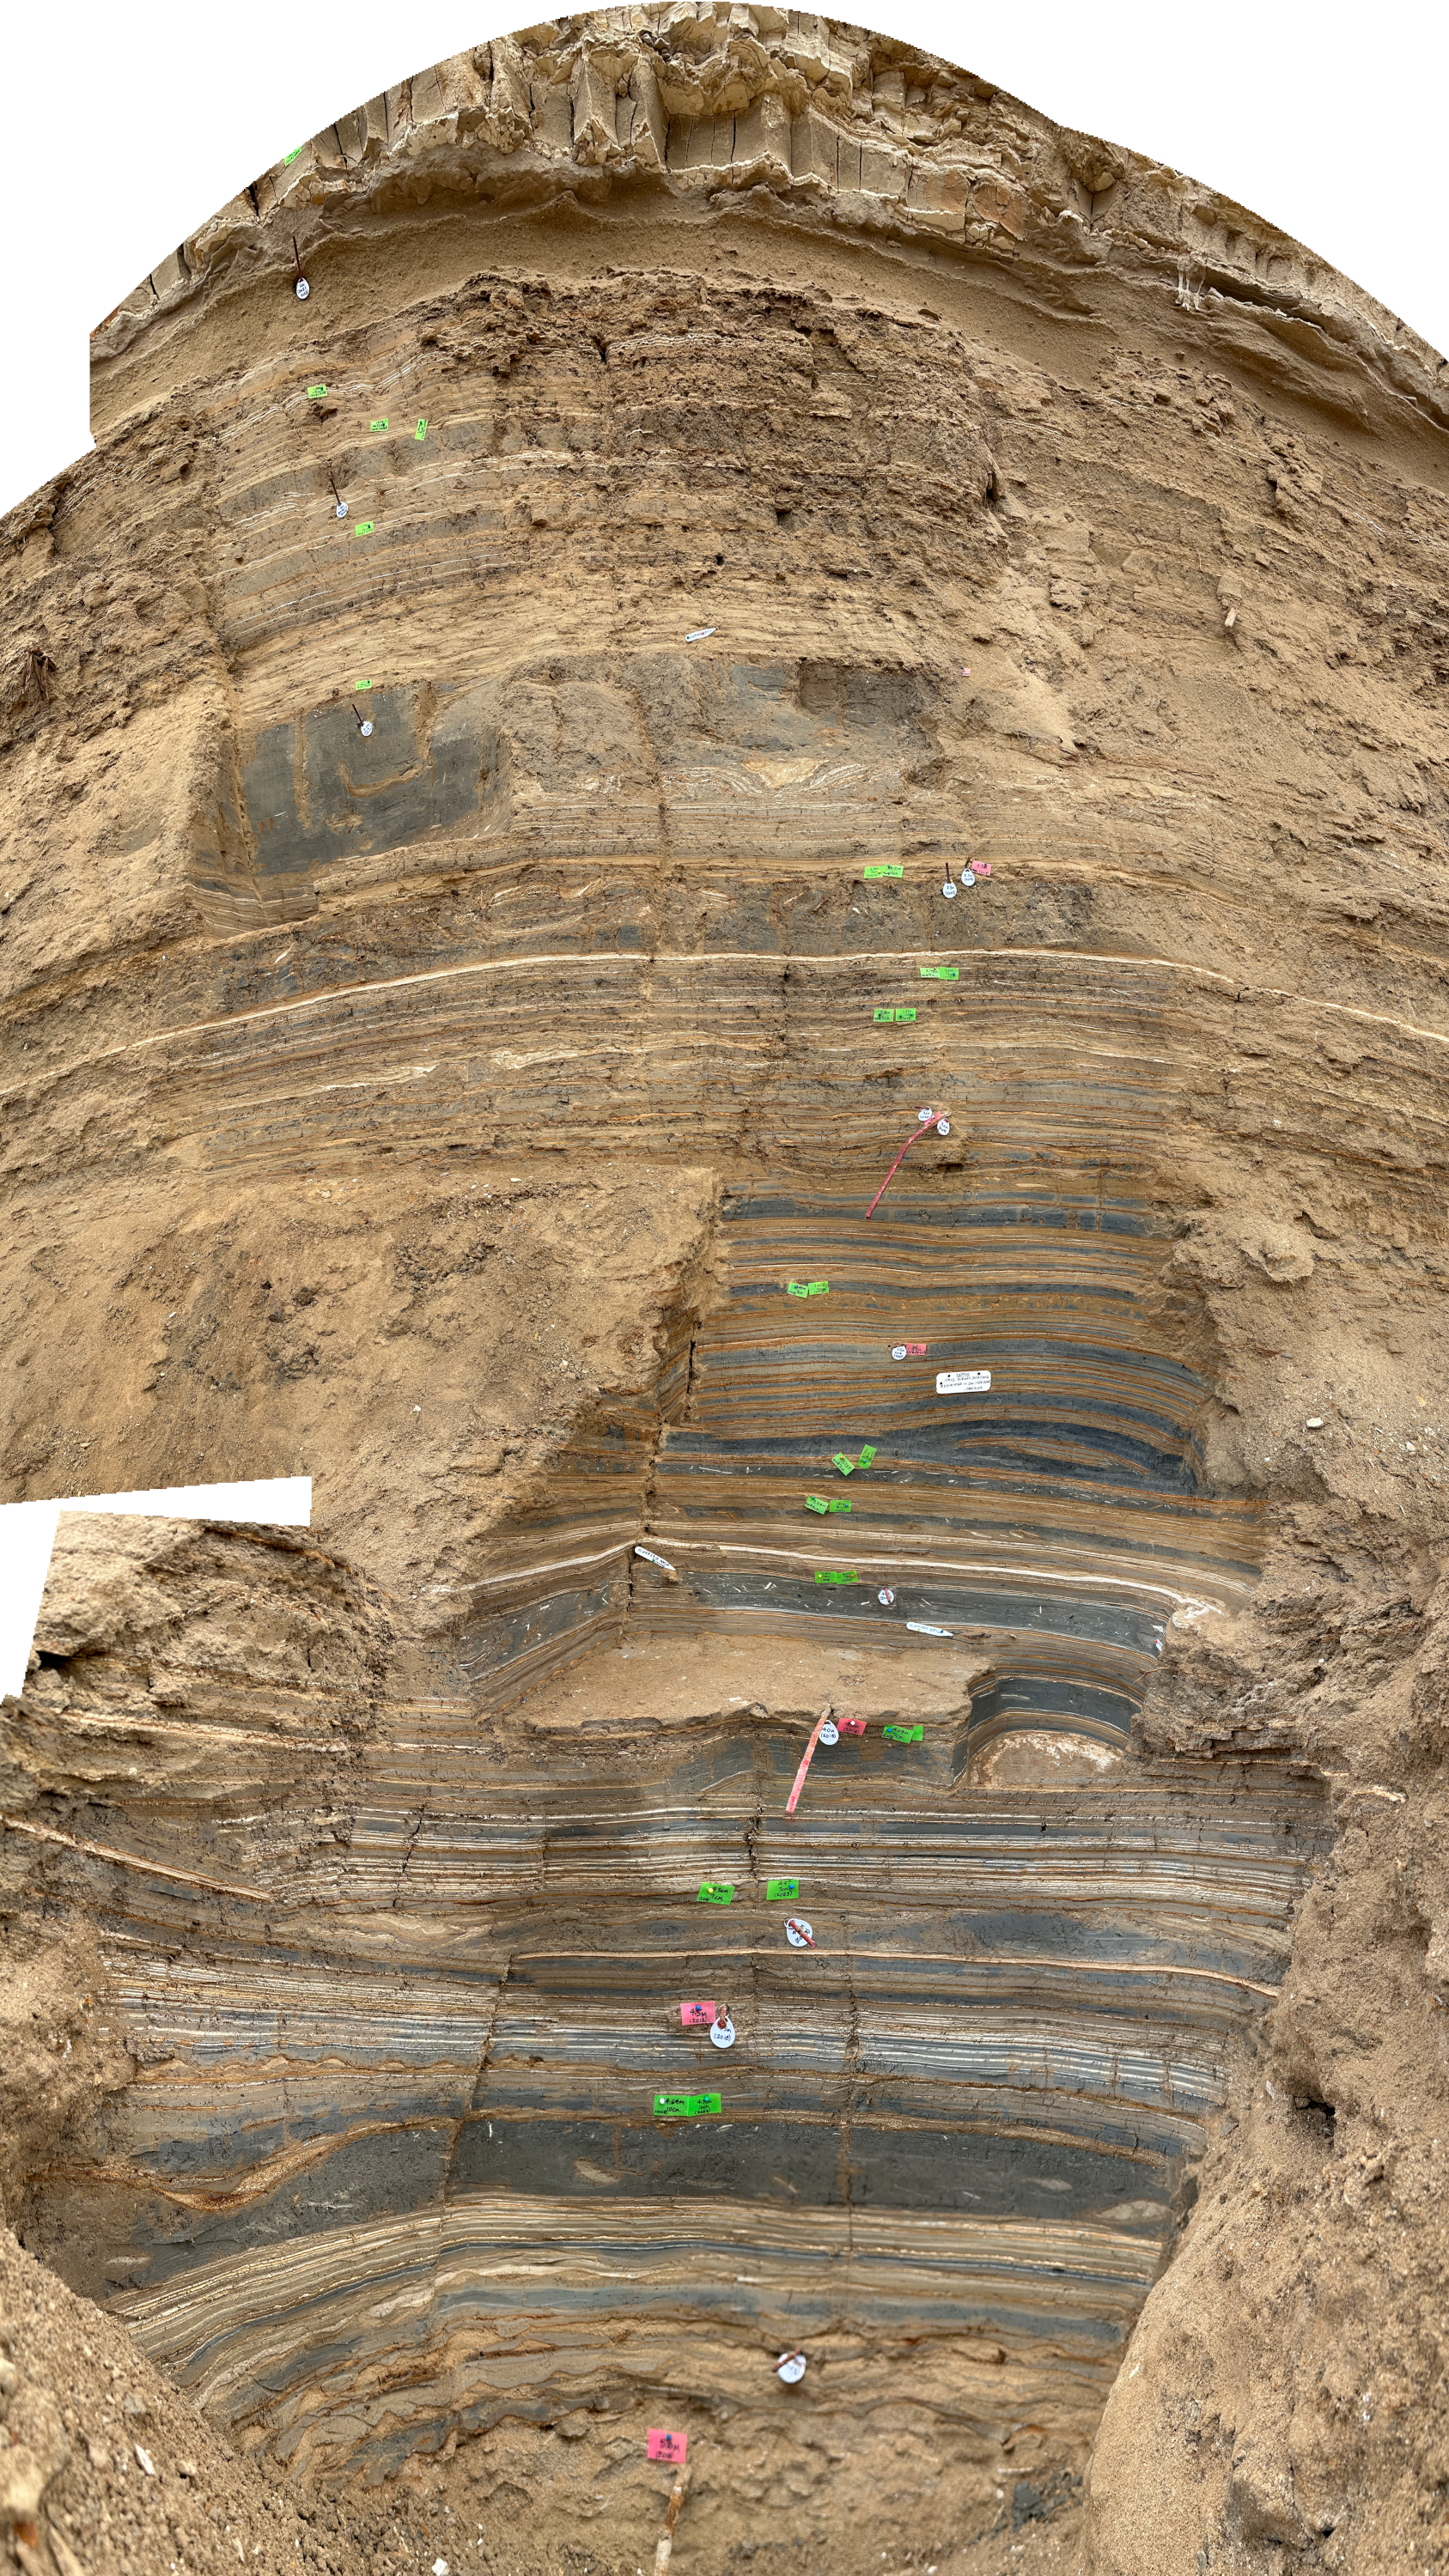
 ZA-4 - Exposed Sections Labeled by Name
Click on Image for high resolution magnifiable image
Photos by Jefferson Williams in 2015
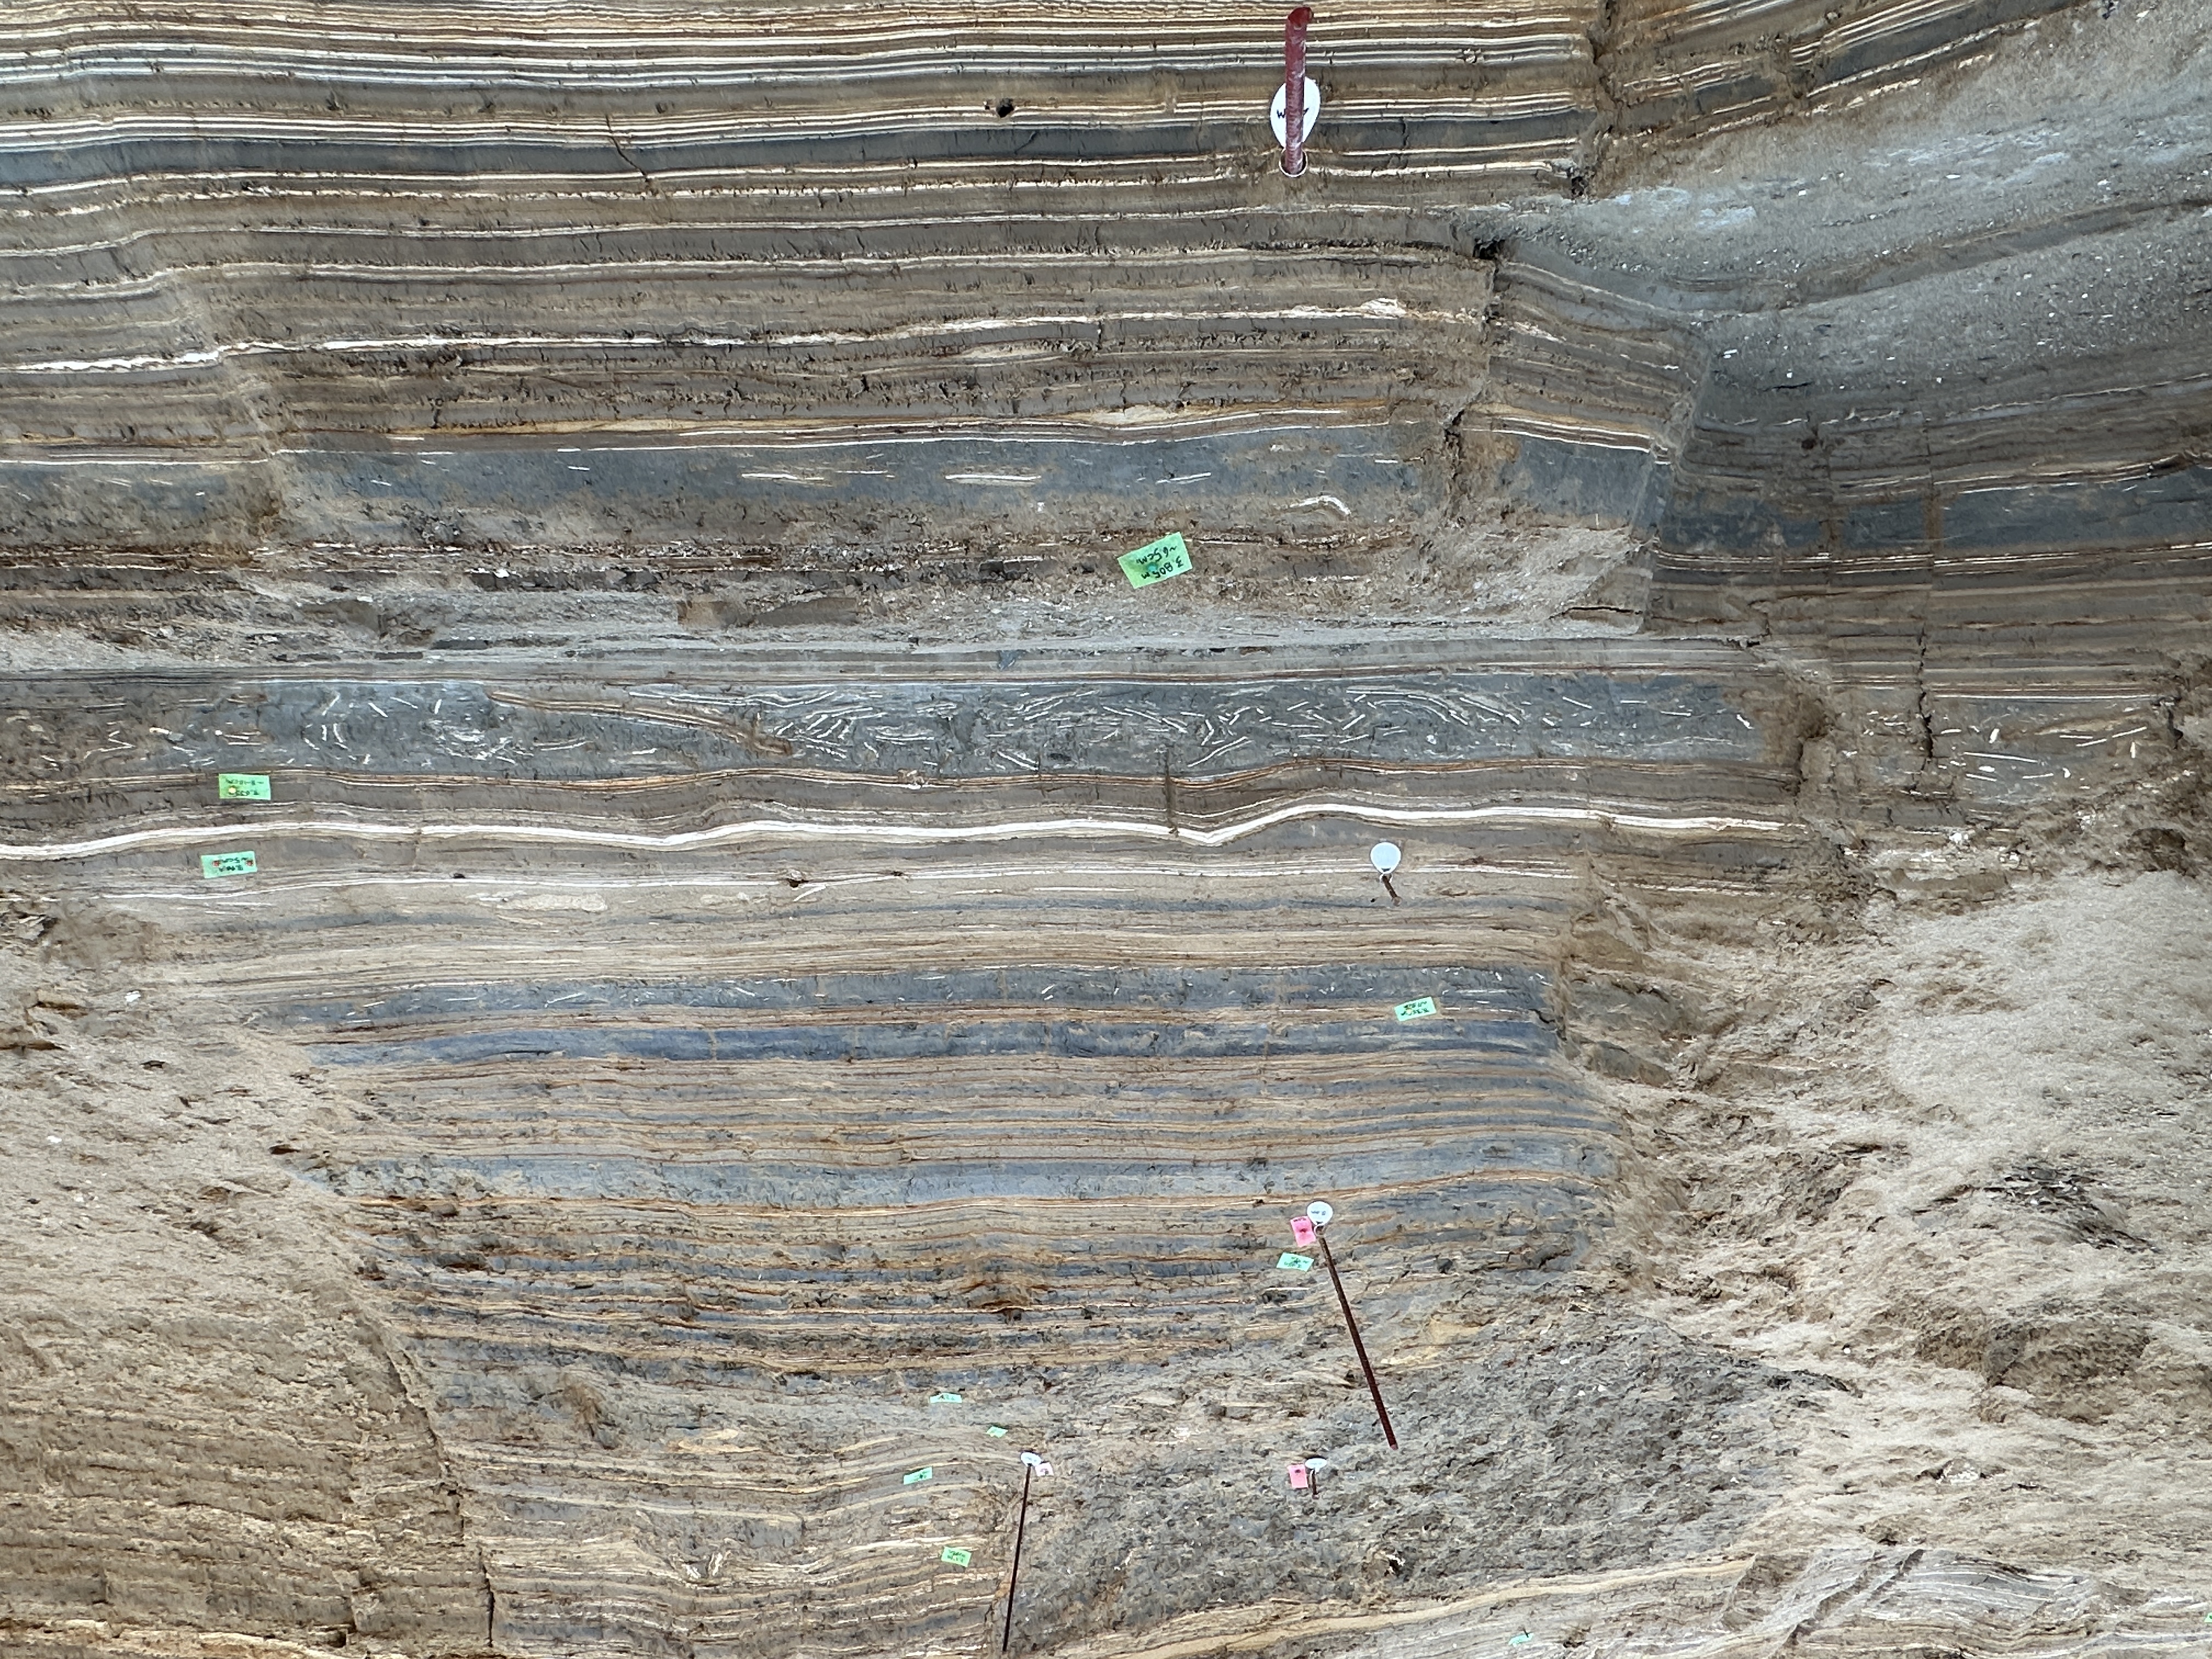
 ZA-4 - Exposed Bottom Left (Deeper) Sections Labeled by Letter
Click on Image for high resolution magnifiable image
Photos by Jefferson Williams in 2015
 ZA-4 - exposed sections outlined in pink
Click on Image for high resolution magnifiable image
Photos by Jefferson Williams in 2015
 Top Right Section - Vertical Mosaic - 0 - 210 cm.
Click on Image for high resolution magnifiable image
Photos by Jefferson Williams in 2015
 Middle Section - Top
Click on Image for high resolution magnifiable image
Photos by Jefferson Williams in 2015
 Middle Section - Bottom
Click on Image for high resolution magnifiable image
Photos by Jefferson Williams in 2015
 Bottom Left Section A
Click on Image for high resolution magnifiable image
Photos by Jefferson Williams in 2015
 Bottom Left Section B - top
Click on Image for high resolution magnifiable image
Photos by Jefferson Williams in 2015
 Bottom Left Section B - bottom
Click on Image for high resolution magnifiable image
Photos by Jefferson Williams in 2015
 Bottom Left Section C
Click on Image for high resolution magnifiable image
Photos by Jefferson Williams in 2015
 Bottom Left Section D - Top
Click on Image for high resolution magnifiable image
Photos by Jefferson Williams in 2015
 Bottom Left Section D - Middle
Click on Image for high resolution magnifiable image
Photos by Jefferson Williams in 2015
 Bottom Left Section D - Bottom
Click on Image for high resolution magnifiable image
Photos by Jefferson Williams in 2015
 Bottom Left Section E
Click on Image for high resolution magnifiable image
Photos by Jefferson Williams in 2015
 Bottom Left Section F - Top
Click on Image for high resolution magnifiable image
Photos by Jefferson Williams in 2015
 Bottom Left Section F - Middle
Click on Image for high resolution magnifiable image
Photos by Jefferson Williams in 2015
 Bottom Left Section F - Bottom
Click on Image for high resolution magnifiable image
Photos by Jefferson Williams in 2015
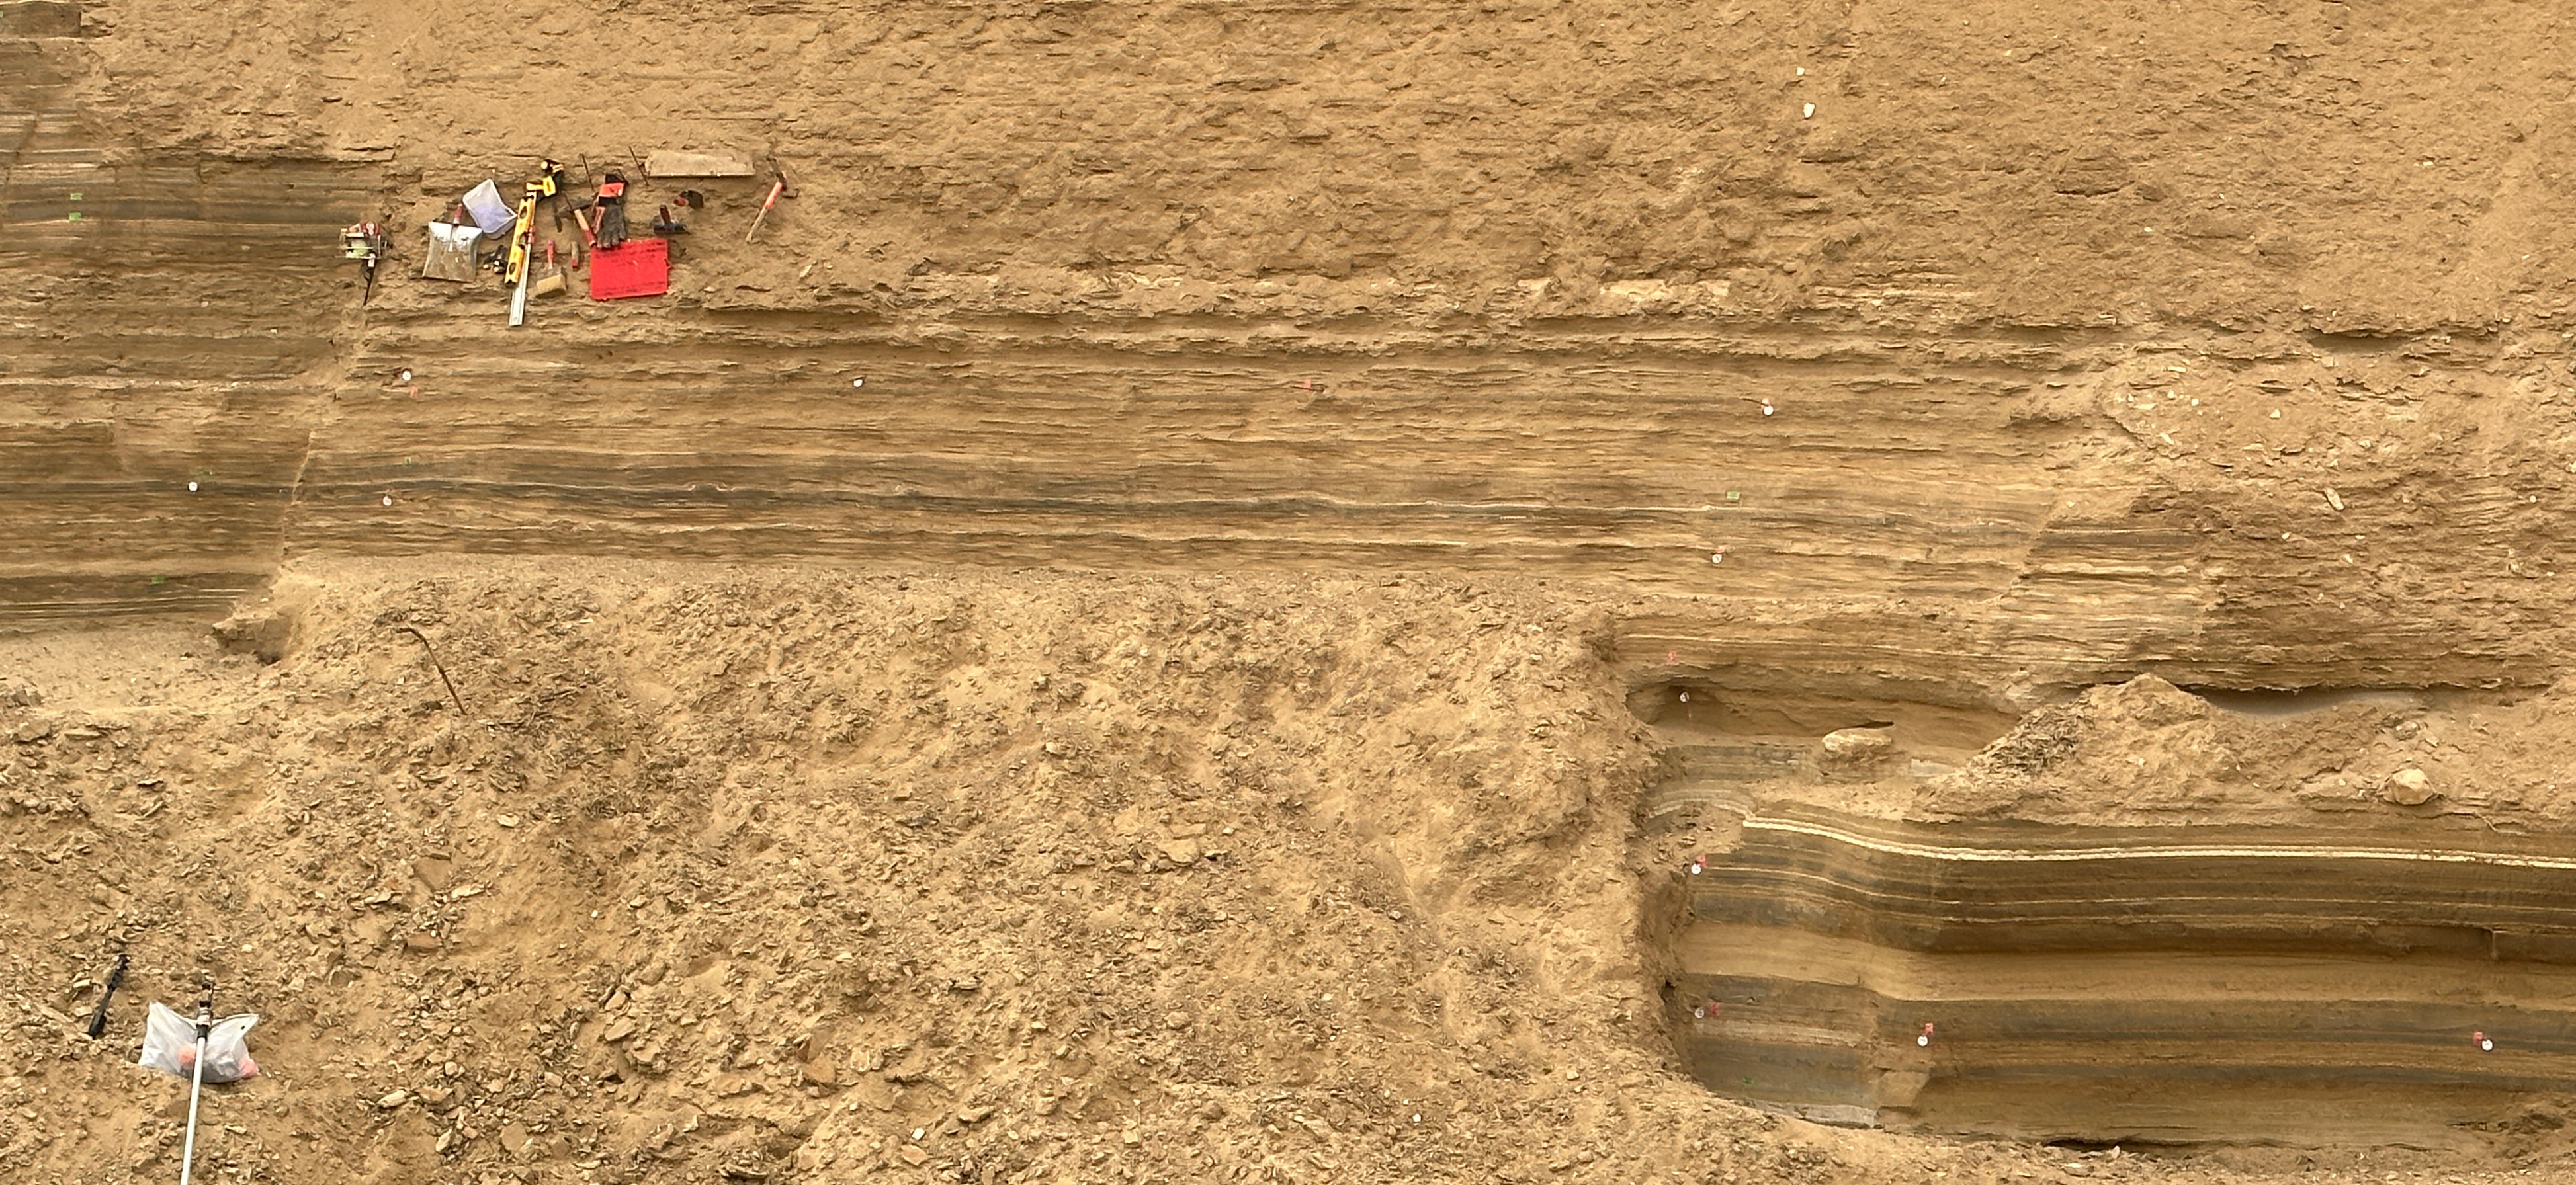
 Middle Section
Click on Image for high resolution magnifiable image
Photo by Jefferson Williams in 2018
 Middle Section
Click on Image for high resolution magnifiable image
Photo by Jefferson Williams in 2018
 Panorama of Site ZA-4
Click on Image for high resolution magnifiable image
Drone photos by Jefferson Williams 04 Feb. 2023
 Orthophoto of Site ZA-4
Click on Image for high resolution magnifiable image
Drone photos by Jefferson Williams 03 Feb. 2023
| Description | Image | Source |
|---|---|---|
| Eastern Section Above Beach Ridge |
 Eastern Section Above Beach Ridge at Site ZA-4
Photo by Jefferson Williams 10 Feb. 2023 |
Jefferson Williams |
| Eastern Section Below Beach Ridge Long Shot - Cleaned |
 Eastern Section Below Beach Ridge at Site ZA-4
Long Shot Cleaned Photo by Jefferson Williams 10 Feb. 2023 |
Jefferson Williams |
| Eastern Section Below Beach Ridge Long Shot Less Clean but with Rulers and Scale |
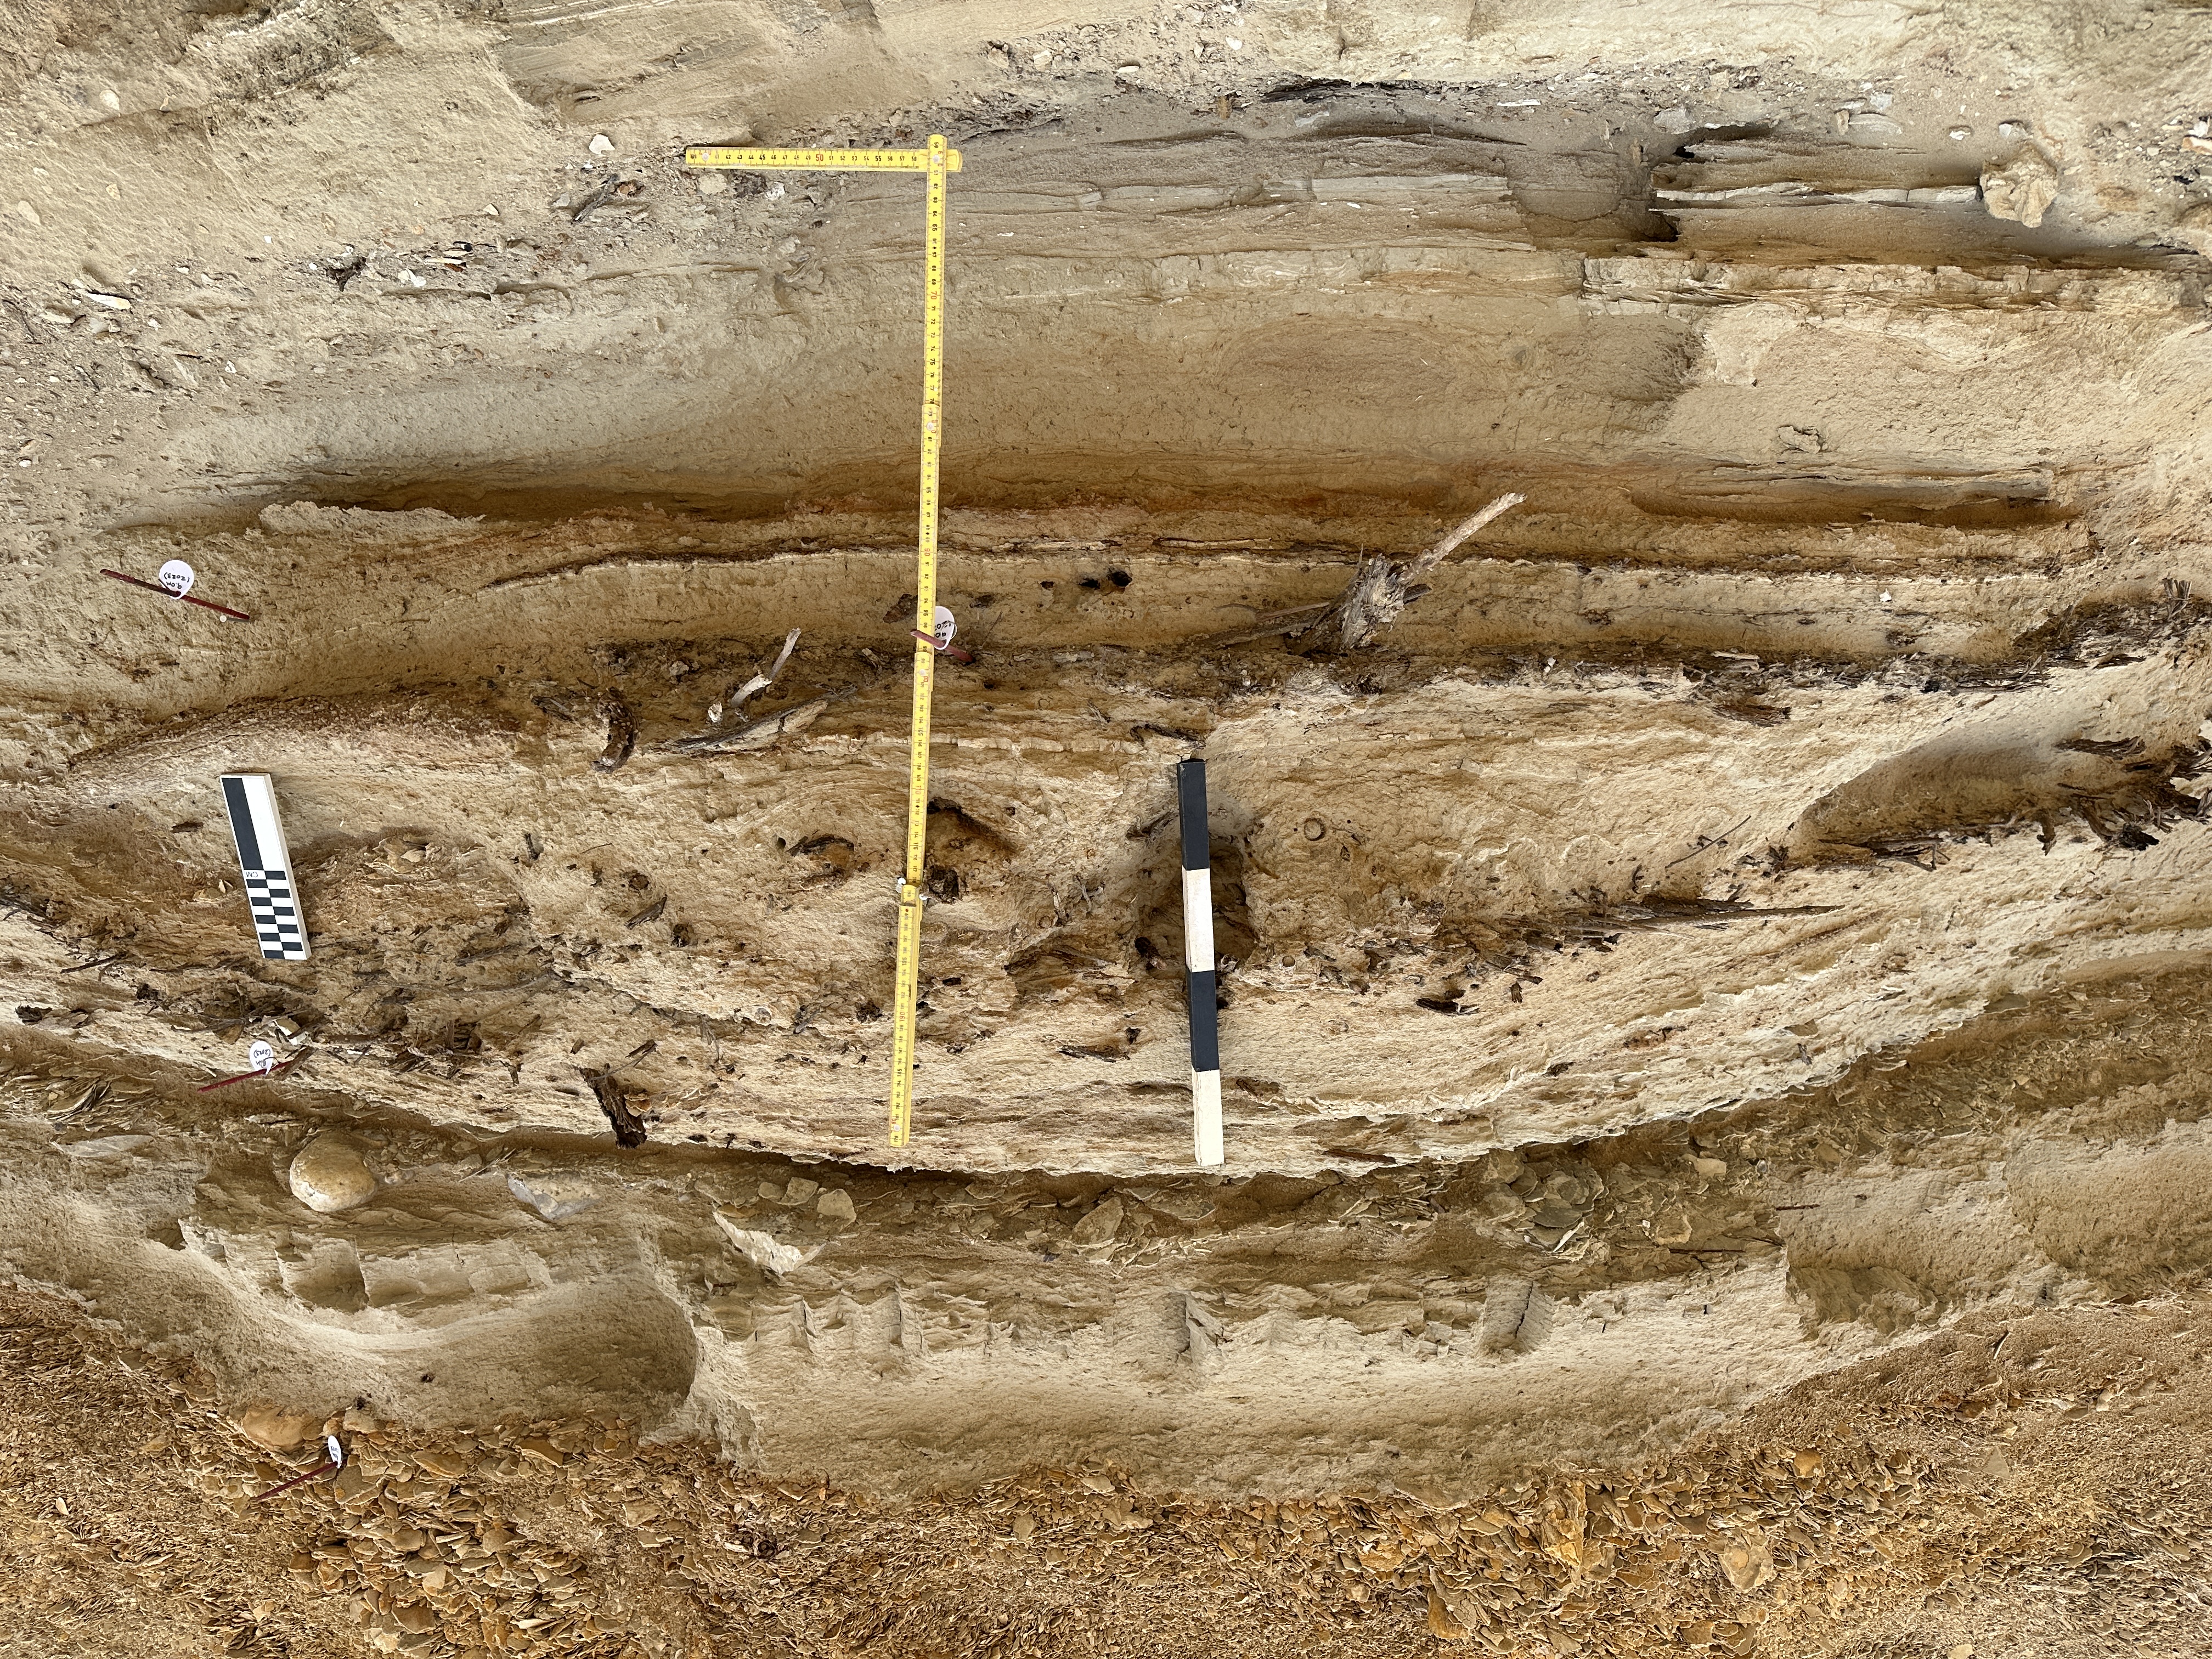
 Eastern Section Below Beach Ridge at Site ZA-4
Long Shot Less clean but with rulers and scales Photo by Jefferson Williams 14 Feb. 2023 |
Jefferson Williams |
| Eastern Section Below Beach Ridge Medium Shot Less Clean but with Rulers and Scale |
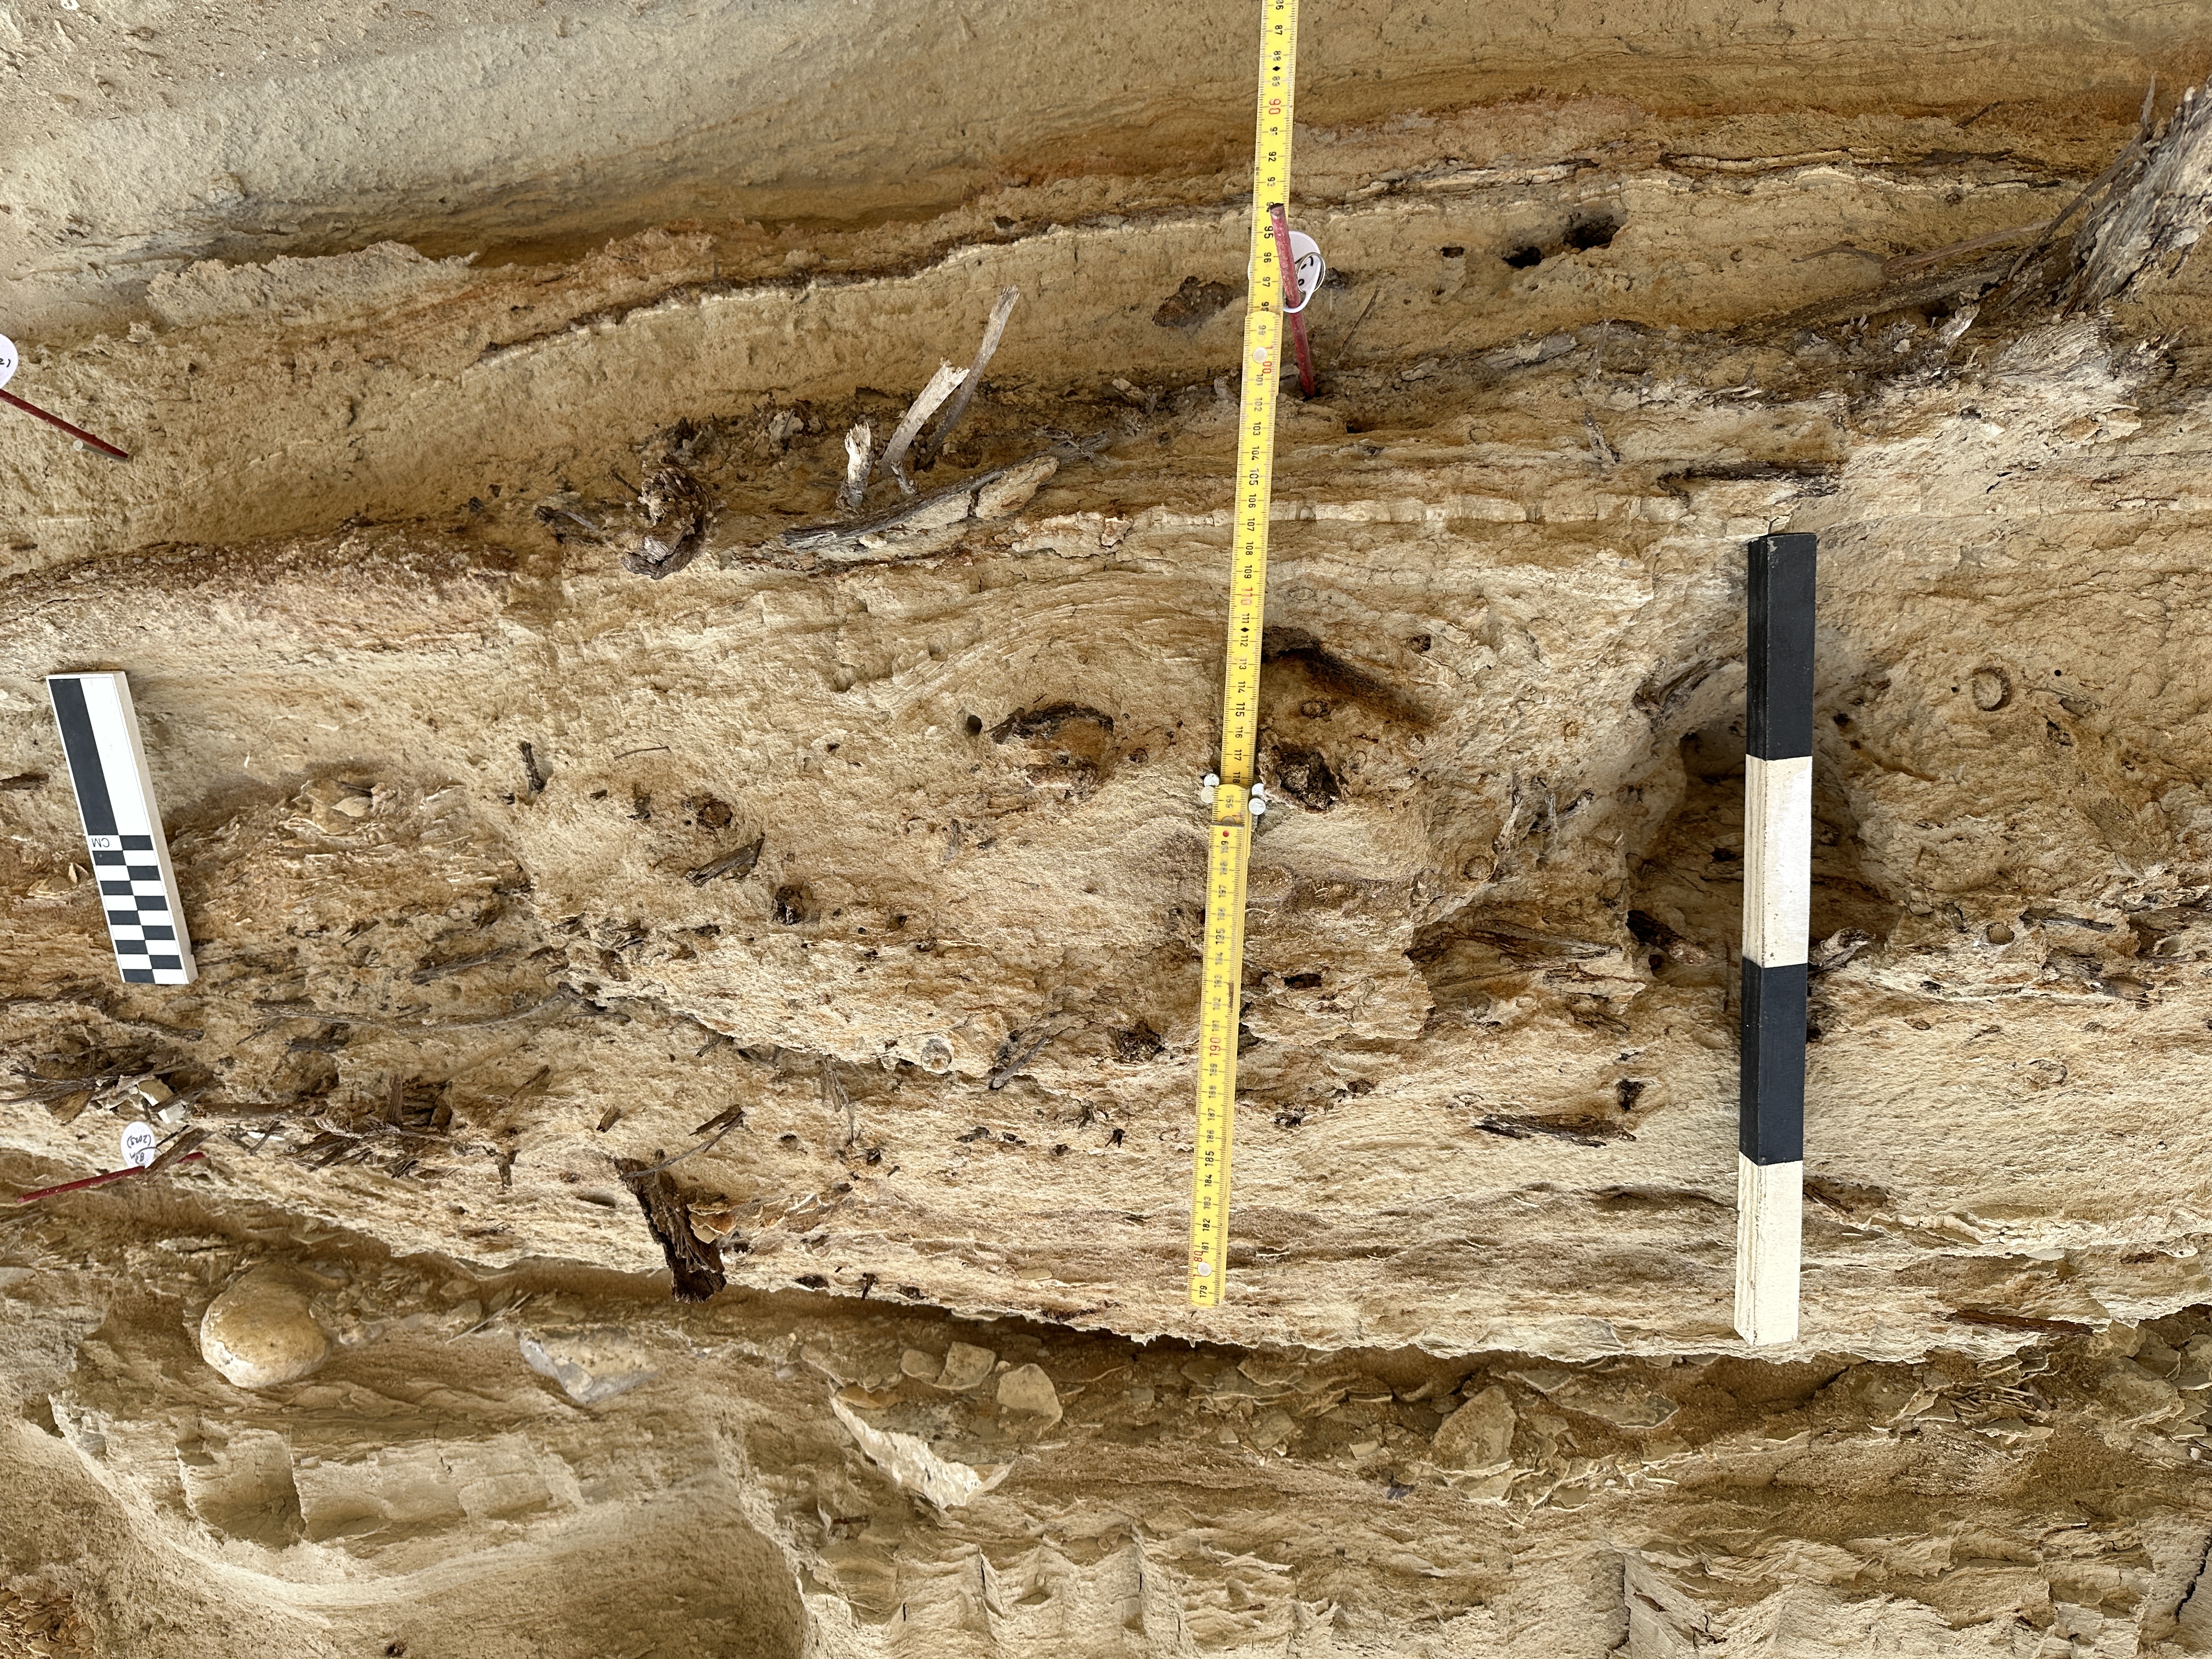
 Eastern Section Below Beach Ridge at Site ZA-4
Medium Shot Less clean but with rulers and scales Photo by Jefferson Williams 14 Feb. 2023 |
Jefferson Williams |
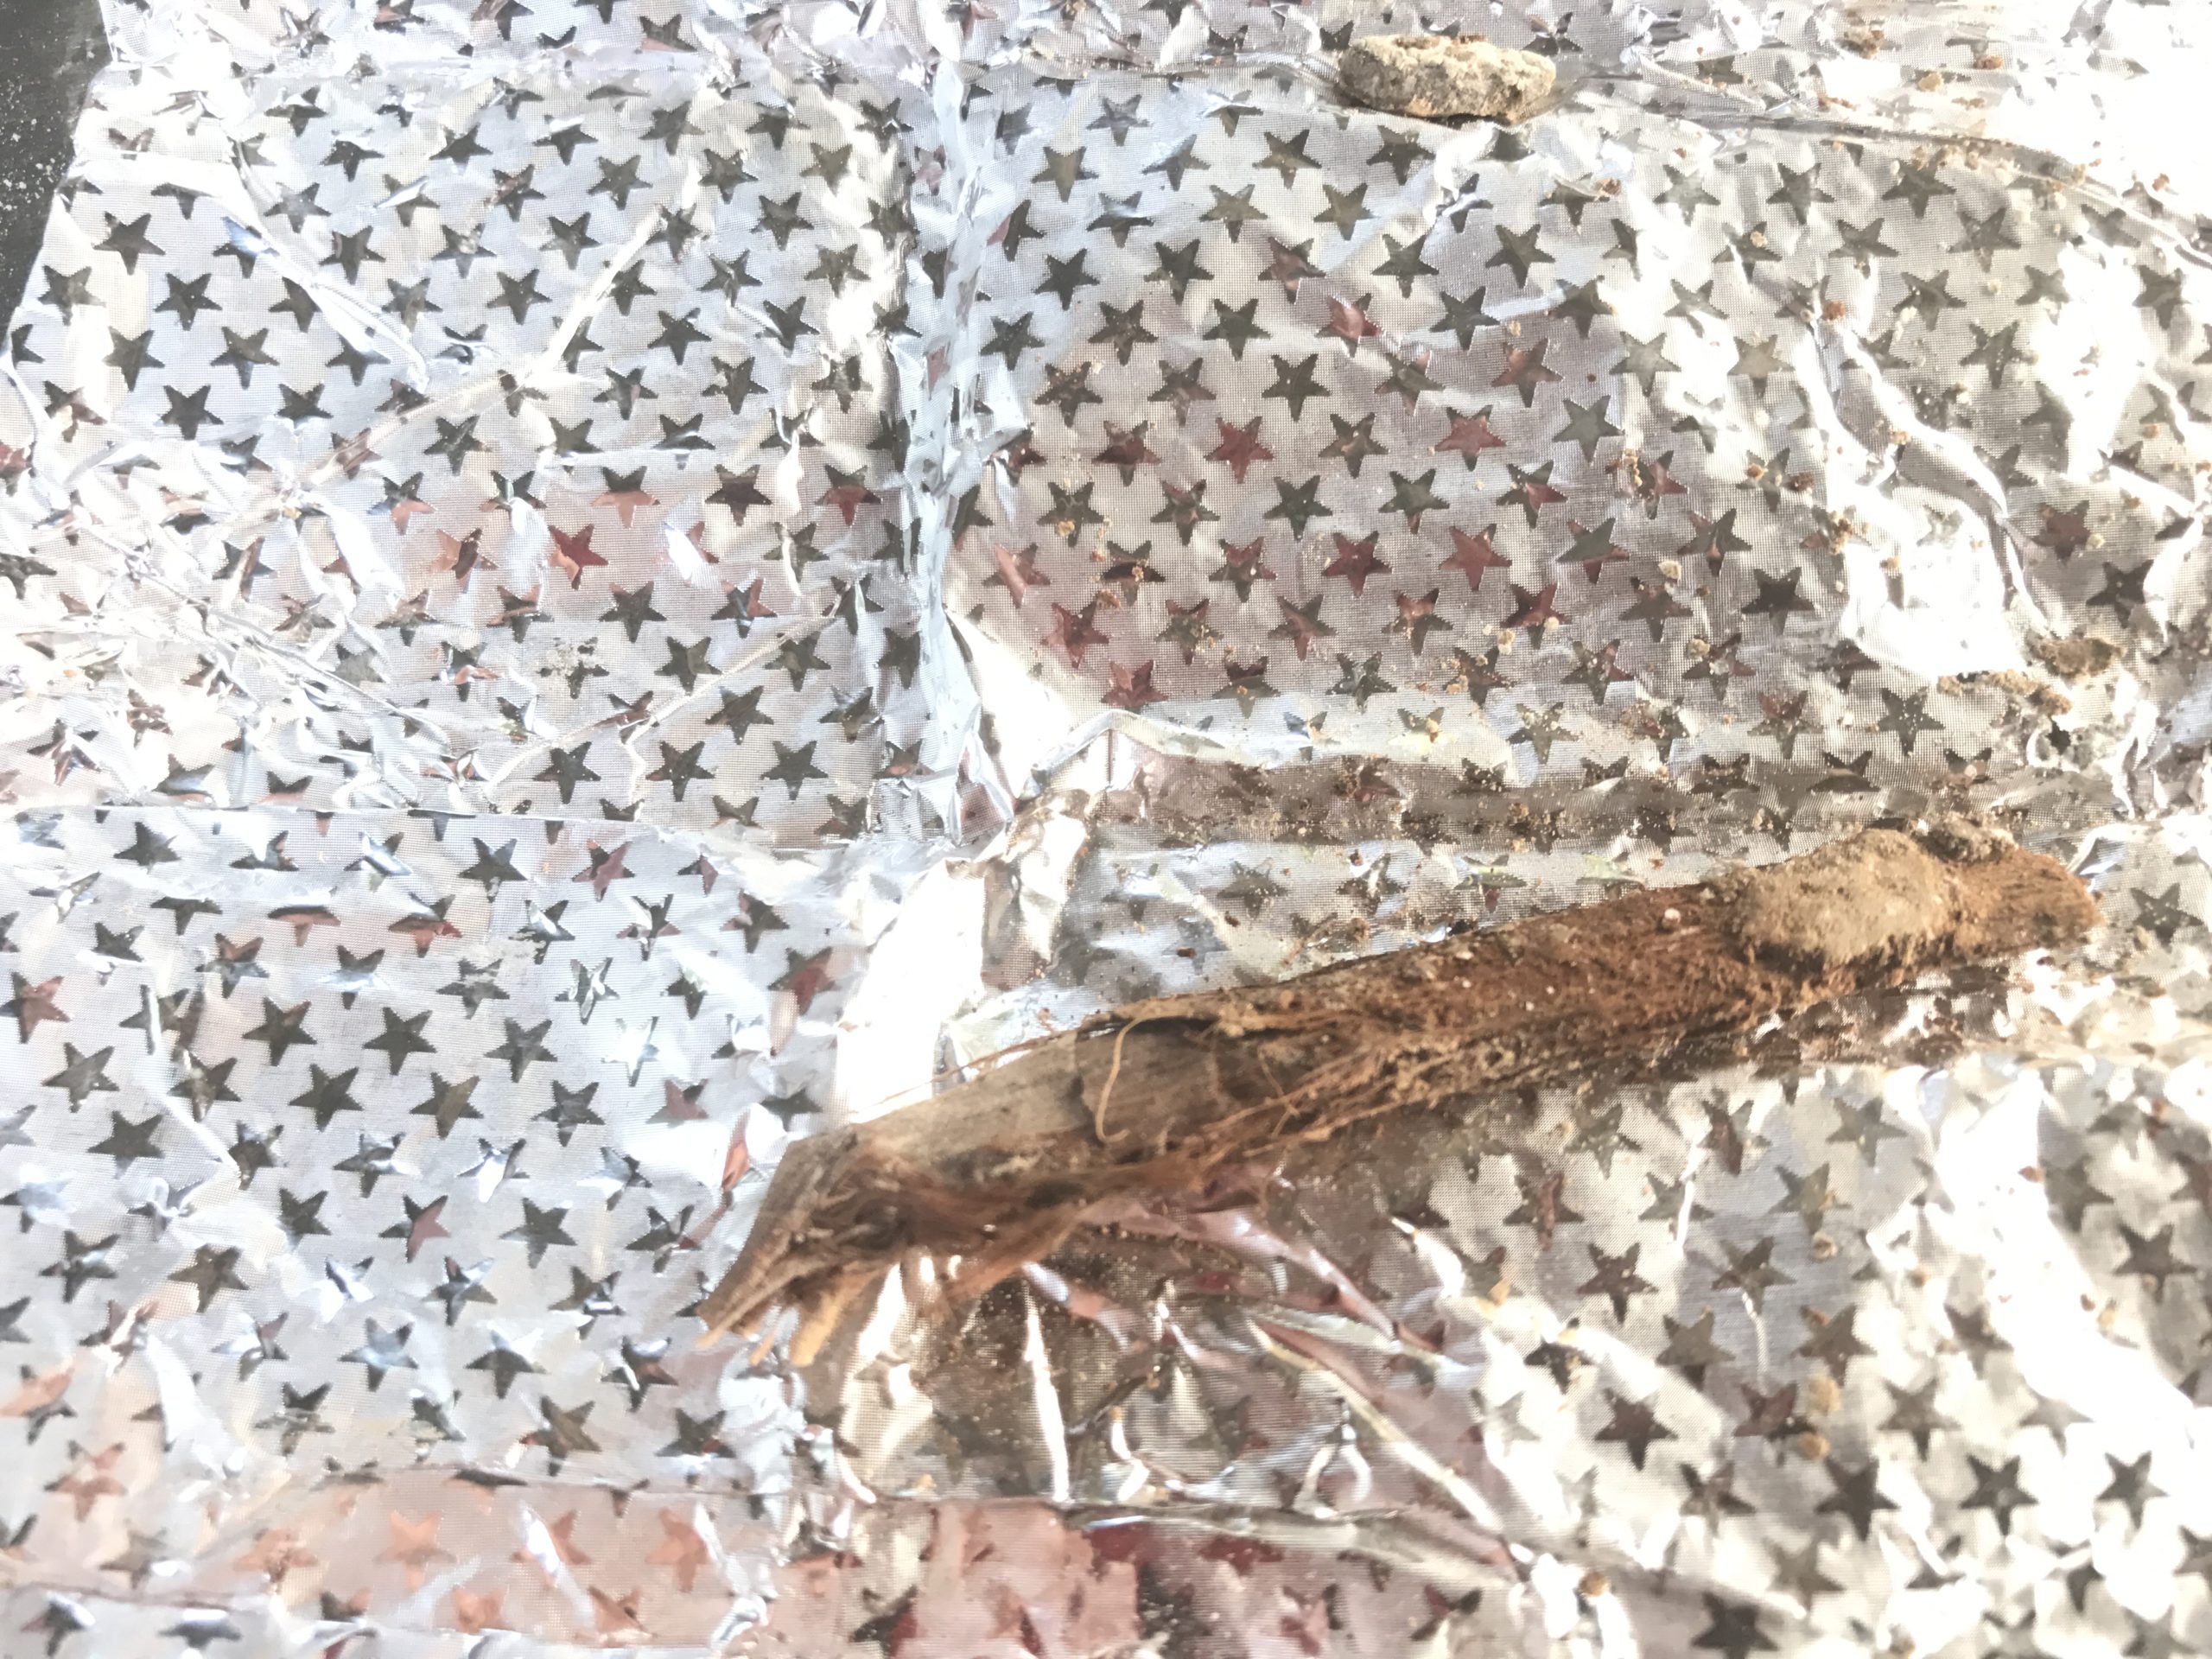
| Eastern Section Below Beach Ridge Closeup on Woody Deposits with Ruler and Scales |
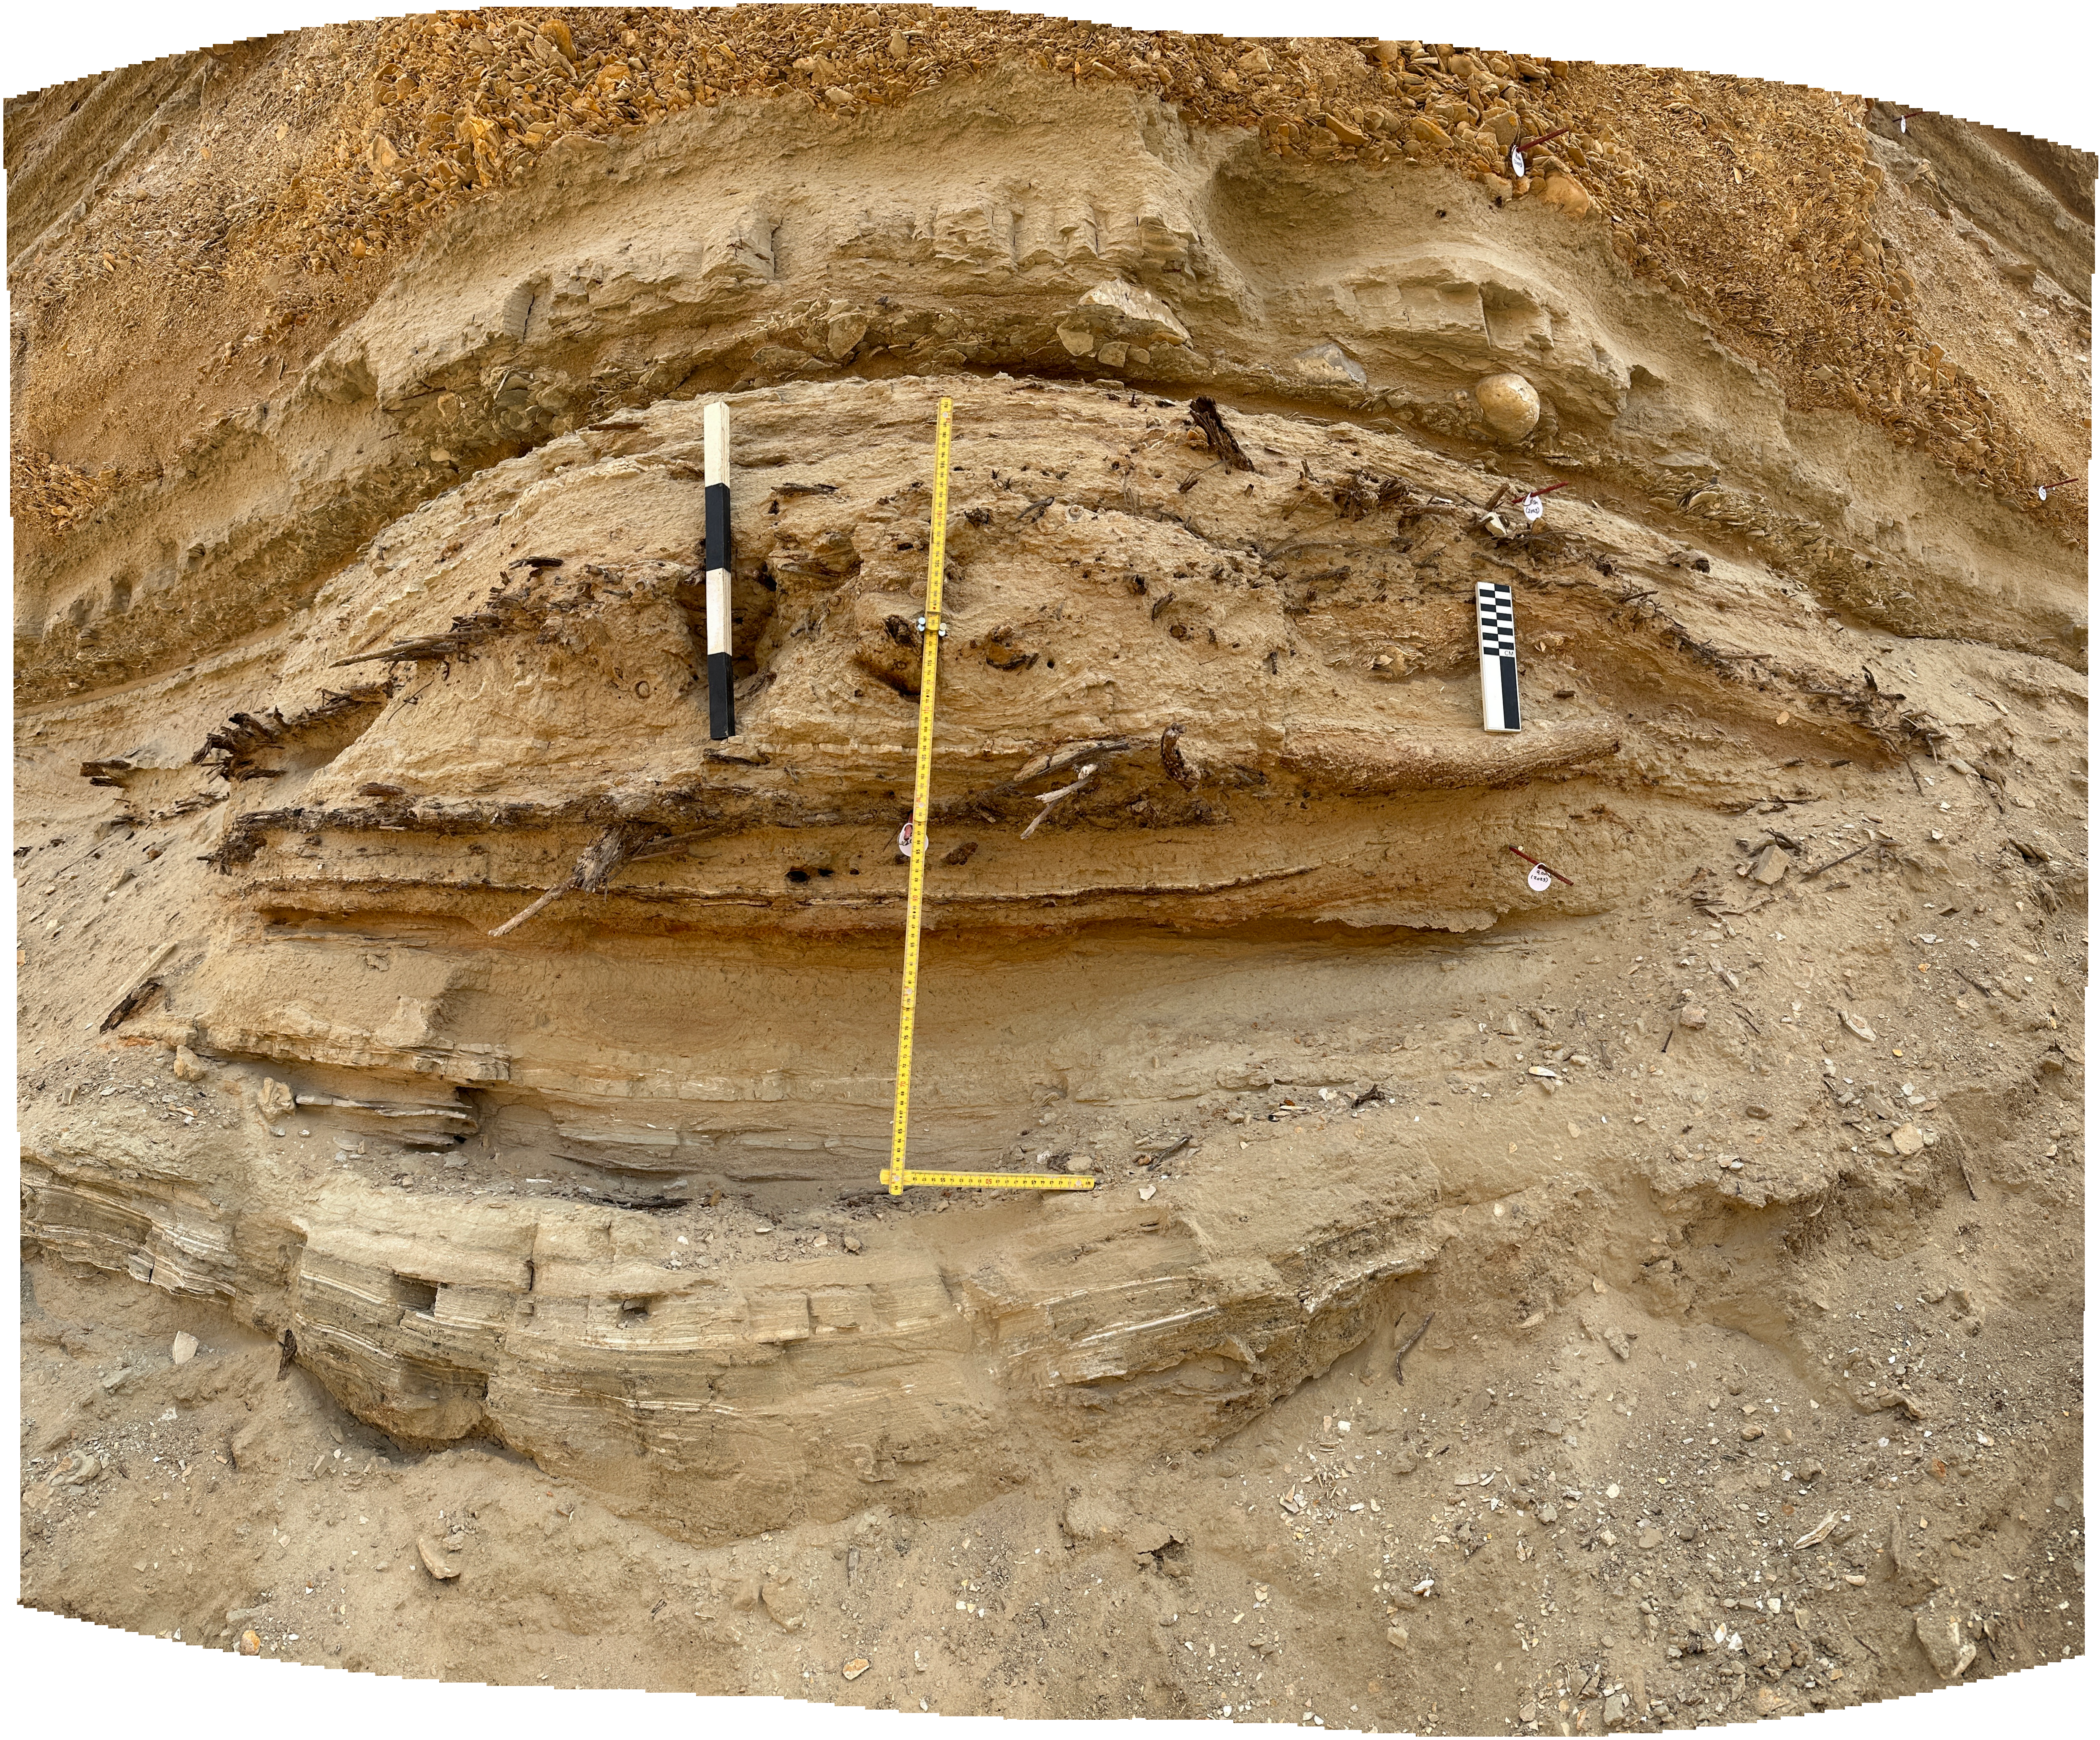
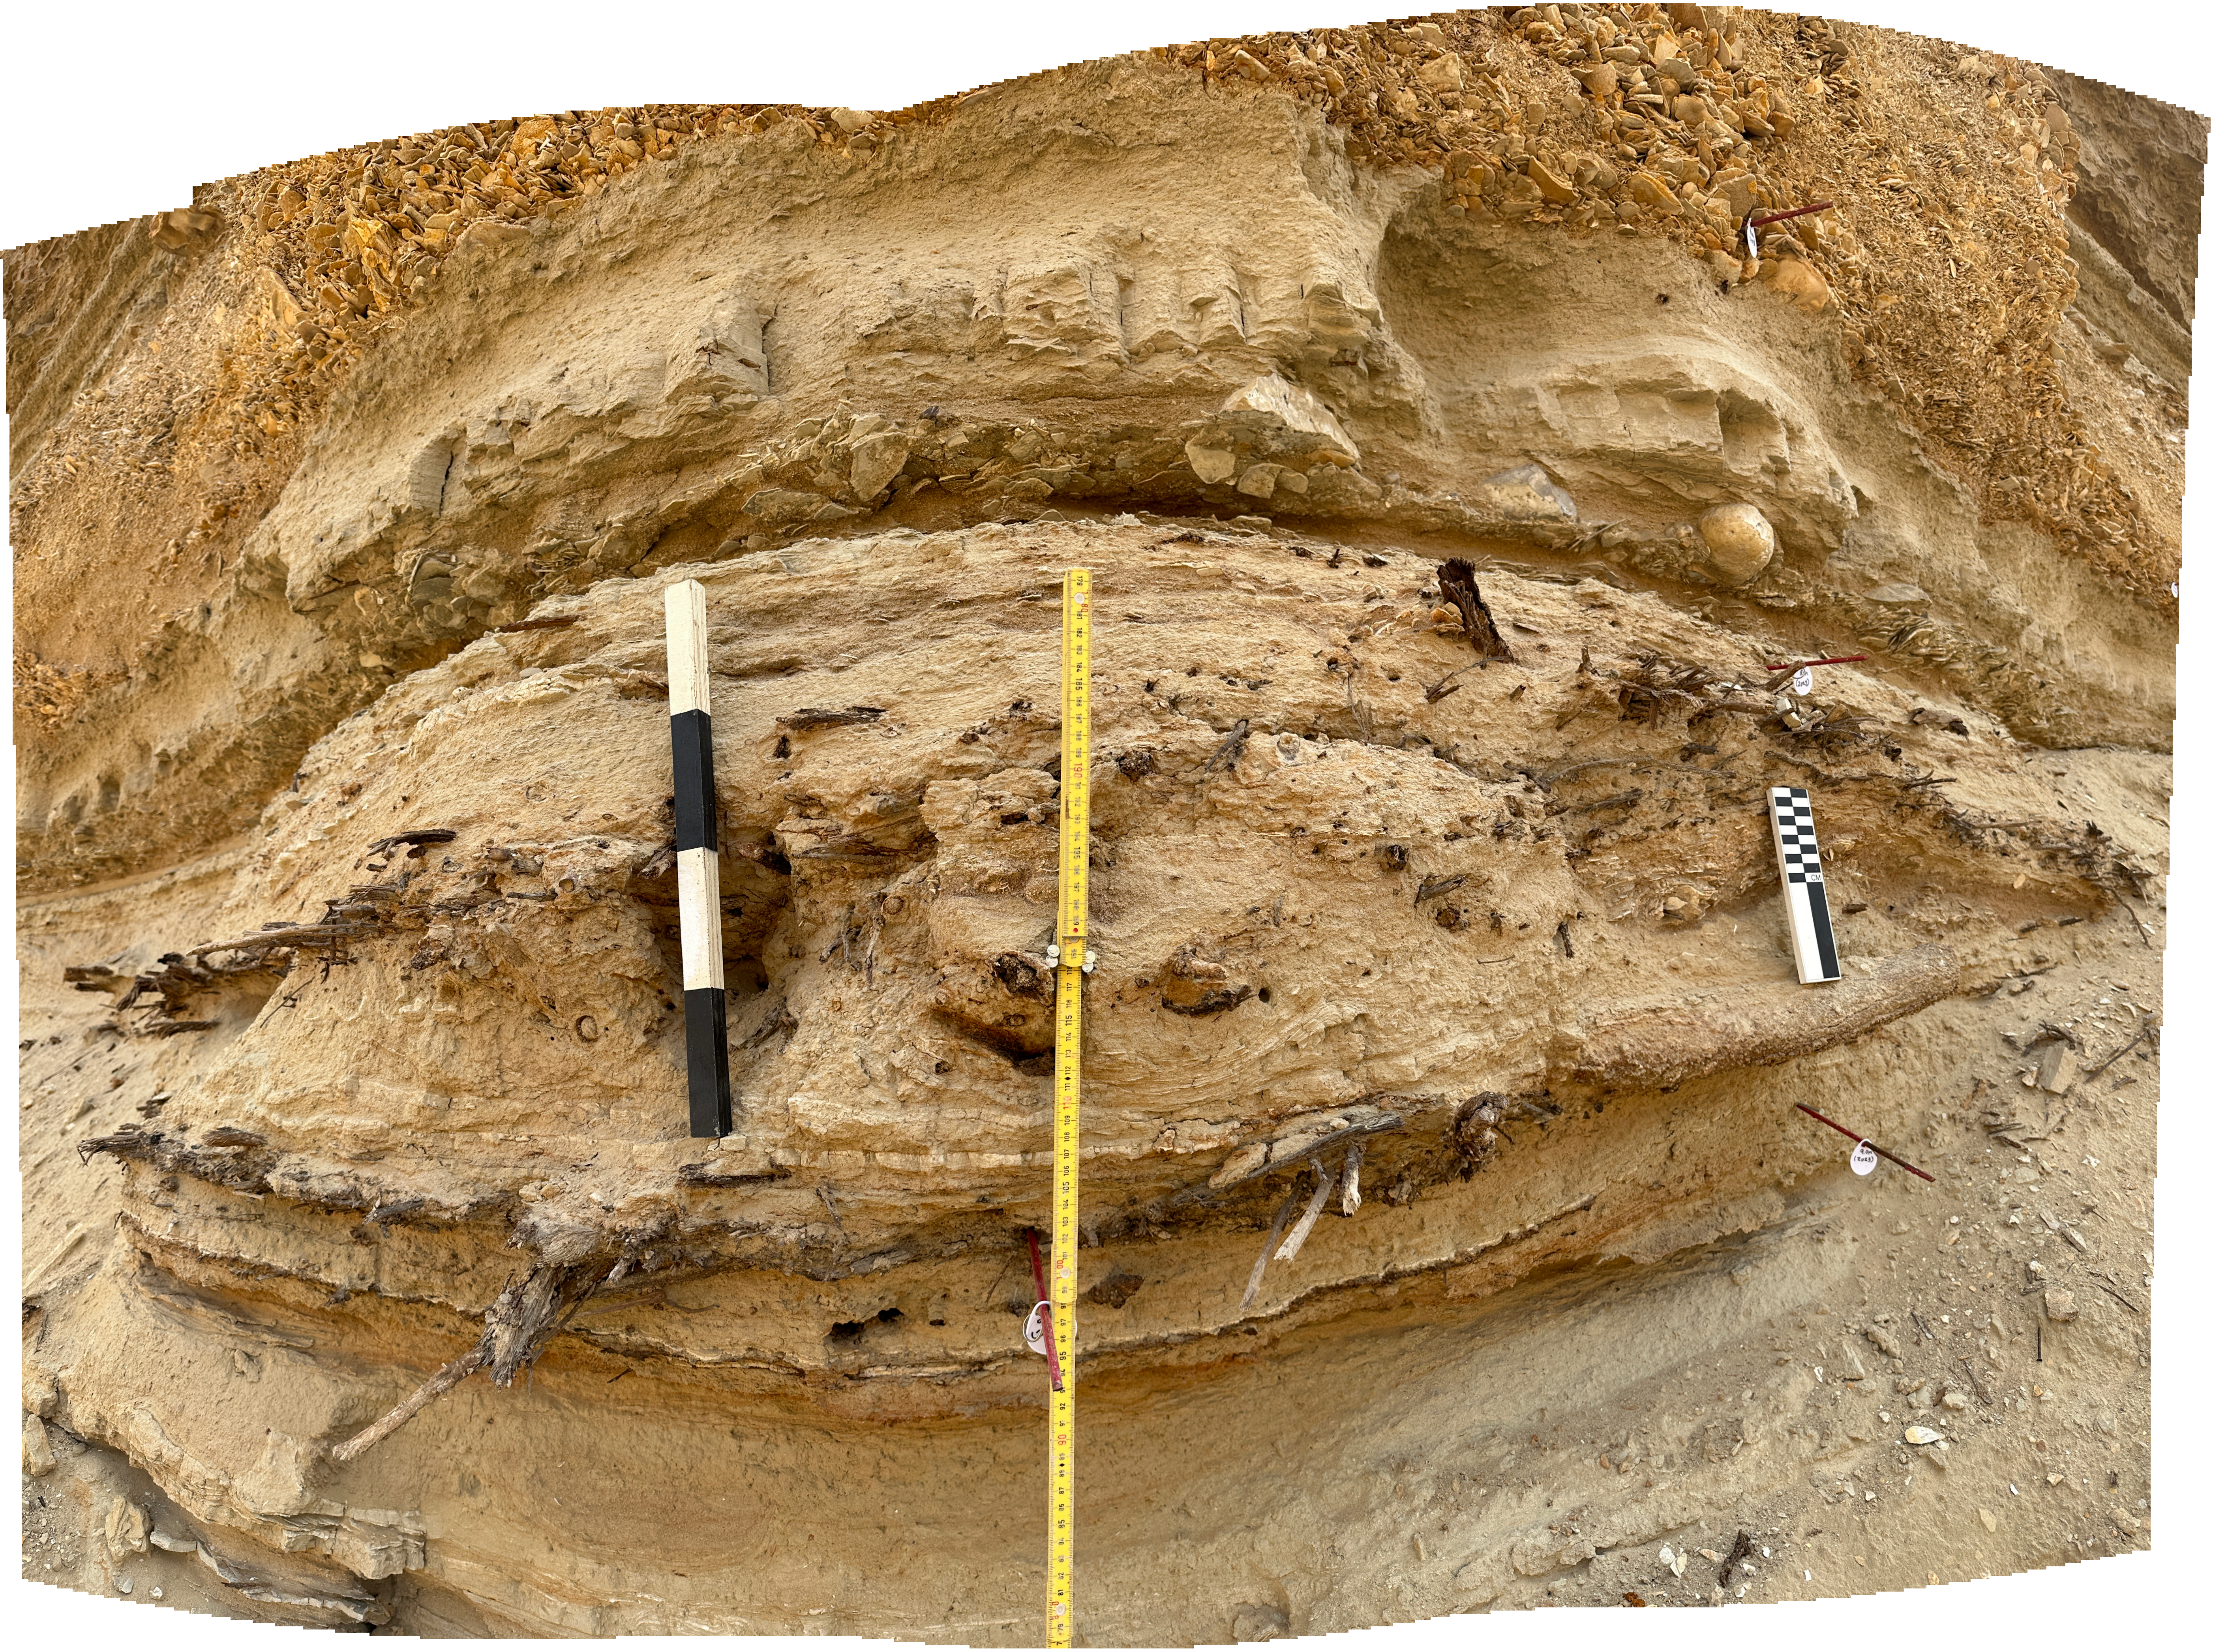
 Eastern Section Below Beach Ridge at Site ZA-4
Closeup on Woody Deposits with rulers and scales Photo by Jefferson Williams 14 Feb. 2023 |
Jefferson Williams |
 Eastern Section at ZA-4 above Beach Ridge
Click on Image for high resolution magnifiable image
Photos by Jefferson Williams 10 Feb. 2023
 Eastern Section at ZA-4 below Beach Ridge
Cleaned Section
Click on Image for high resolution magnifiable image
Photos by Jefferson Williams 10 Feb. 2023
 Eastern Section at ZA-4 below Beach Ridge
Less Clean Section with Ruler and Scales
Click on Image for high resolution magnifiable image
Photos by Jefferson Williams 14 Feb. 2023
 Eastern Section at ZA-4 below Beach Ridge
Closeup on Woody Deposits
Click on Image for high resolution magnifiable image
Photos by Jefferson Williams 14 Feb. 2023
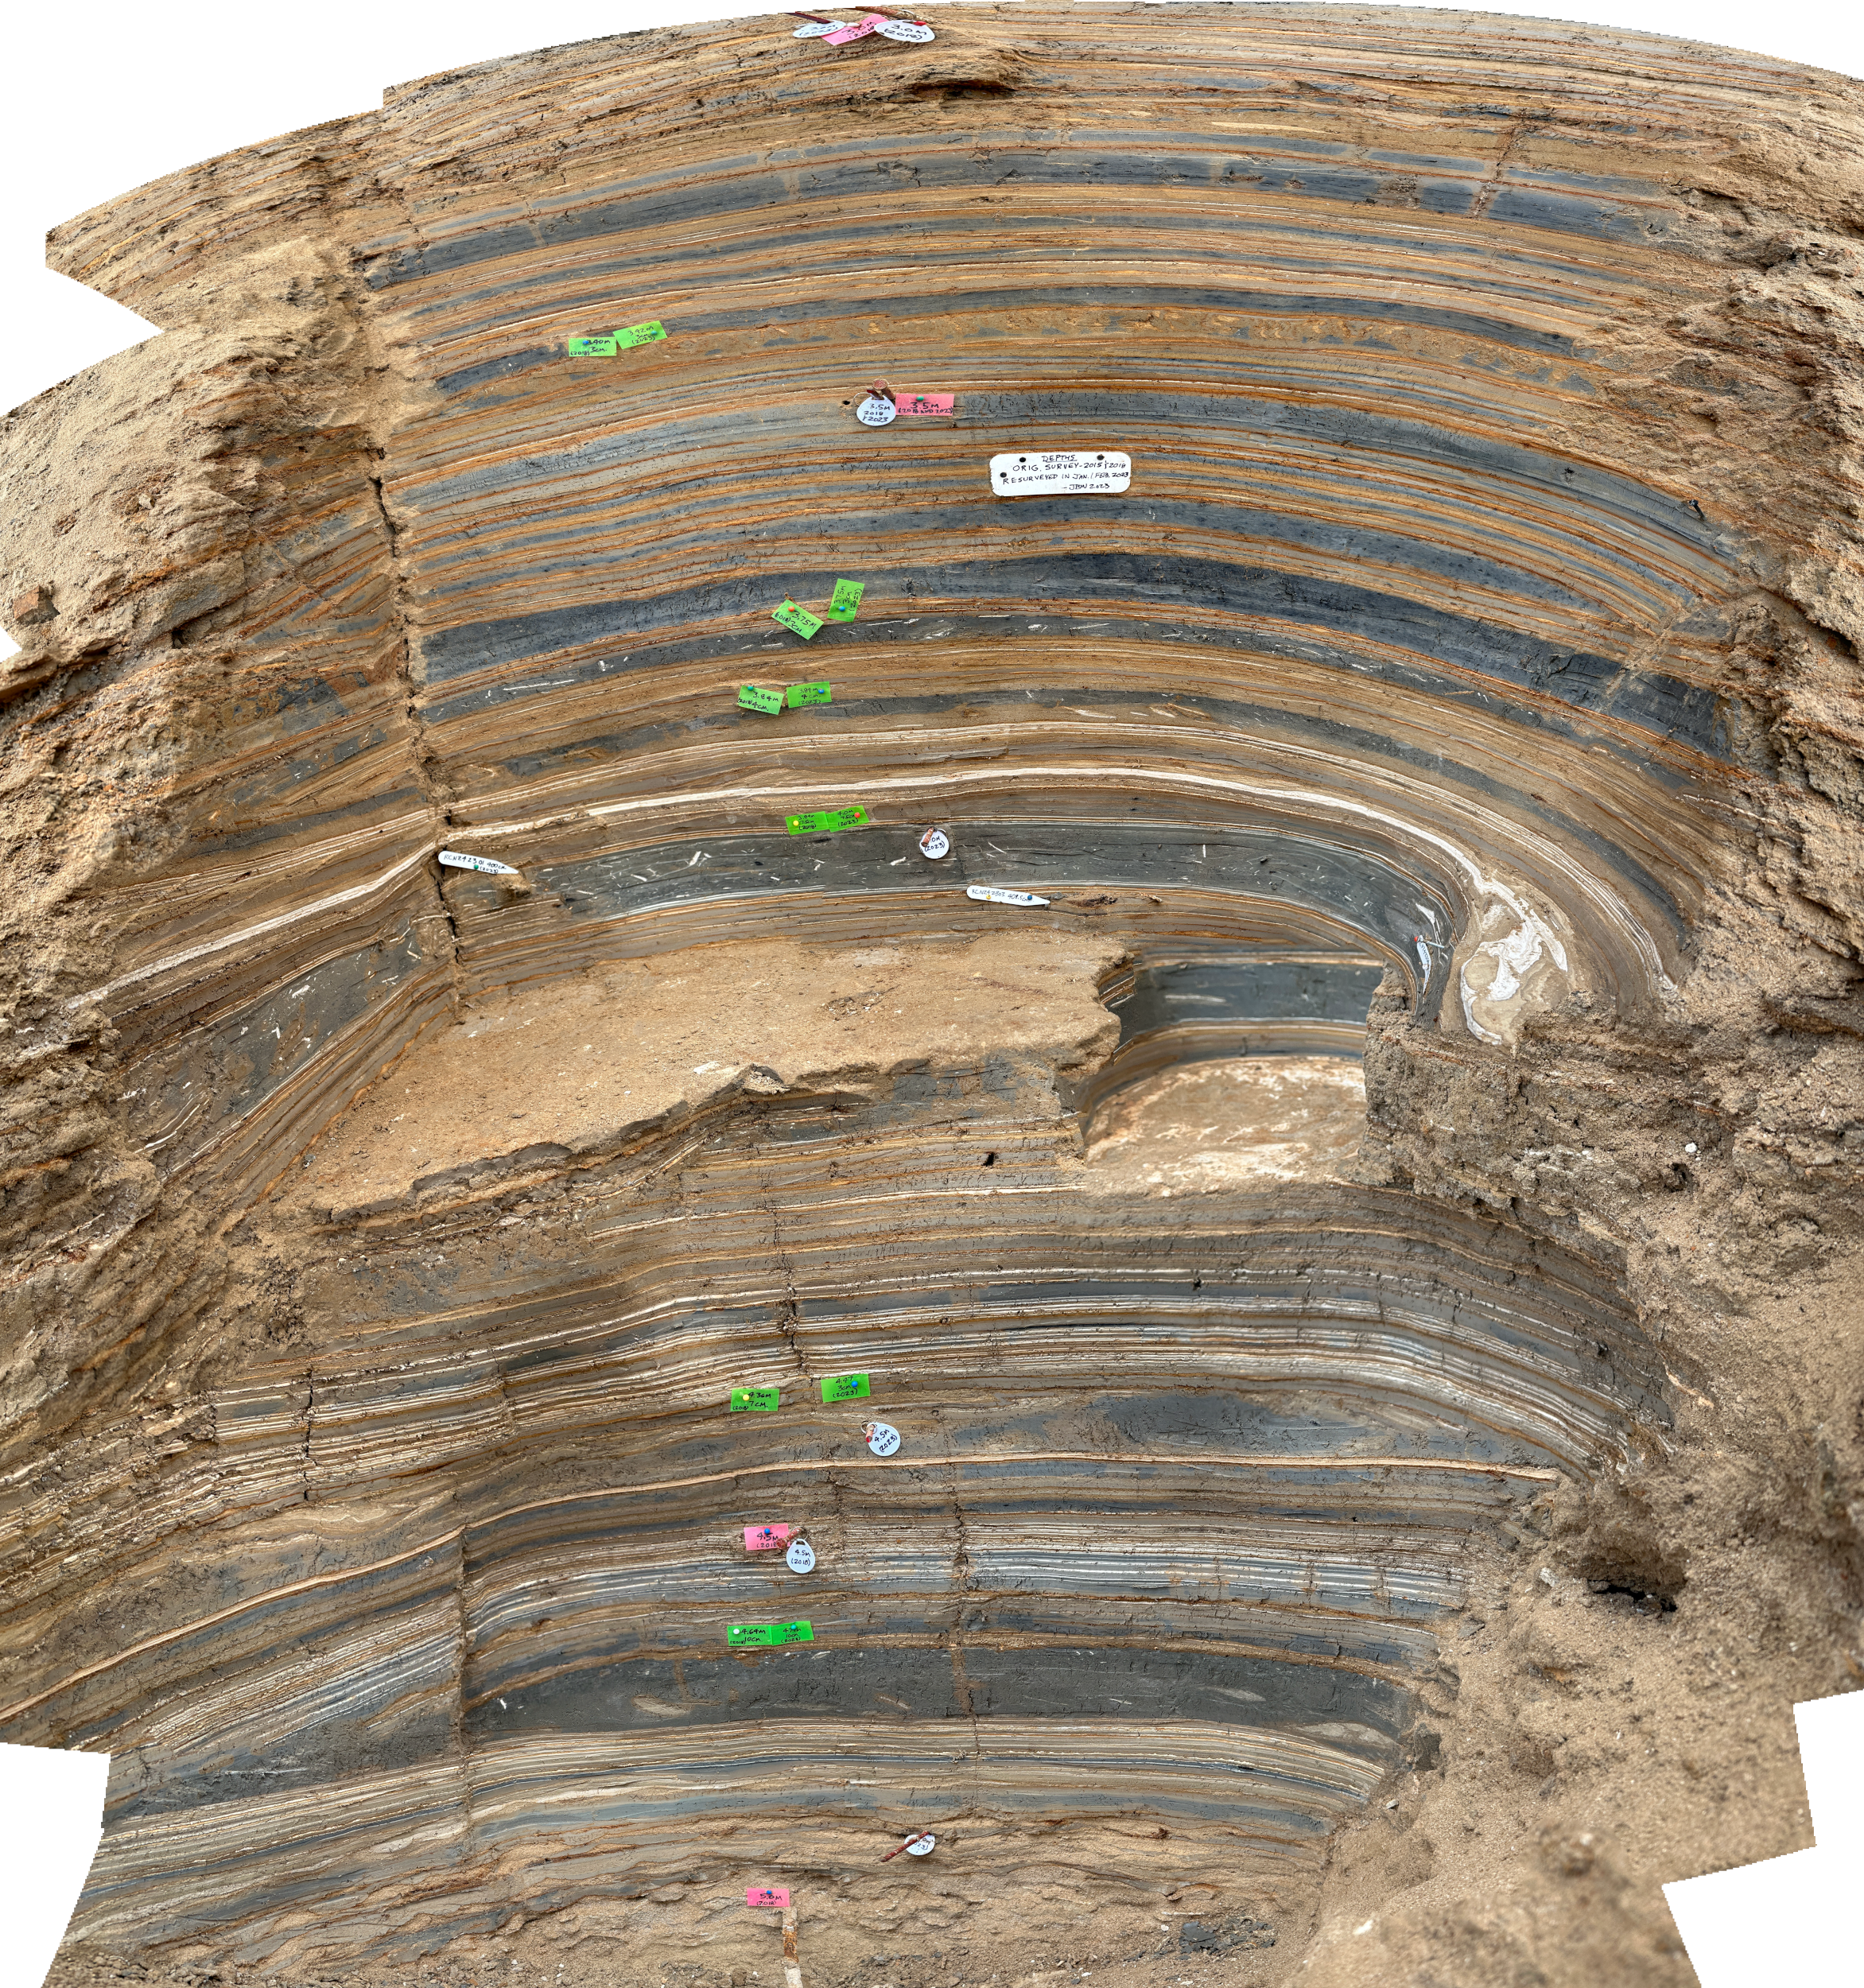
 Middle Section at ZA-4
Click on Image for high resolution magnifiable image
Photos by Jefferson Williams 04 Feb. 2023
 Bottom of Middle Section at ZA-4
Click on Image for high resolution magnifiable image
Photos by Jefferson Williams 04 Feb. 2023
| Image | Description | Source |
|---|---|---|
 Entire Middle Section at Site ZA-4
Photo by Jefferson Williams 06 Feb. 2023 |
Entire Middle Section | Jefferson Williams |
 Entire Middle Section at Site ZA-4
Photo by Jefferson Williams 03 Feb. 2023 |
Entire Middle Section | Jefferson Williams |
 Bottom of Middle Section at Site ZA-4
Photo by Jefferson Williams 03 Feb. 2023 |
Bottom of Middle Section | Jefferson Williams |
 Middle 01 of Middle Section at Site ZA-4
Photo by Jefferson Williams 03 Feb. 2023 |
Middle 01 of Middle Section | Jefferson Williams |
 Middle 02 of Middle Section at Site ZA-4
Photo by Jefferson Williams 03 Feb. 2023 |
Middle 02 of Middle Section | Jefferson Williams |
 Top of Middle Section at Site ZA-4
Photo by Jefferson Williams 03 Feb. 2023 |
Top of Middle Section | Jefferson Williams |
| Image | Description | Source |
|---|---|---|
 All 3 Western Sections at Site ZA-4
Photo by Jefferson Williams 06 Feb. 2023 |
All 3 Western Sections | Jefferson Williams |
 Entire Western Section
Photo by Jefferson Williams 06 Feb. 2023 |
Entire Western Section | Jefferson Williams |
 Entire Western Section at Site ZA-4 (view from below)
Photo by Jefferson Williams 05 Feb. 2023 |
Entire Western Section (view from below) |
Jefferson Williams |
 Top Left of Western Section at Site ZA-4
Photo by Jefferson Williams 05 Feb. 2023 |
Top Left of Western Section | Jefferson Williams |
 Top Left and Top Right of Western Section at Site ZA-4
Photo by Jefferson Williams 05 Feb. 2023 |
Top Left and Top Right of Western Section | Jefferson Williams |
 Abovet Top Middle of Western Section at Site ZA-4
Photo by Jefferson Williams 05 Feb. 2023 |
Above Top Middle of Western Section | Jefferson Williams |
 Top Middle of Western Section at Site ZA-4
Photo by Jefferson Williams 05 Feb. 2023 |
Top Middle of Western Section | Jefferson Williams |
 Mid Middle of Western Section at Site ZA-4
Photo by Jefferson Williams 05 Feb. 2023 |
Mid Middle of Western Section | Jefferson Williams |
 Bottom Middle of Western Section at Site ZA-4
Photo by Jefferson Williams 05 Feb. 2023 |
Bottom Middle of Western Section | Jefferson Williams |
 Bottom of Western Section at Site ZA-4
Photo by Jefferson Williams 05 Feb. 2023 |
Bottom of Western Section | Jefferson Williams |
 Entire Western Section at ZA-4
Click on Image for high resolution magnifiable image
Drone Photos by Jefferson Williams 11 Feb. 2023
 Top Left of Western Section at ZA-4
Click on Image for high resolution magnifiable image
Photos by Jefferson Williams 11 Feb. 2023
 Top Right Part of Western Section at Site ZA-4
Click on Image for high resolution magnifiable image
Photos by Jefferson Williams 10 Feb. 2023
 Top Middle of Western Section at ZA-4
Click on Image for high resolution magnifiable image
Photos by Jefferson Williams 11 Feb. 2023
 Bottom Middle of Western Section at ZA-4
Click on Image for high resolution magnifiable image
Photos by Jefferson Williams 13 Feb. 2023
 2nd Bench up of Bottom of Western Section at ZA-4
Click on Image for high resolution magnifiable image
Photos by Jefferson Williams 10 Feb. 2023
 Bottom Bench of Western Section at ZA-4
Click on Image for high resolution magnifiable image
Photos by Jefferson Williams 10 Feb. 2023
 Bottom Two Benches of Western Section at Site ZA-4
Click on Image for high resolution magnifiable image
Photos by Jefferson Williams 10 Feb. 2023
| Image | Description | Source |
|---|---|---|
|
All 3 Western Sections at Site ZA-4 Photo by Jefferson Williams 06 Feb. 2023 |
All 3 Western Sections | Jefferson Williams |
 Entire Western Section Connector at Site ZA-4
Photo by Jefferson Williams 06 Feb. 2023 |
Entire Western Section Connector | Jefferson Williams |
 Western Connector Section at ZA-4
Click on Image for high resolution magnifiable image
Photos by Jefferson Williams 05 Feb. 2023
| Image | Description | Source |
|---|---|---|
|
All 3 Western Sections at Site ZA-4 Photo by Jefferson Williams 06 Feb. 2023 |
All 3 Western Sections | Jefferson Williams |
 Far Western Section at Site ZA-4
Photo by Jefferson Williams 10 Feb. 2023 |
Far Western Section | Jefferson Williams |
 Far Western Section at ZA-4
Click on Image for high resolution magnifiable image
Photos by Jefferson Williams 10 Feb. 2023
- JW: needs to be redone with a 44 cm. thickness for the 192/193 cm. seismite and a label of 419 or ~500 CE
 Bayesian Analysis of a section at Site ZA-4 version 004
Click on image to open in a new tab
Run using BACON and BACONQuake on Radiocarbon samples collected by JW in 2018 and 2023. Lake Level Curve from Bookman et al. (2004)
 Bayesian Analysis of a section at Site ZA-4 version 003
Click on image to open in a new tab
Run using BACON and BACONQuake on Radiocarbon samples collected by JW in 2018 and 2023. Lake Level Curve from Bookman et al. (2004)
 Bayesian Analysis of a section at Site ZA-4 version 002
Click on image to open in a new tab
Run using BACON and BACONQuake on Radiocarbon samples collected by JW in 2018 and 2023. Lake Level Curve from Bookman et al. (2004)
- BACONQuake
- Bacon("RC_NZ_Will_and_Will_2018_Combined_TopAndBottomAndOutlierOldSamplesRemoved",20,BCAD=FALSE,ask=FALSE)
- seismite_info_AllPossQuakes = read.table("SeismiteInfo_AllPossQuakes_ZA4_Will.csv", header = TRUE,sep = ",")
- seismite_info_Depths = read.table("SeismiteInfo_Depths_ZA4_Will.csv", header = TRUE,sep = ",")
- seismite_info_Picks = read.table("SeismiteInfo_Picks_ZA4_Will.csv", header = TRUE,sep = ",")
- LakeLevels = read.table("LakeLevelCurvesBookman2004_ZeelimA.csv", header = TRUE,sep = ",")
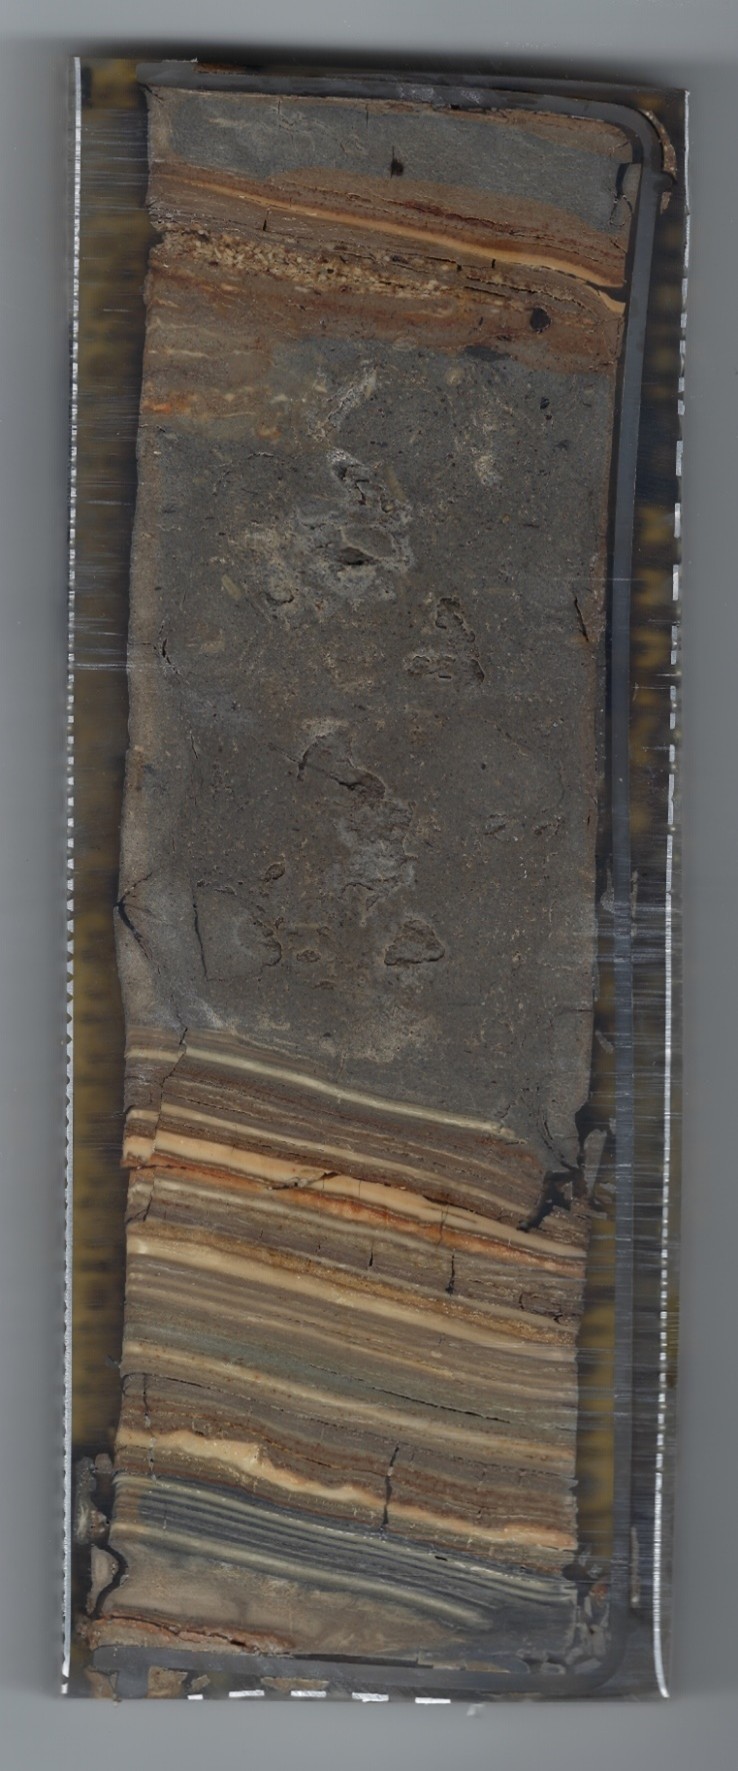
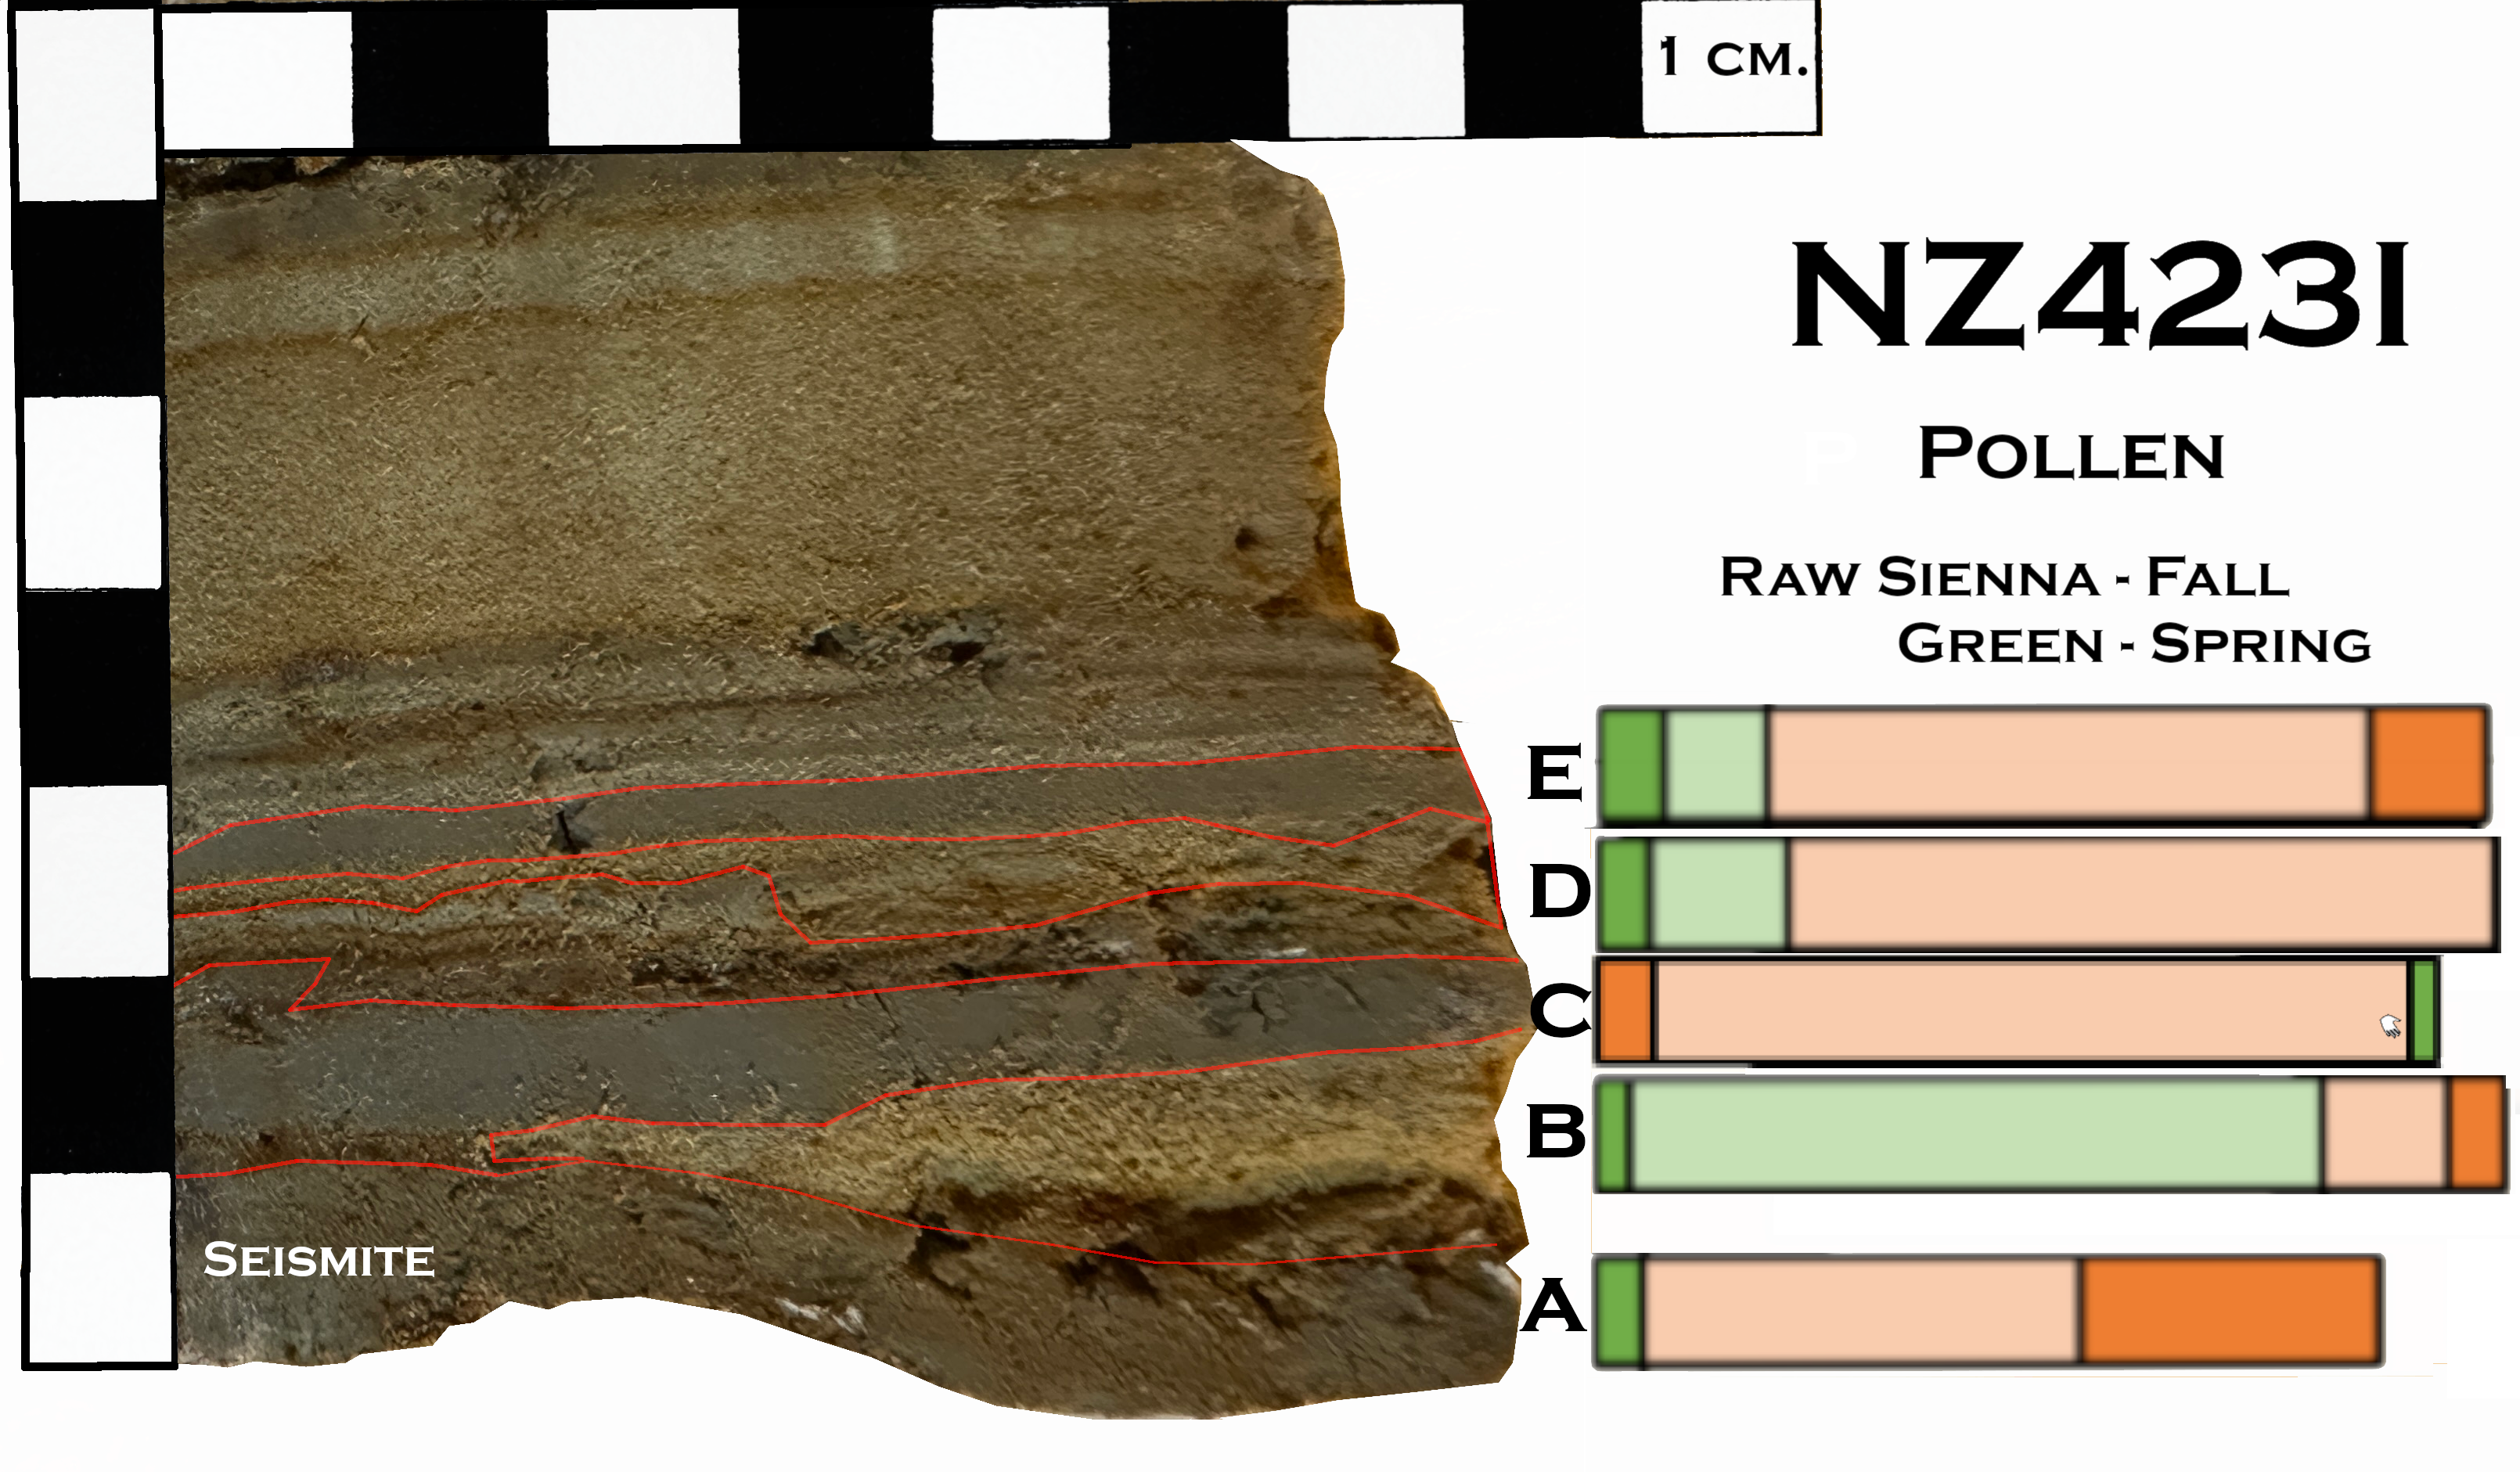 Sample NZ423I Annotated with Pollen Results - Green is Spring
Click on Image to open high resolution version in a new tab
Photo by JW - Nov. 2024
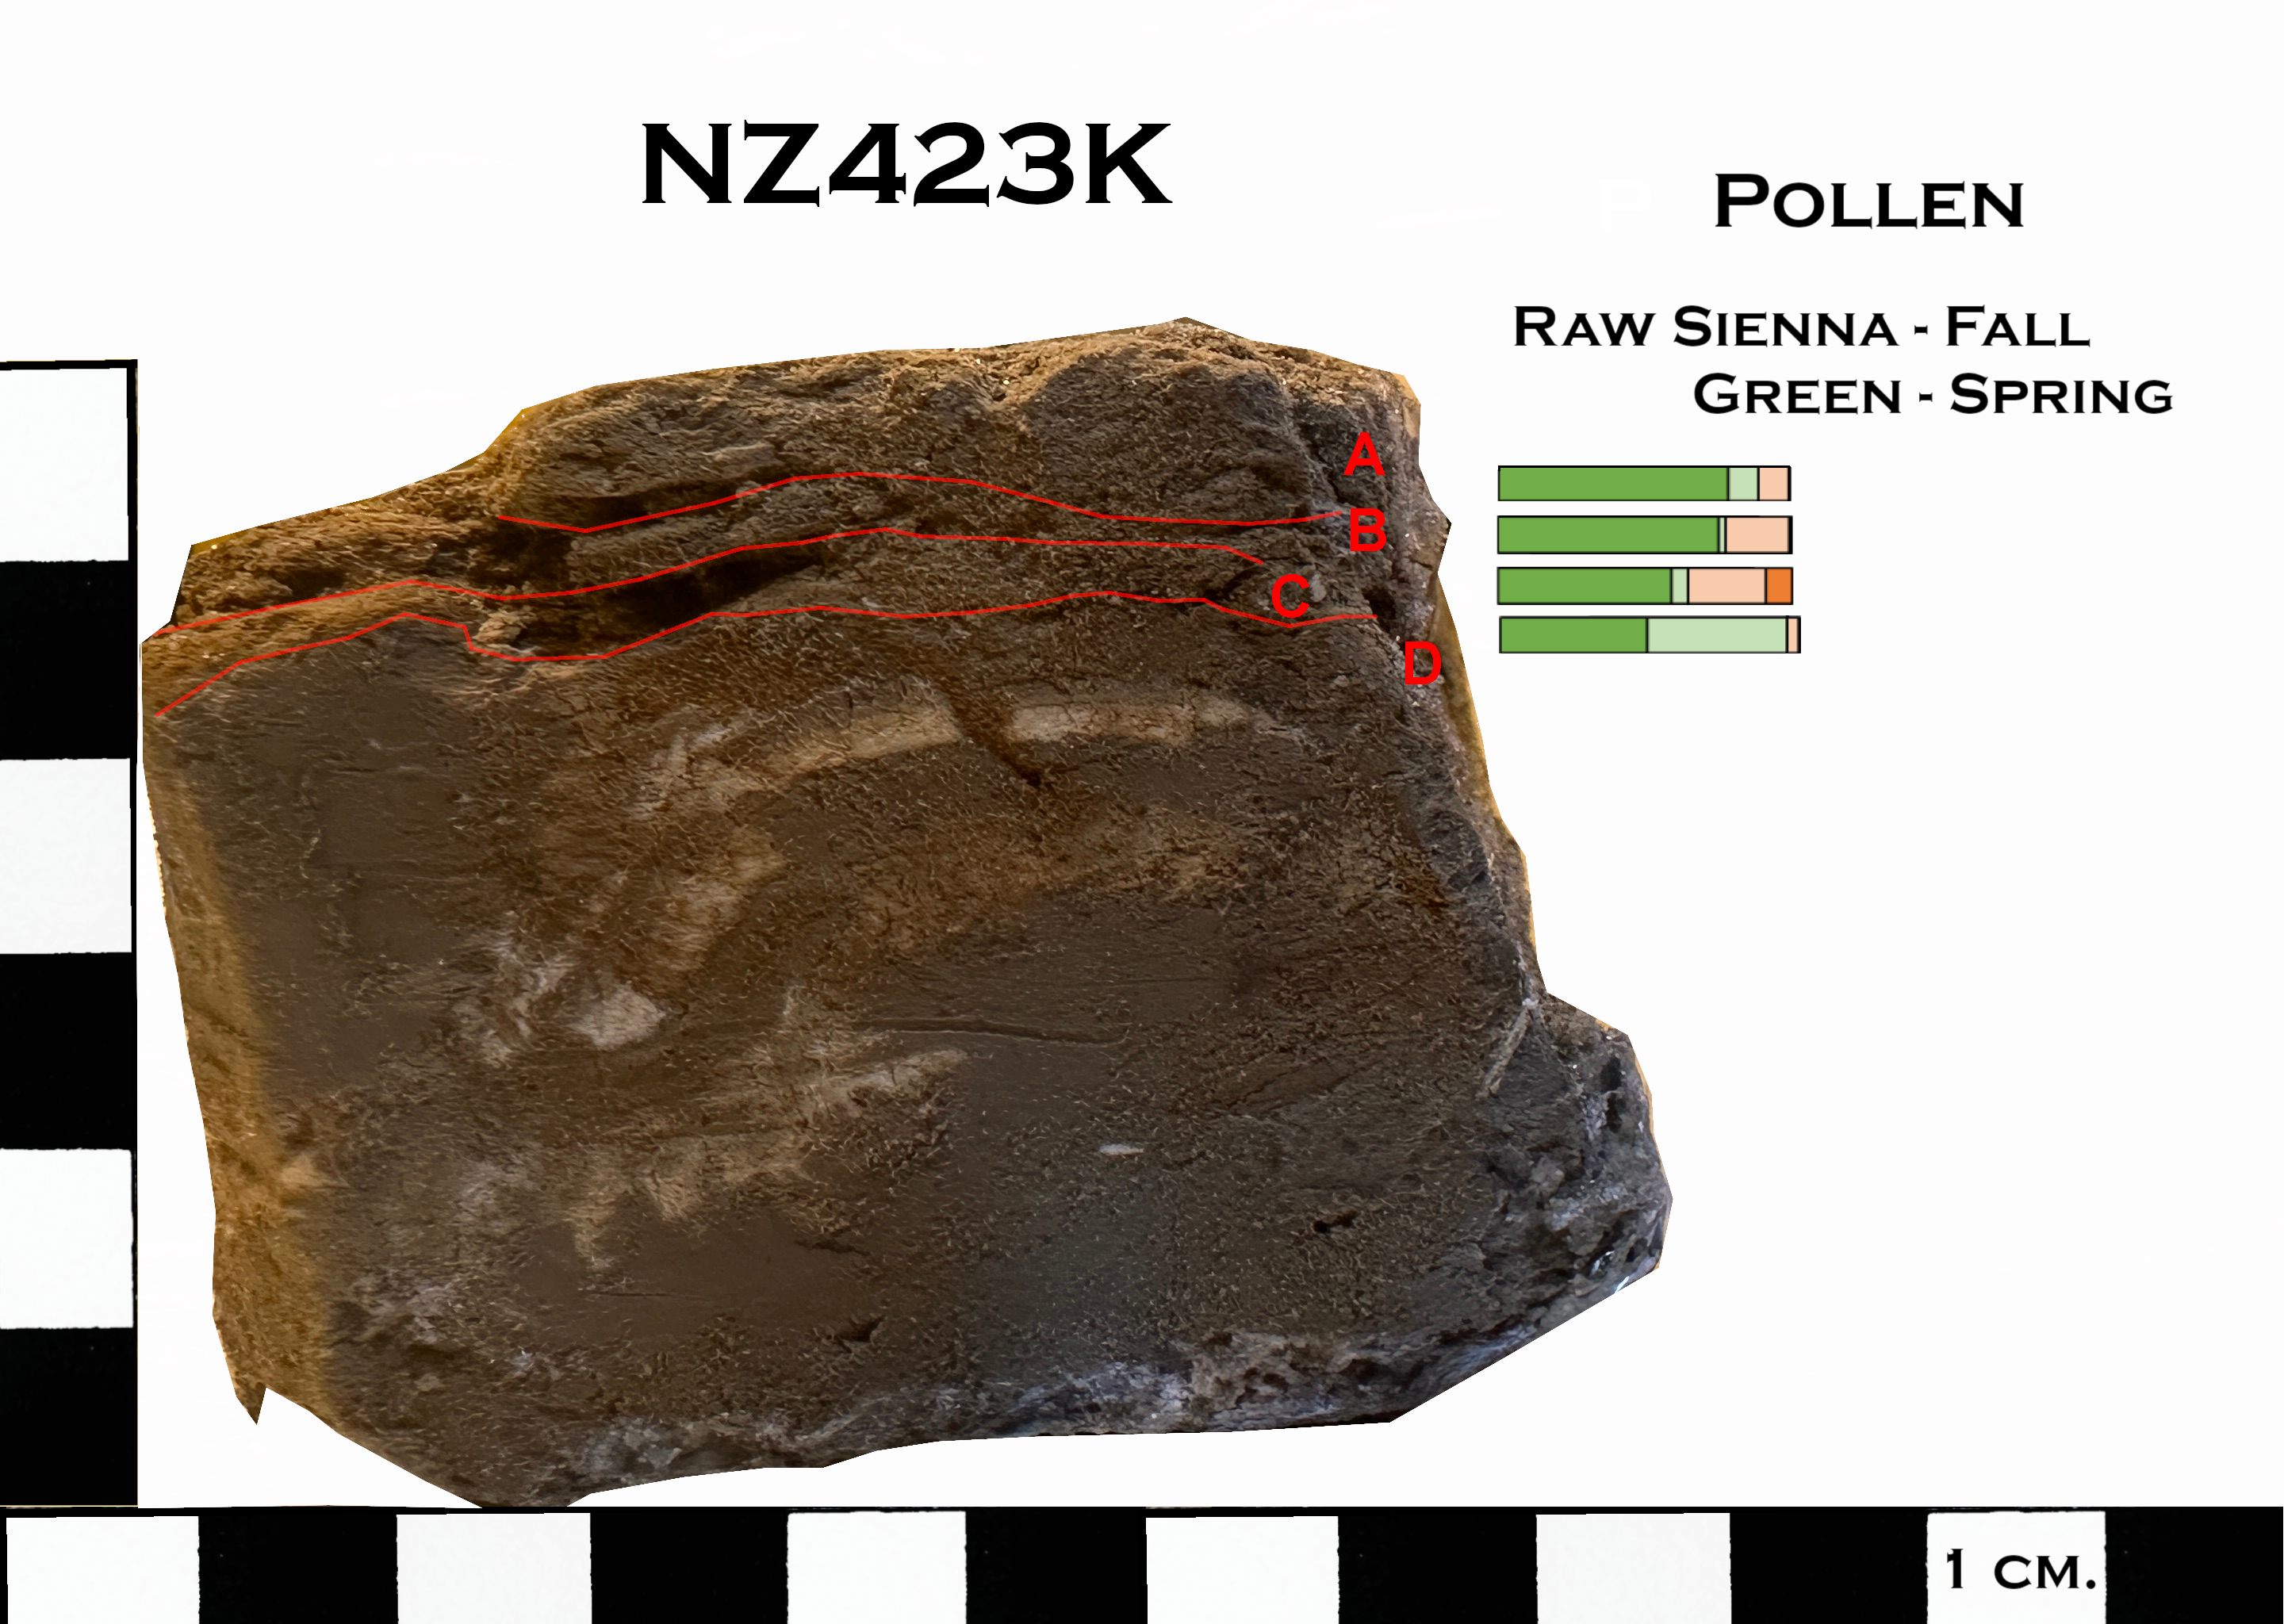 NZ423K Resample Bottom Piece Annotated with Pollen Results - Green is Spring
Click on Image to open high resolution version in a new tab
Photo by JW - Nov. 2024
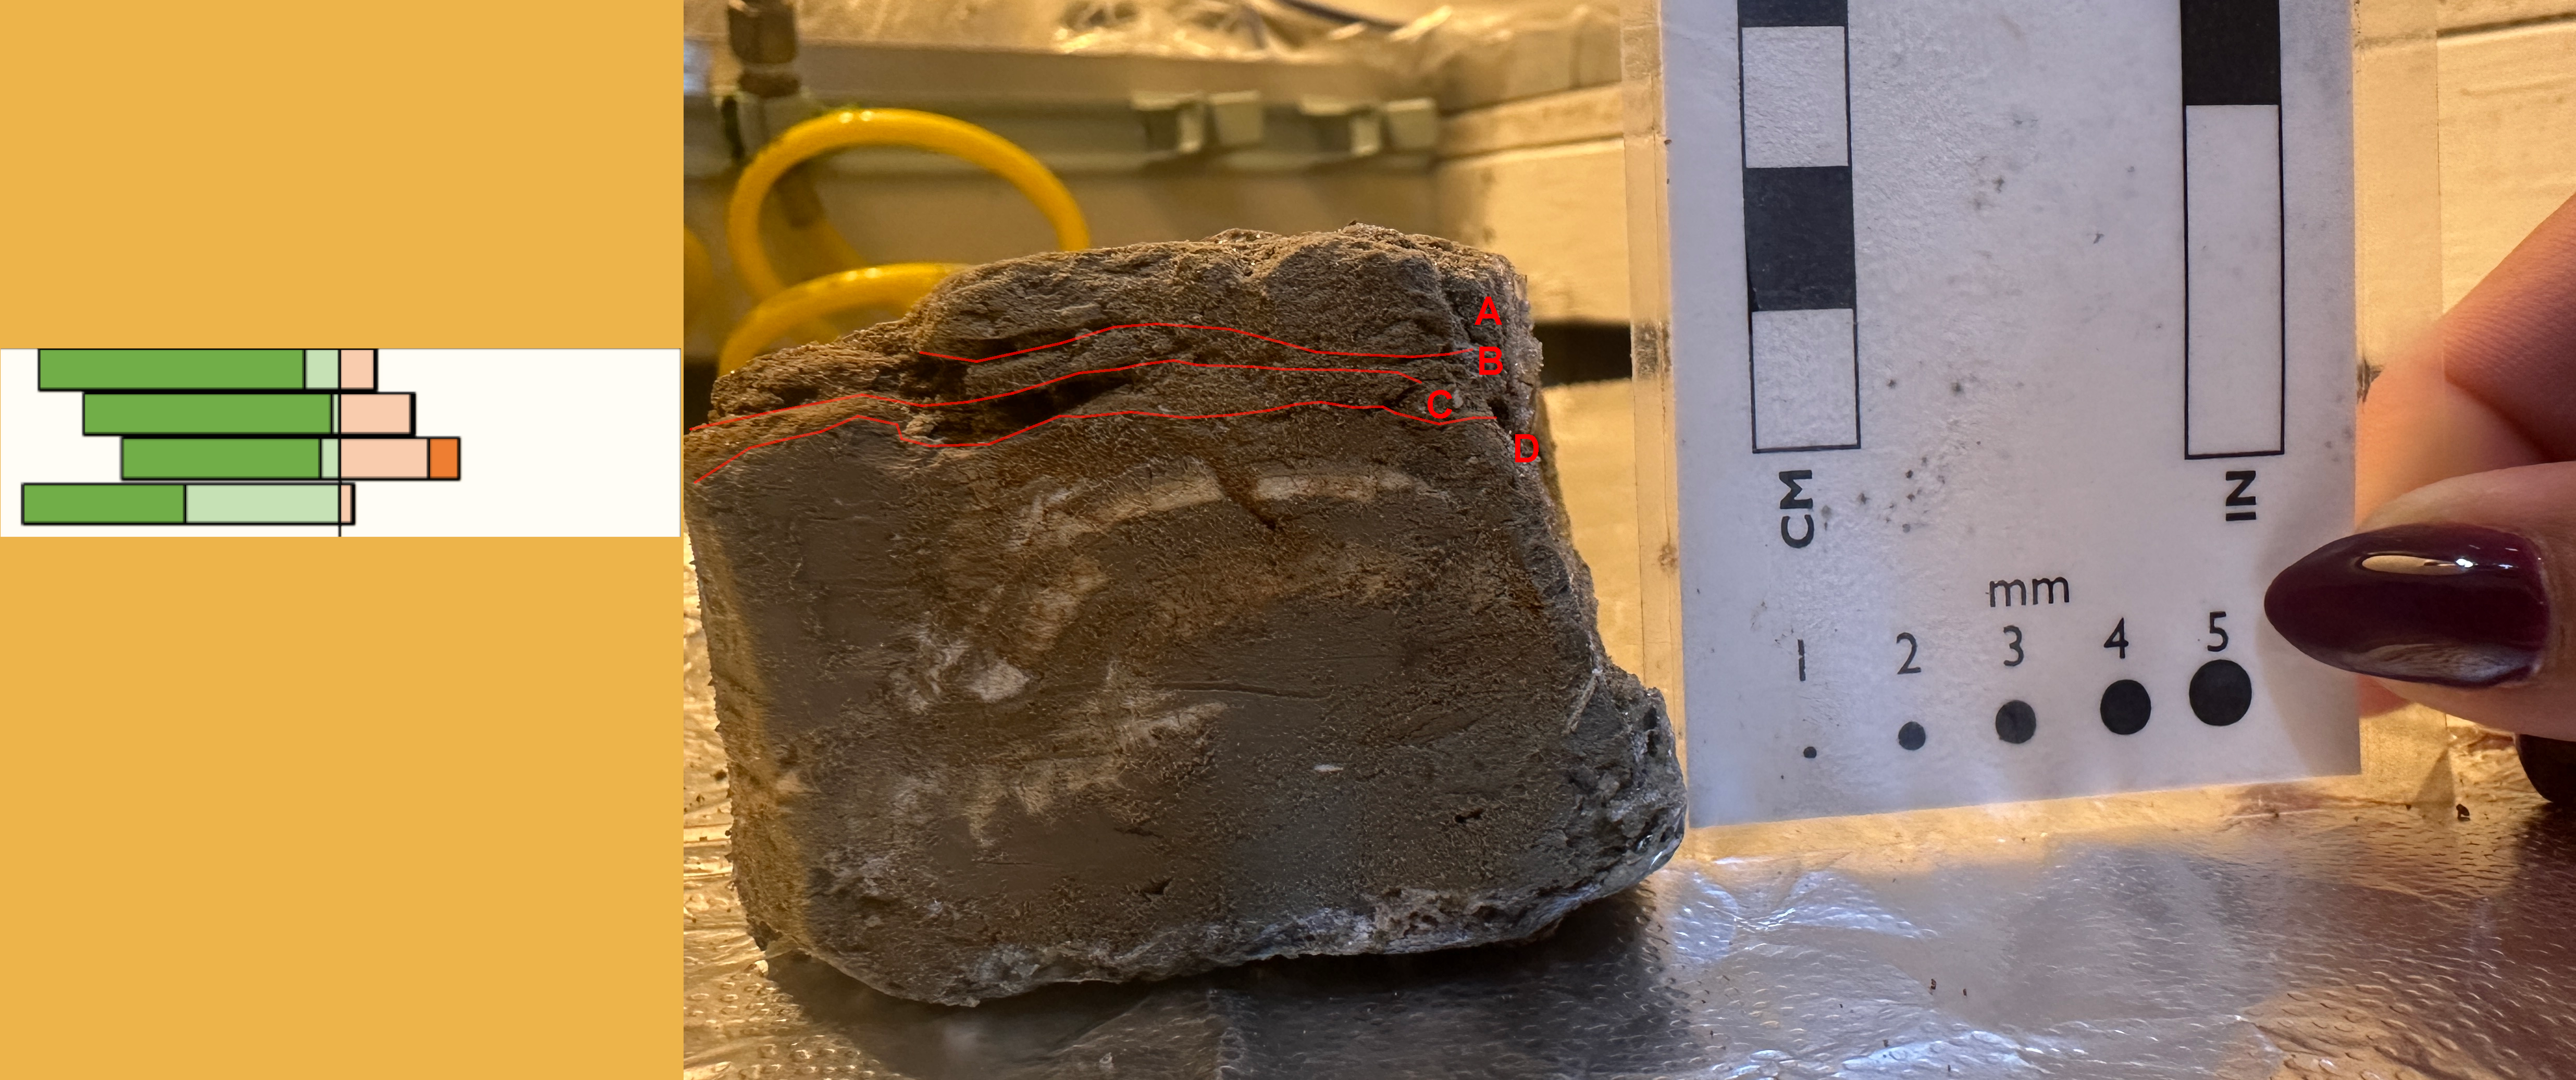
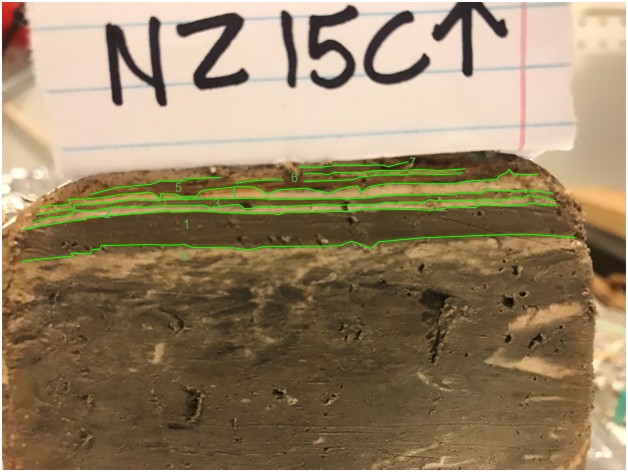
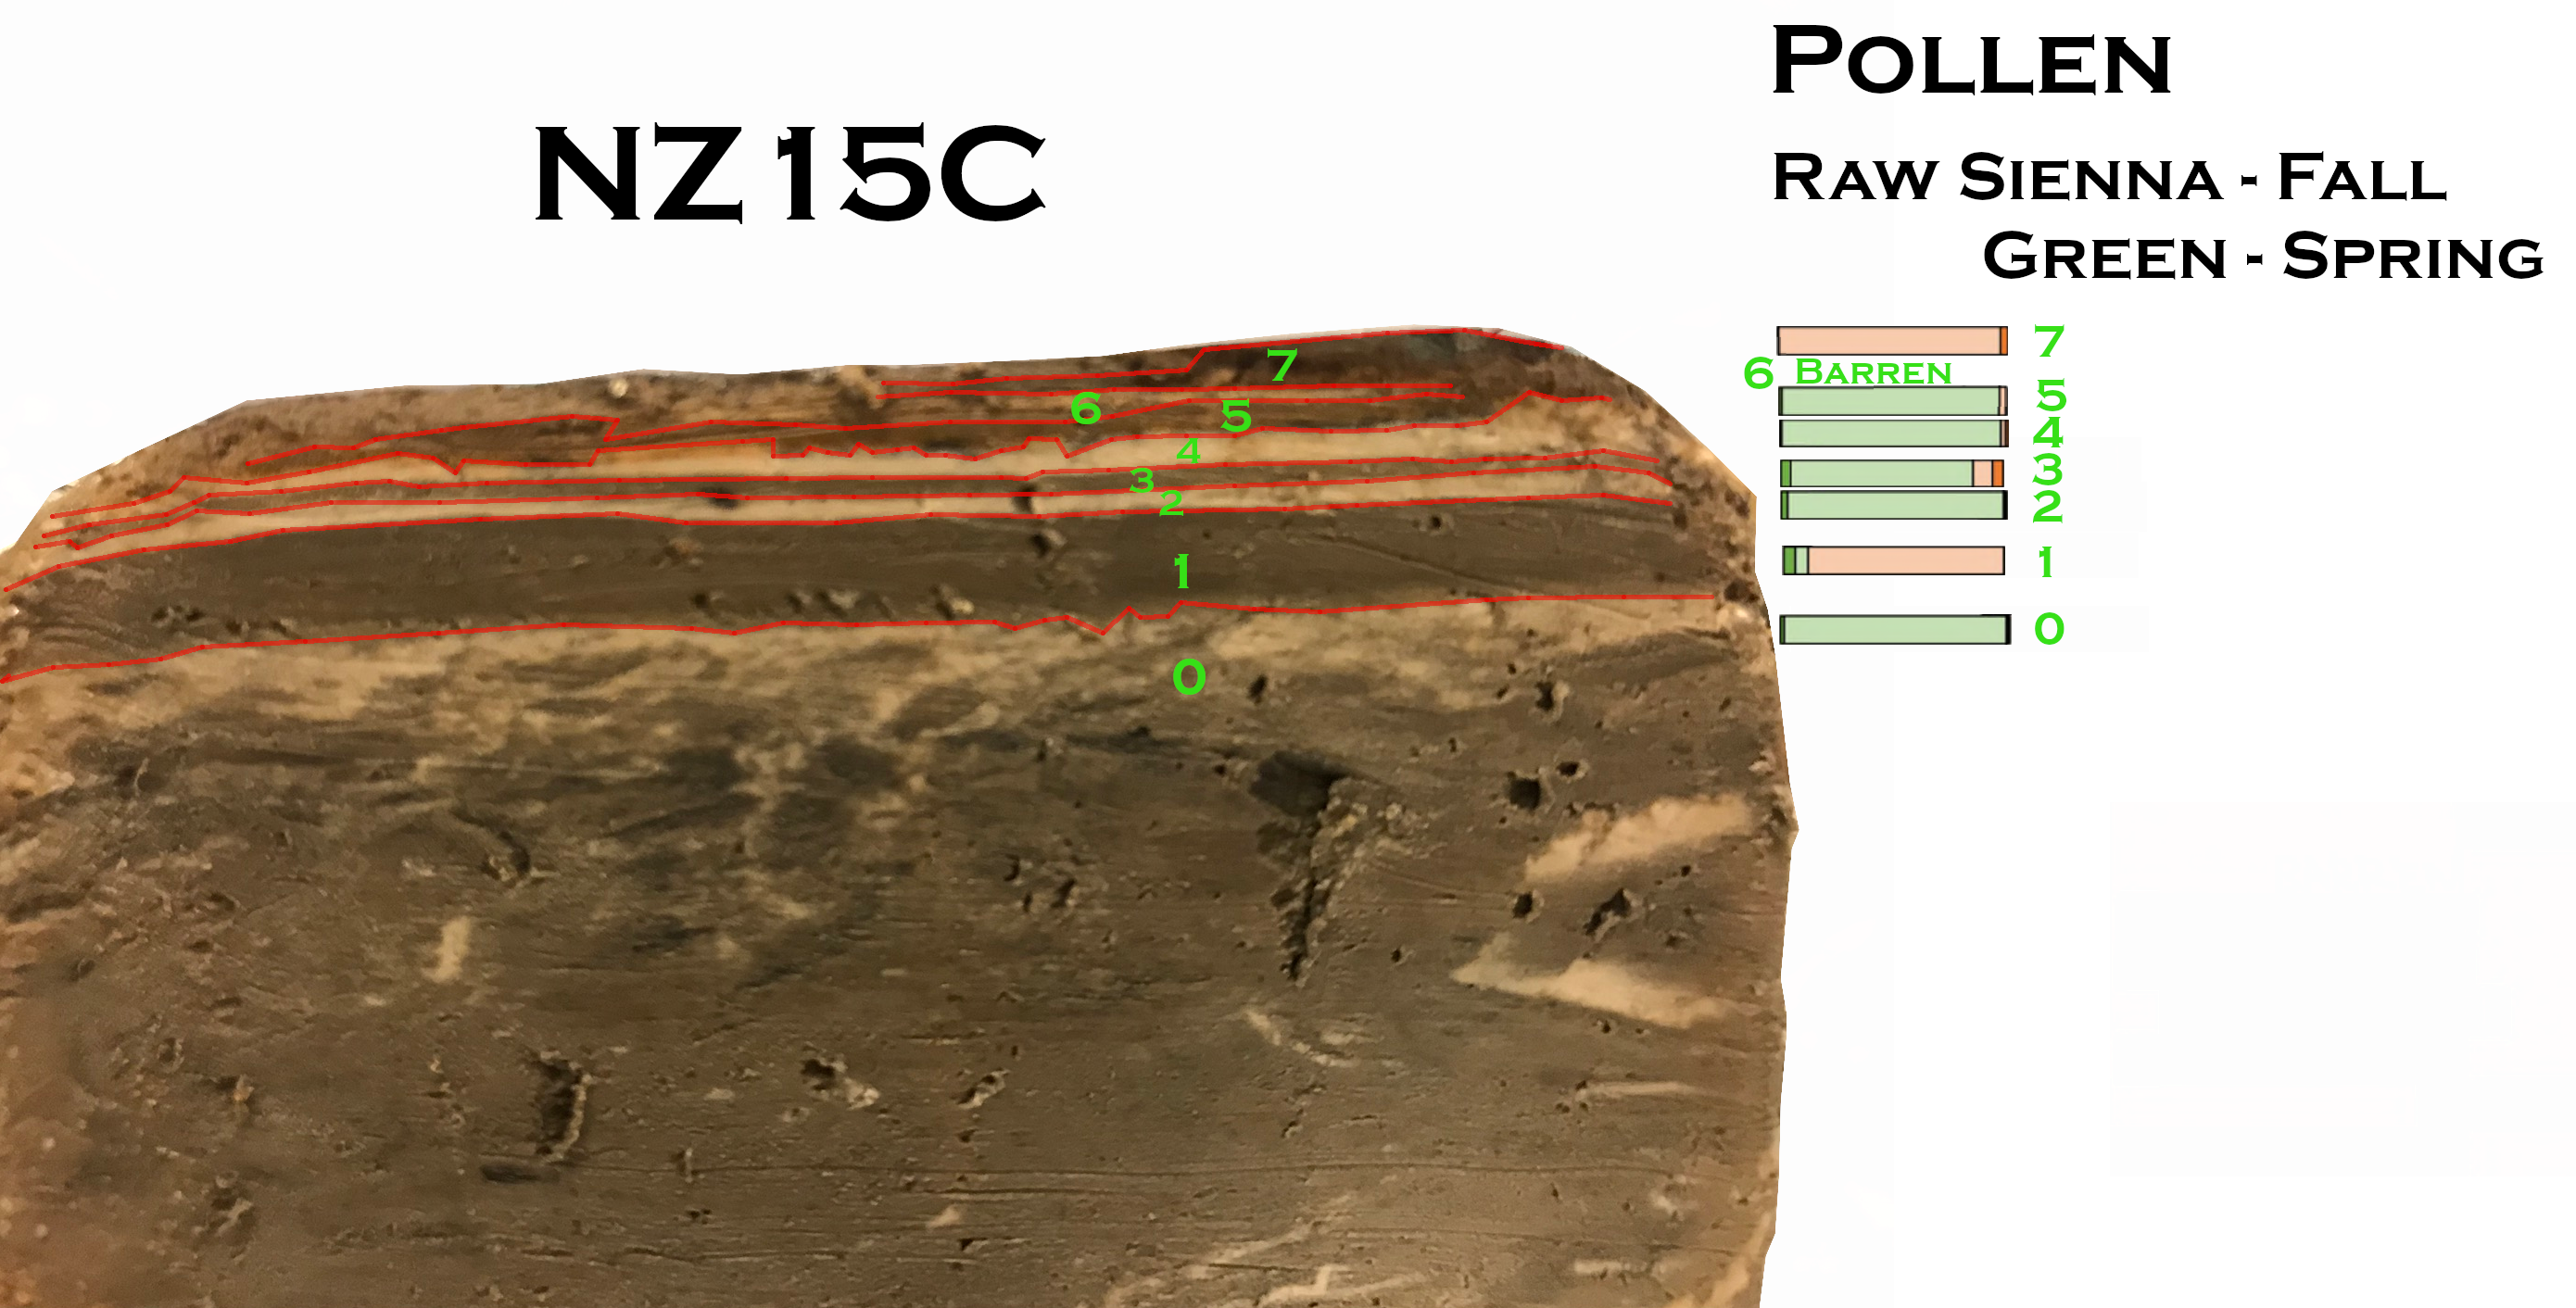 NZ15C in the Lab - Annotated with Pollen - Green is Spring
Click on Image to open in a new tab
Photo by JW
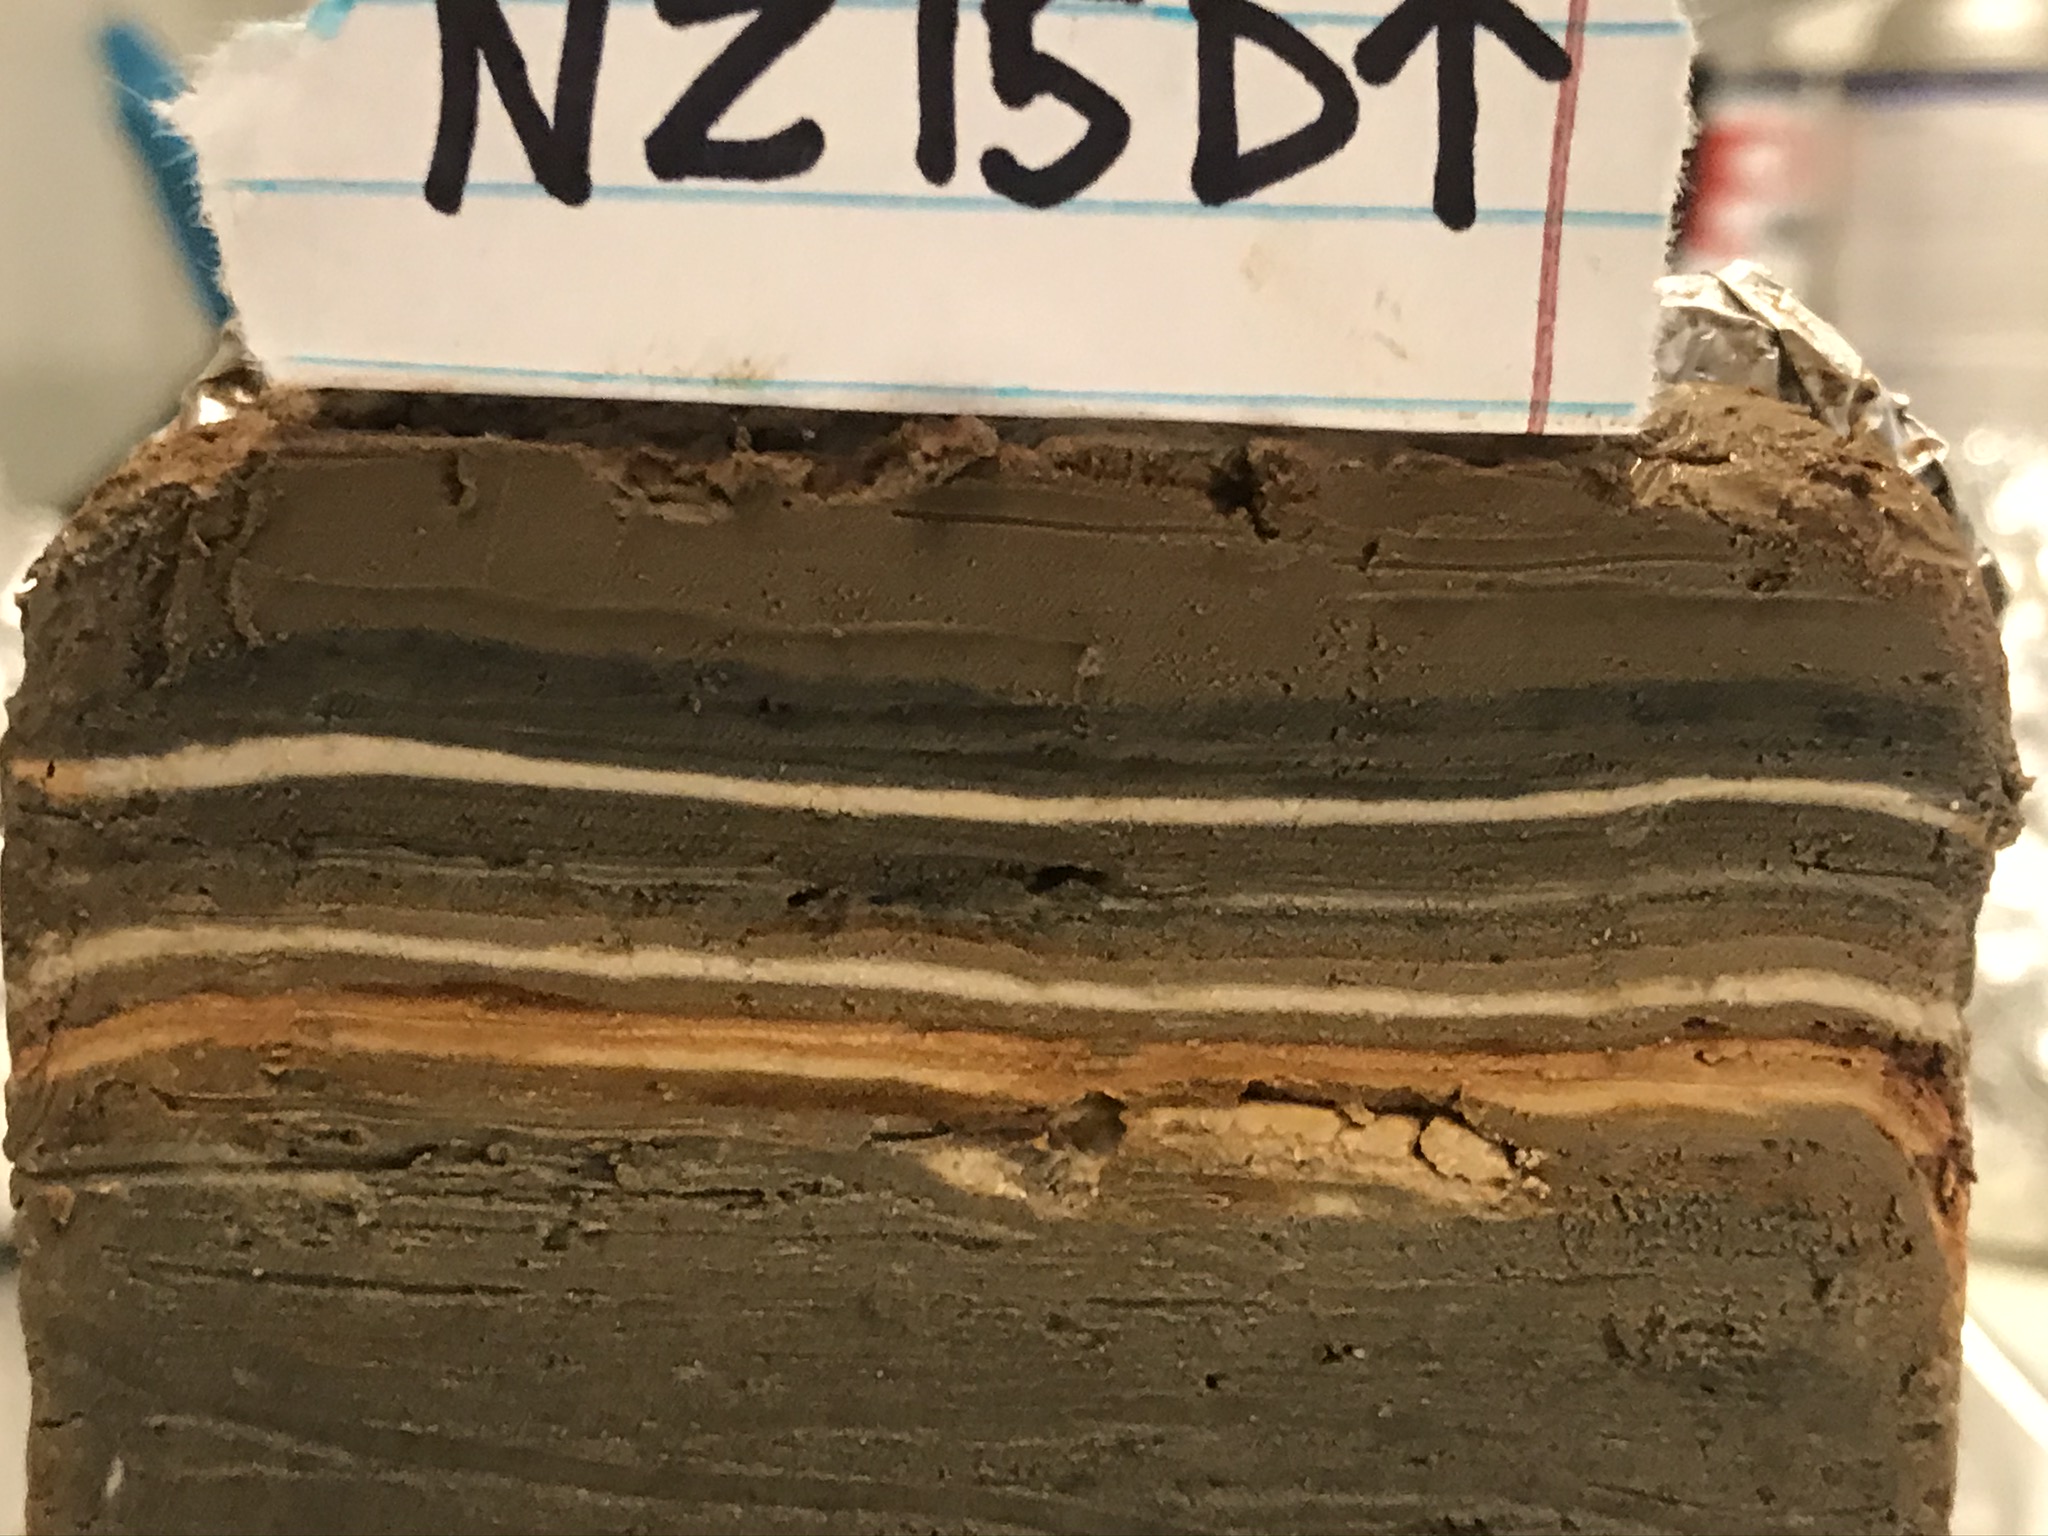
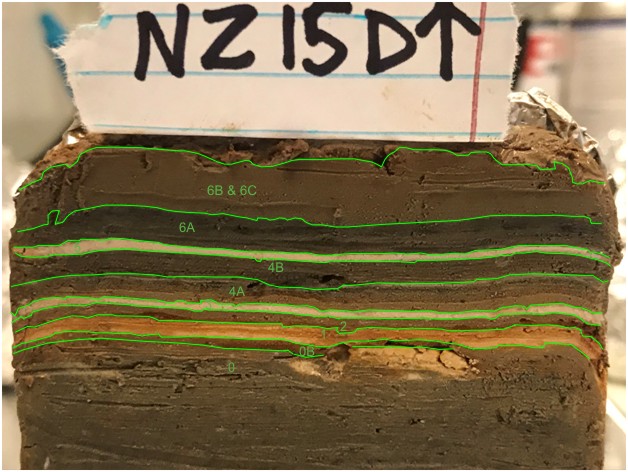
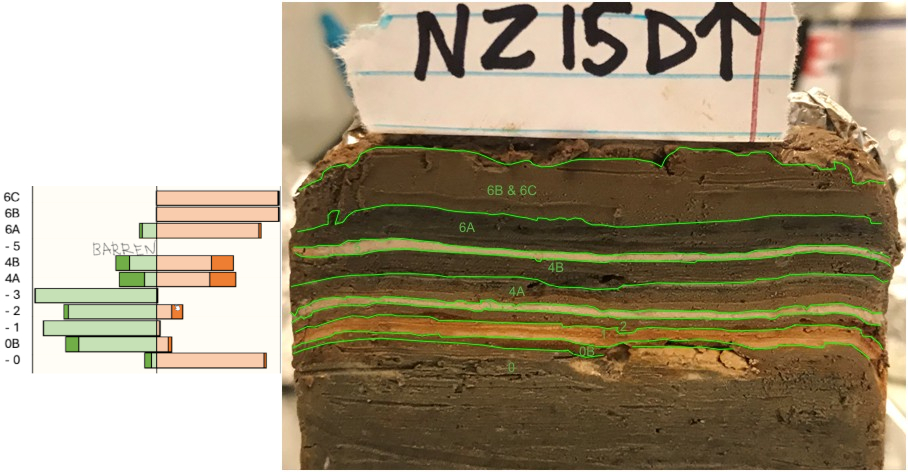
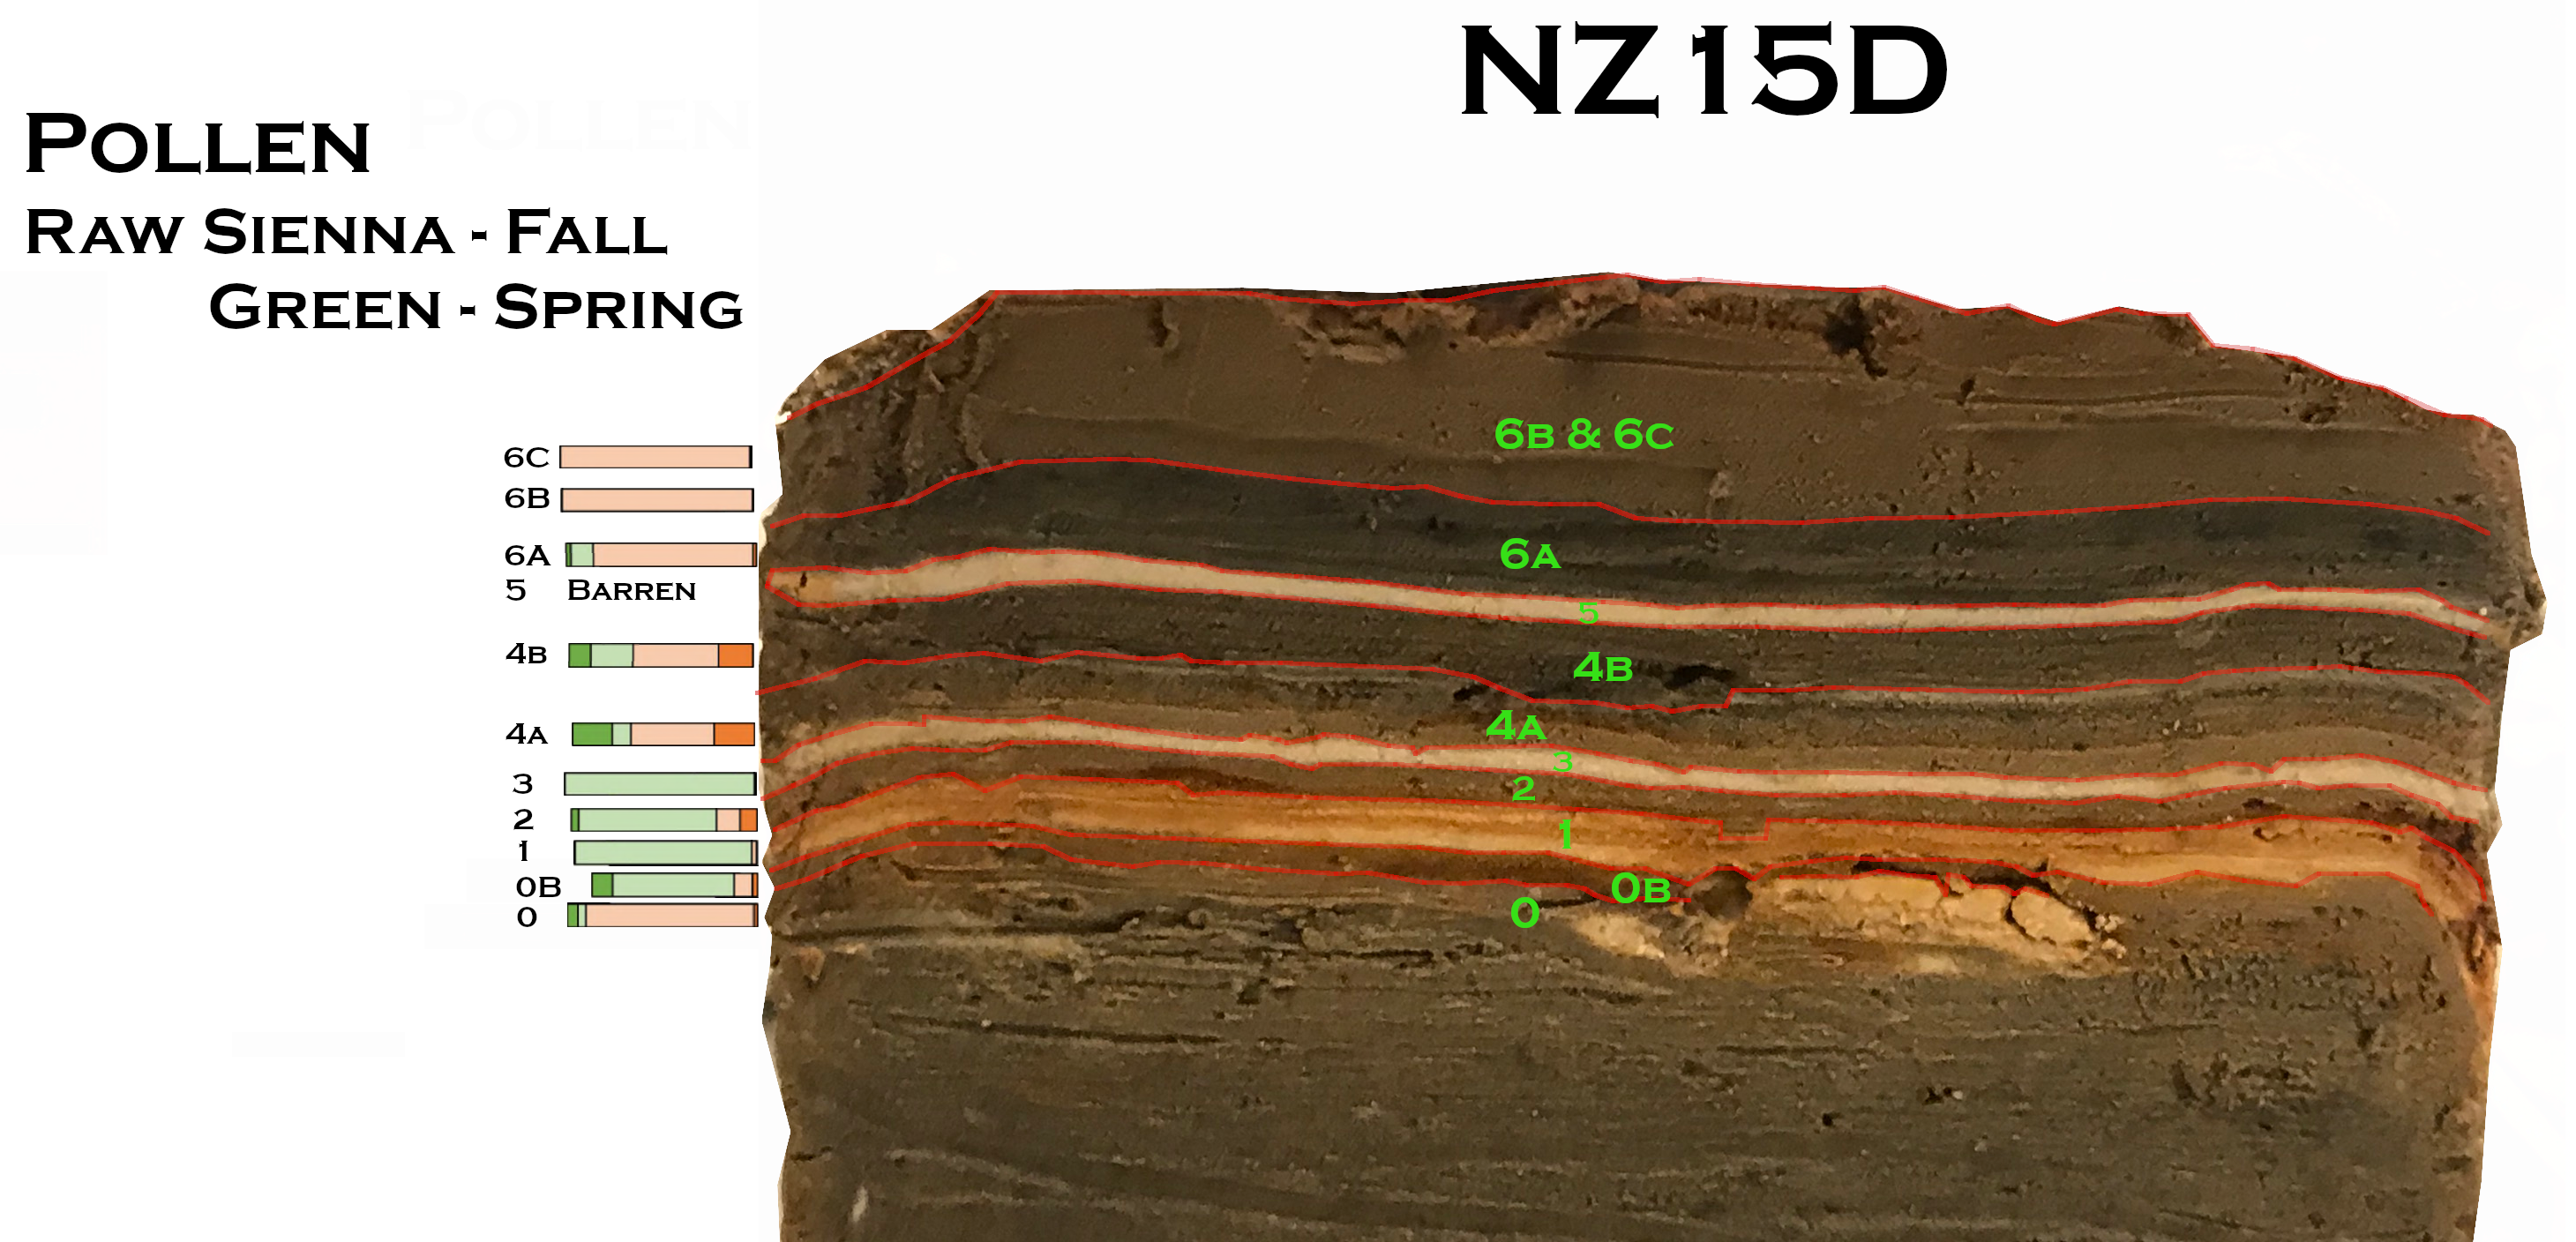 NZ15D in the Lab - Annotated with Pollen - Spring is Green
Click on Image to open in a new tab
Photo by JW
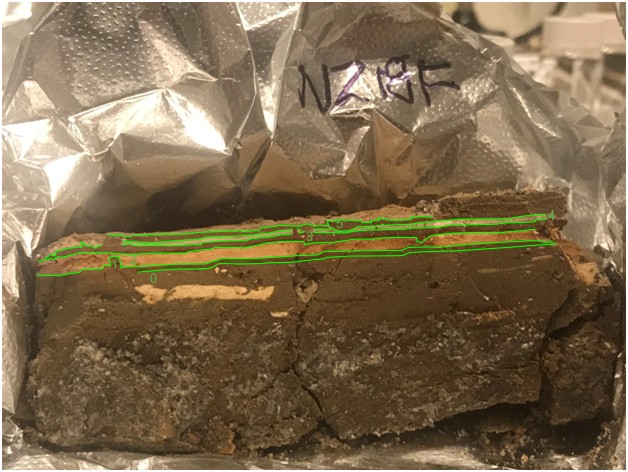
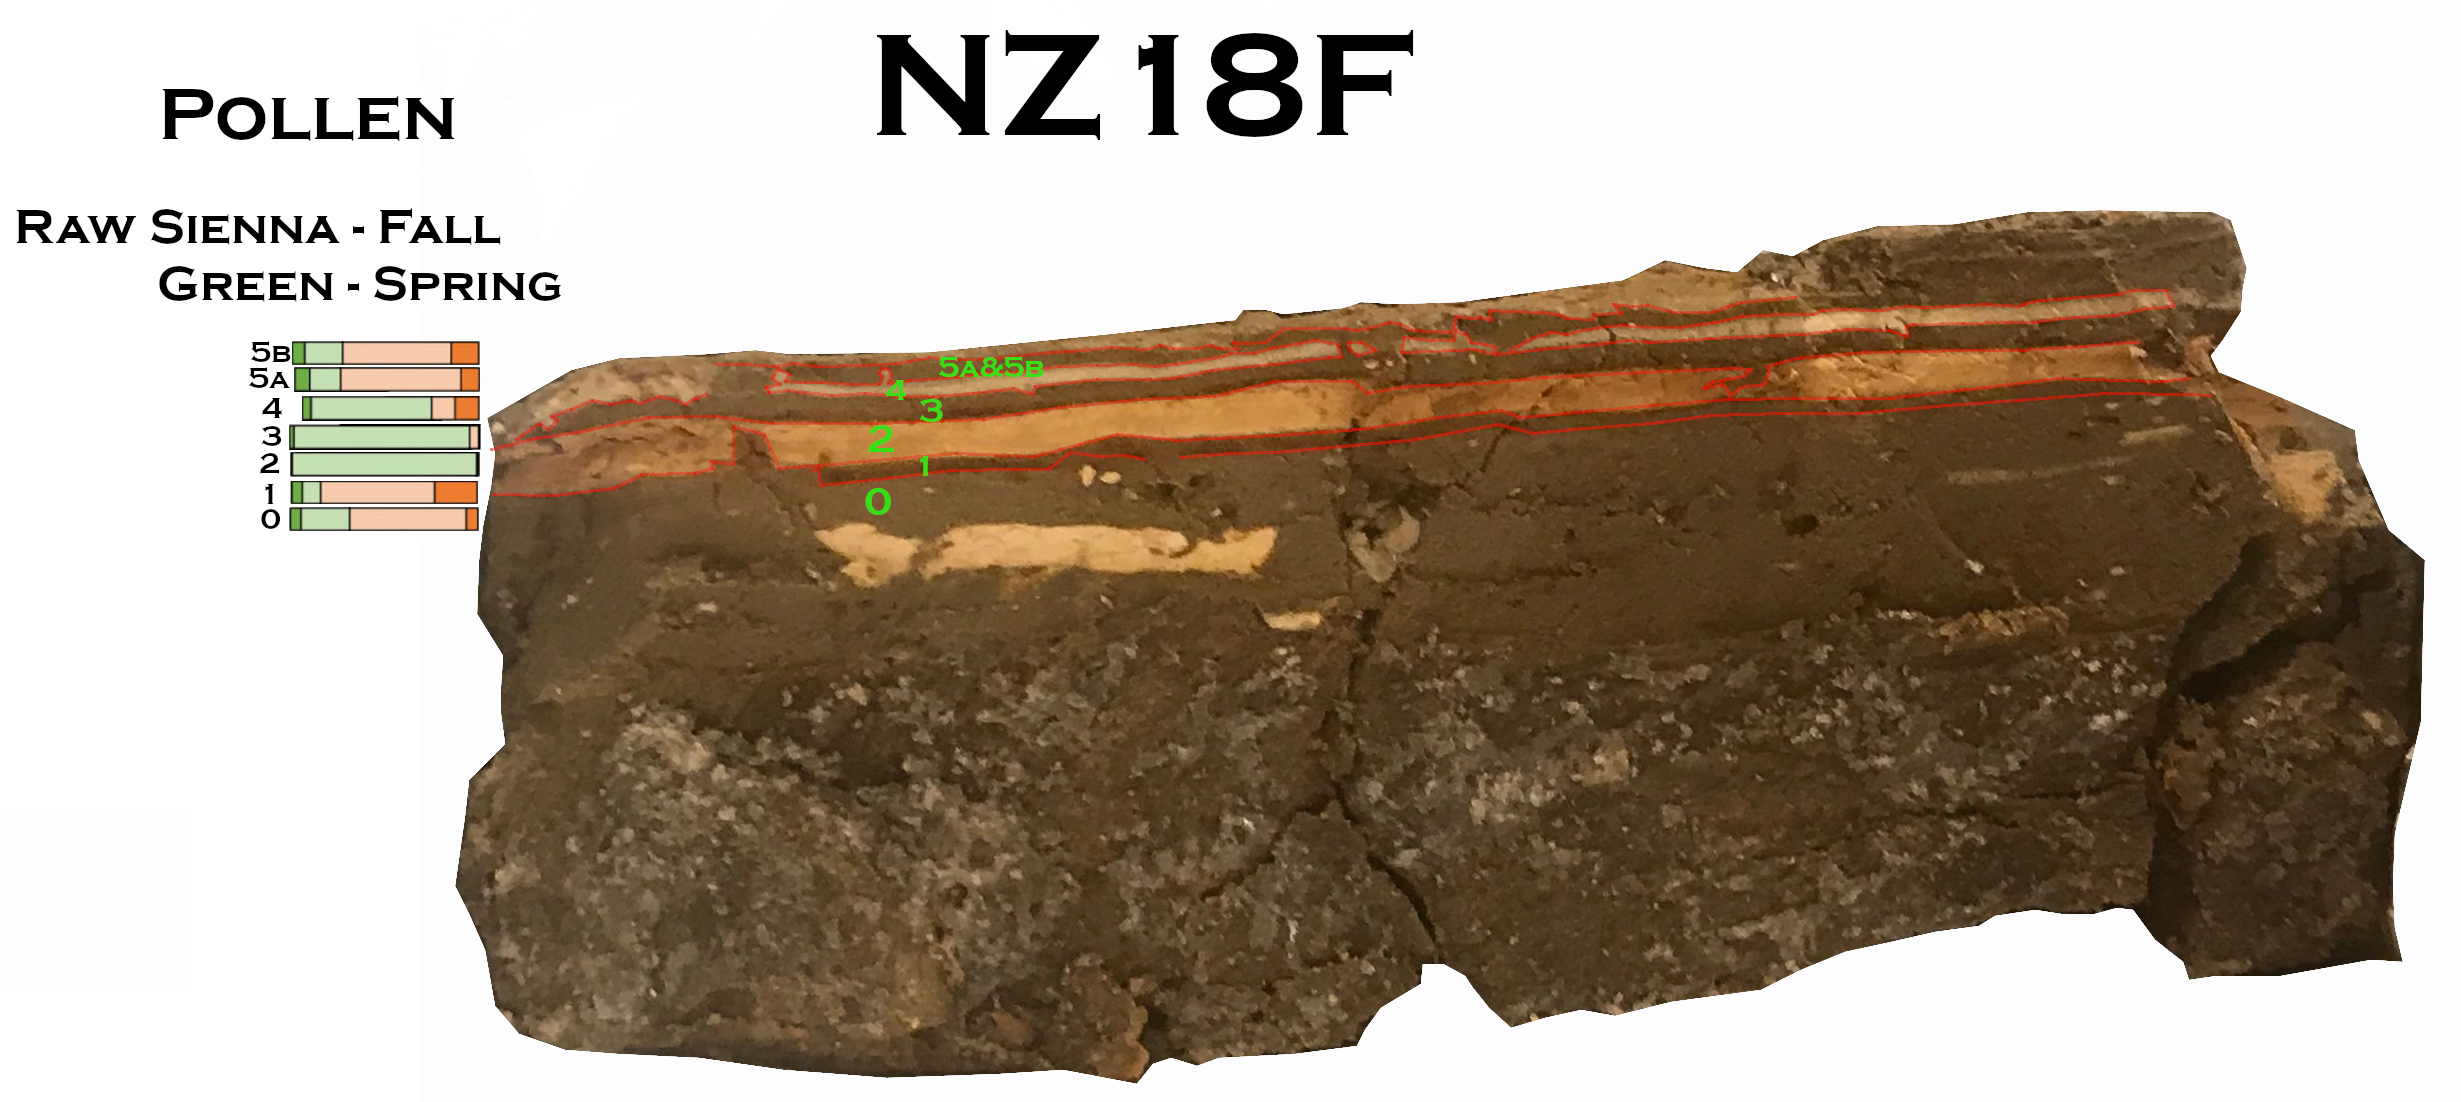 NZ18F in the Lab Annotated with POllen - Green is Spring
Click on Image to open in a new tab
Photo by JW
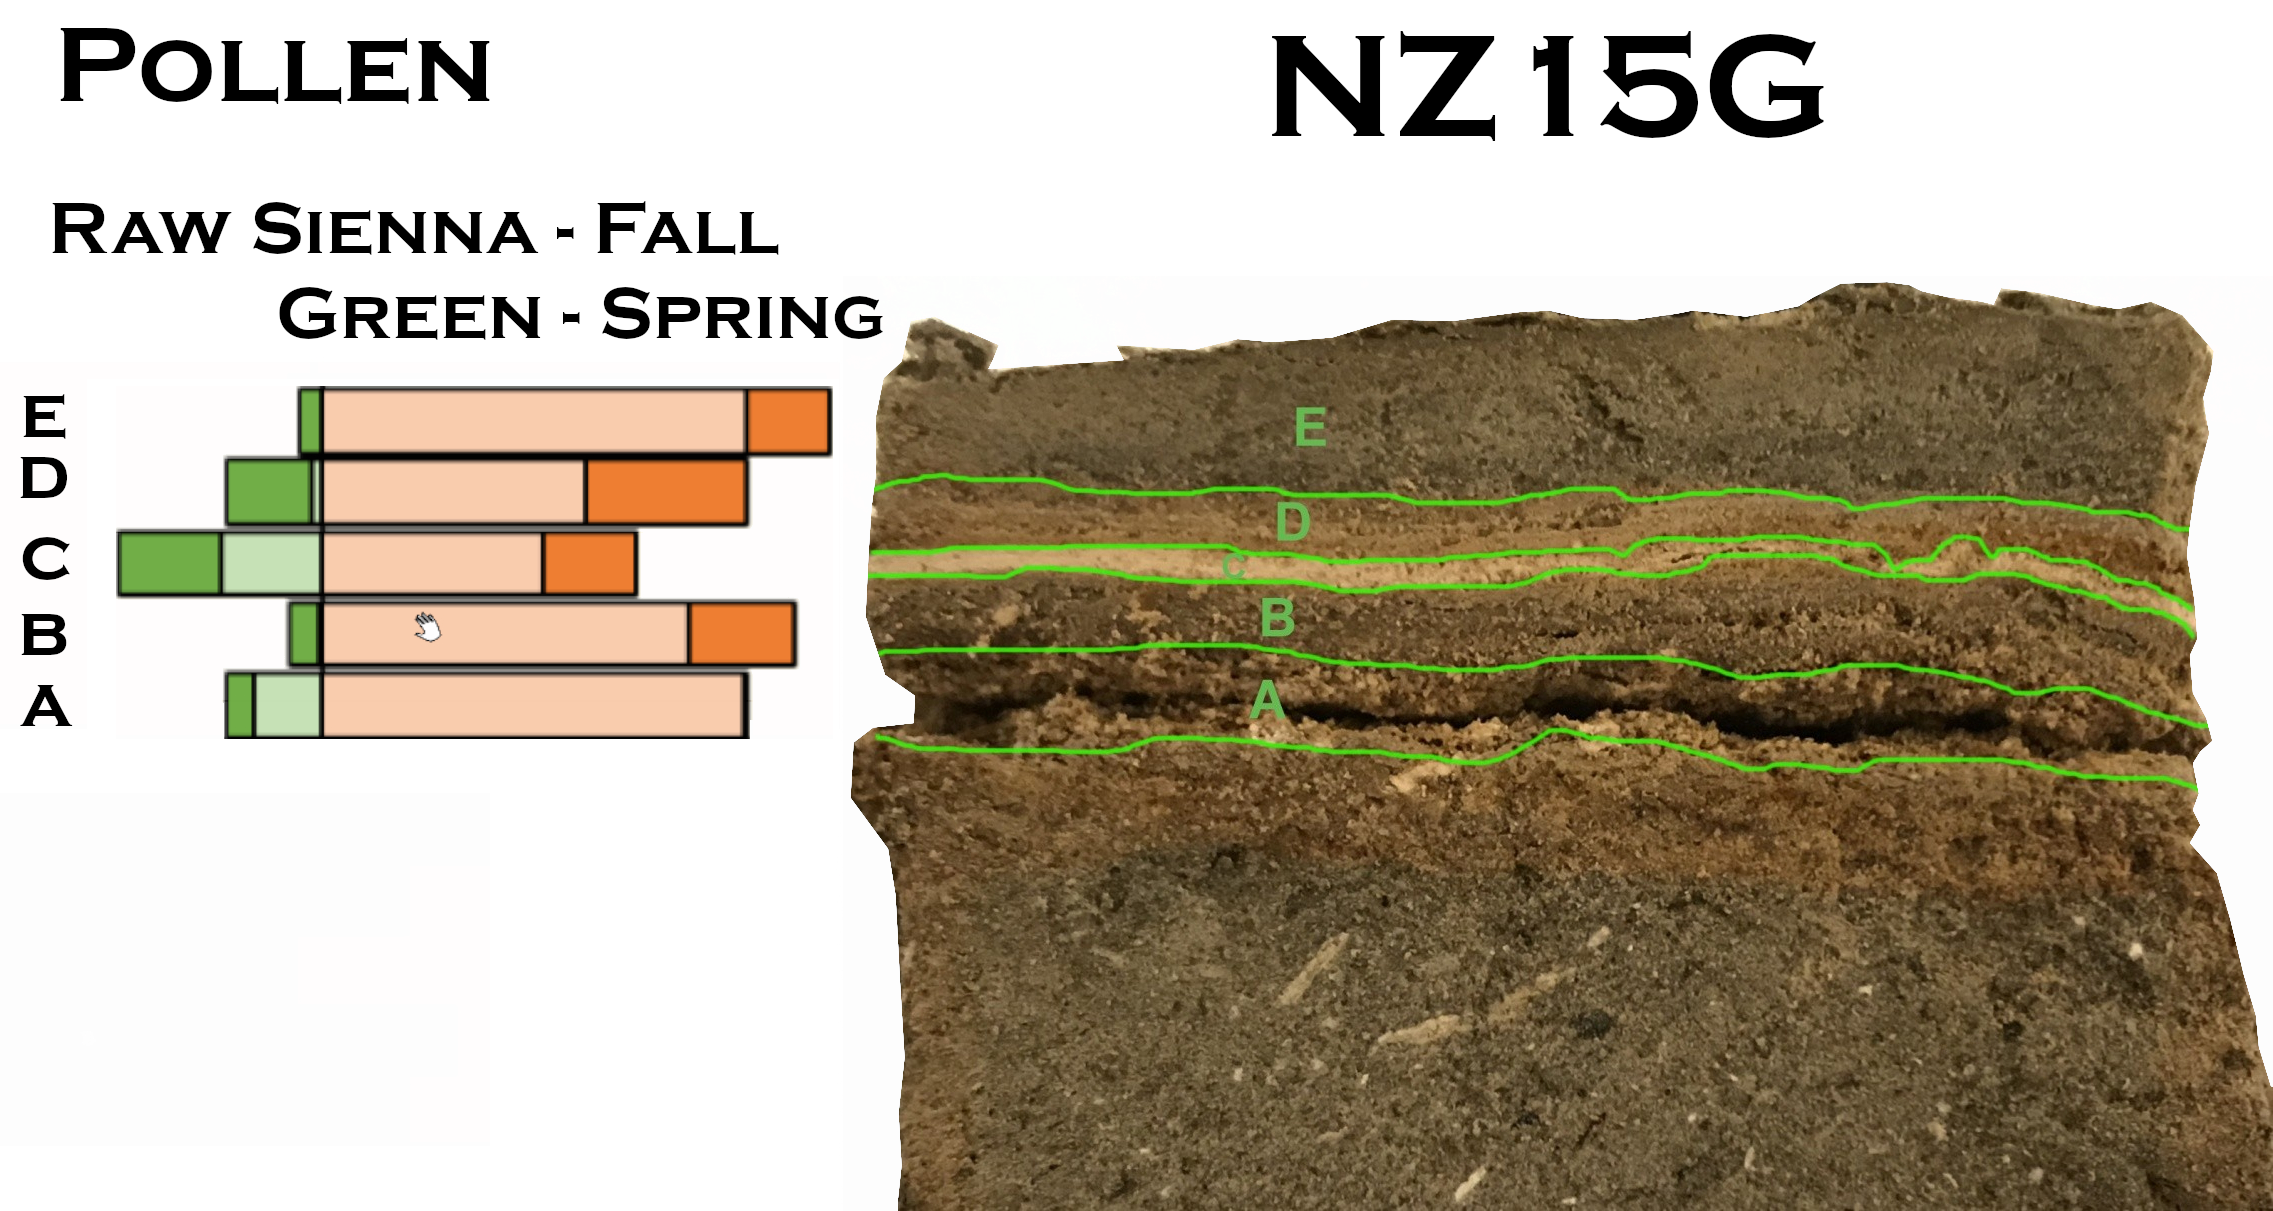 NZ15G in the Lab - Annotated with Pollen - Spring is Green
Click on Image to open in a new tab
Photo by JW
- Entire Middle Section
 Middle Section at ZA-4
Click on Image for high resolution magnifiable image
Photos by Jefferson Williams 04 Feb. 2023 - Bottom Part of Middle Section
 Bottom of Middle Section at ZA-4
Click on Image for high resolution magnifiable image
Photos by Jefferson Williams 04 Feb. 2023 - BaconQuake Bayesian Analysis
Bayesian Analysis of a section at Site ZA-4
Click on Image to open in a new tab
Run by Jefferson Williams on Radiocarbon samples collected in 2018 and 2023 using BACON and BACONQuake. Lake Level Curve from Bookman et al. (2004)
| RC Depth (cm) |
Sample Depth (cm) |
Thickness (cm) |
Quake | Sample Name |
InSitu Image | Extracted Image | Notes |
|---|---|---|---|---|---|---|---|
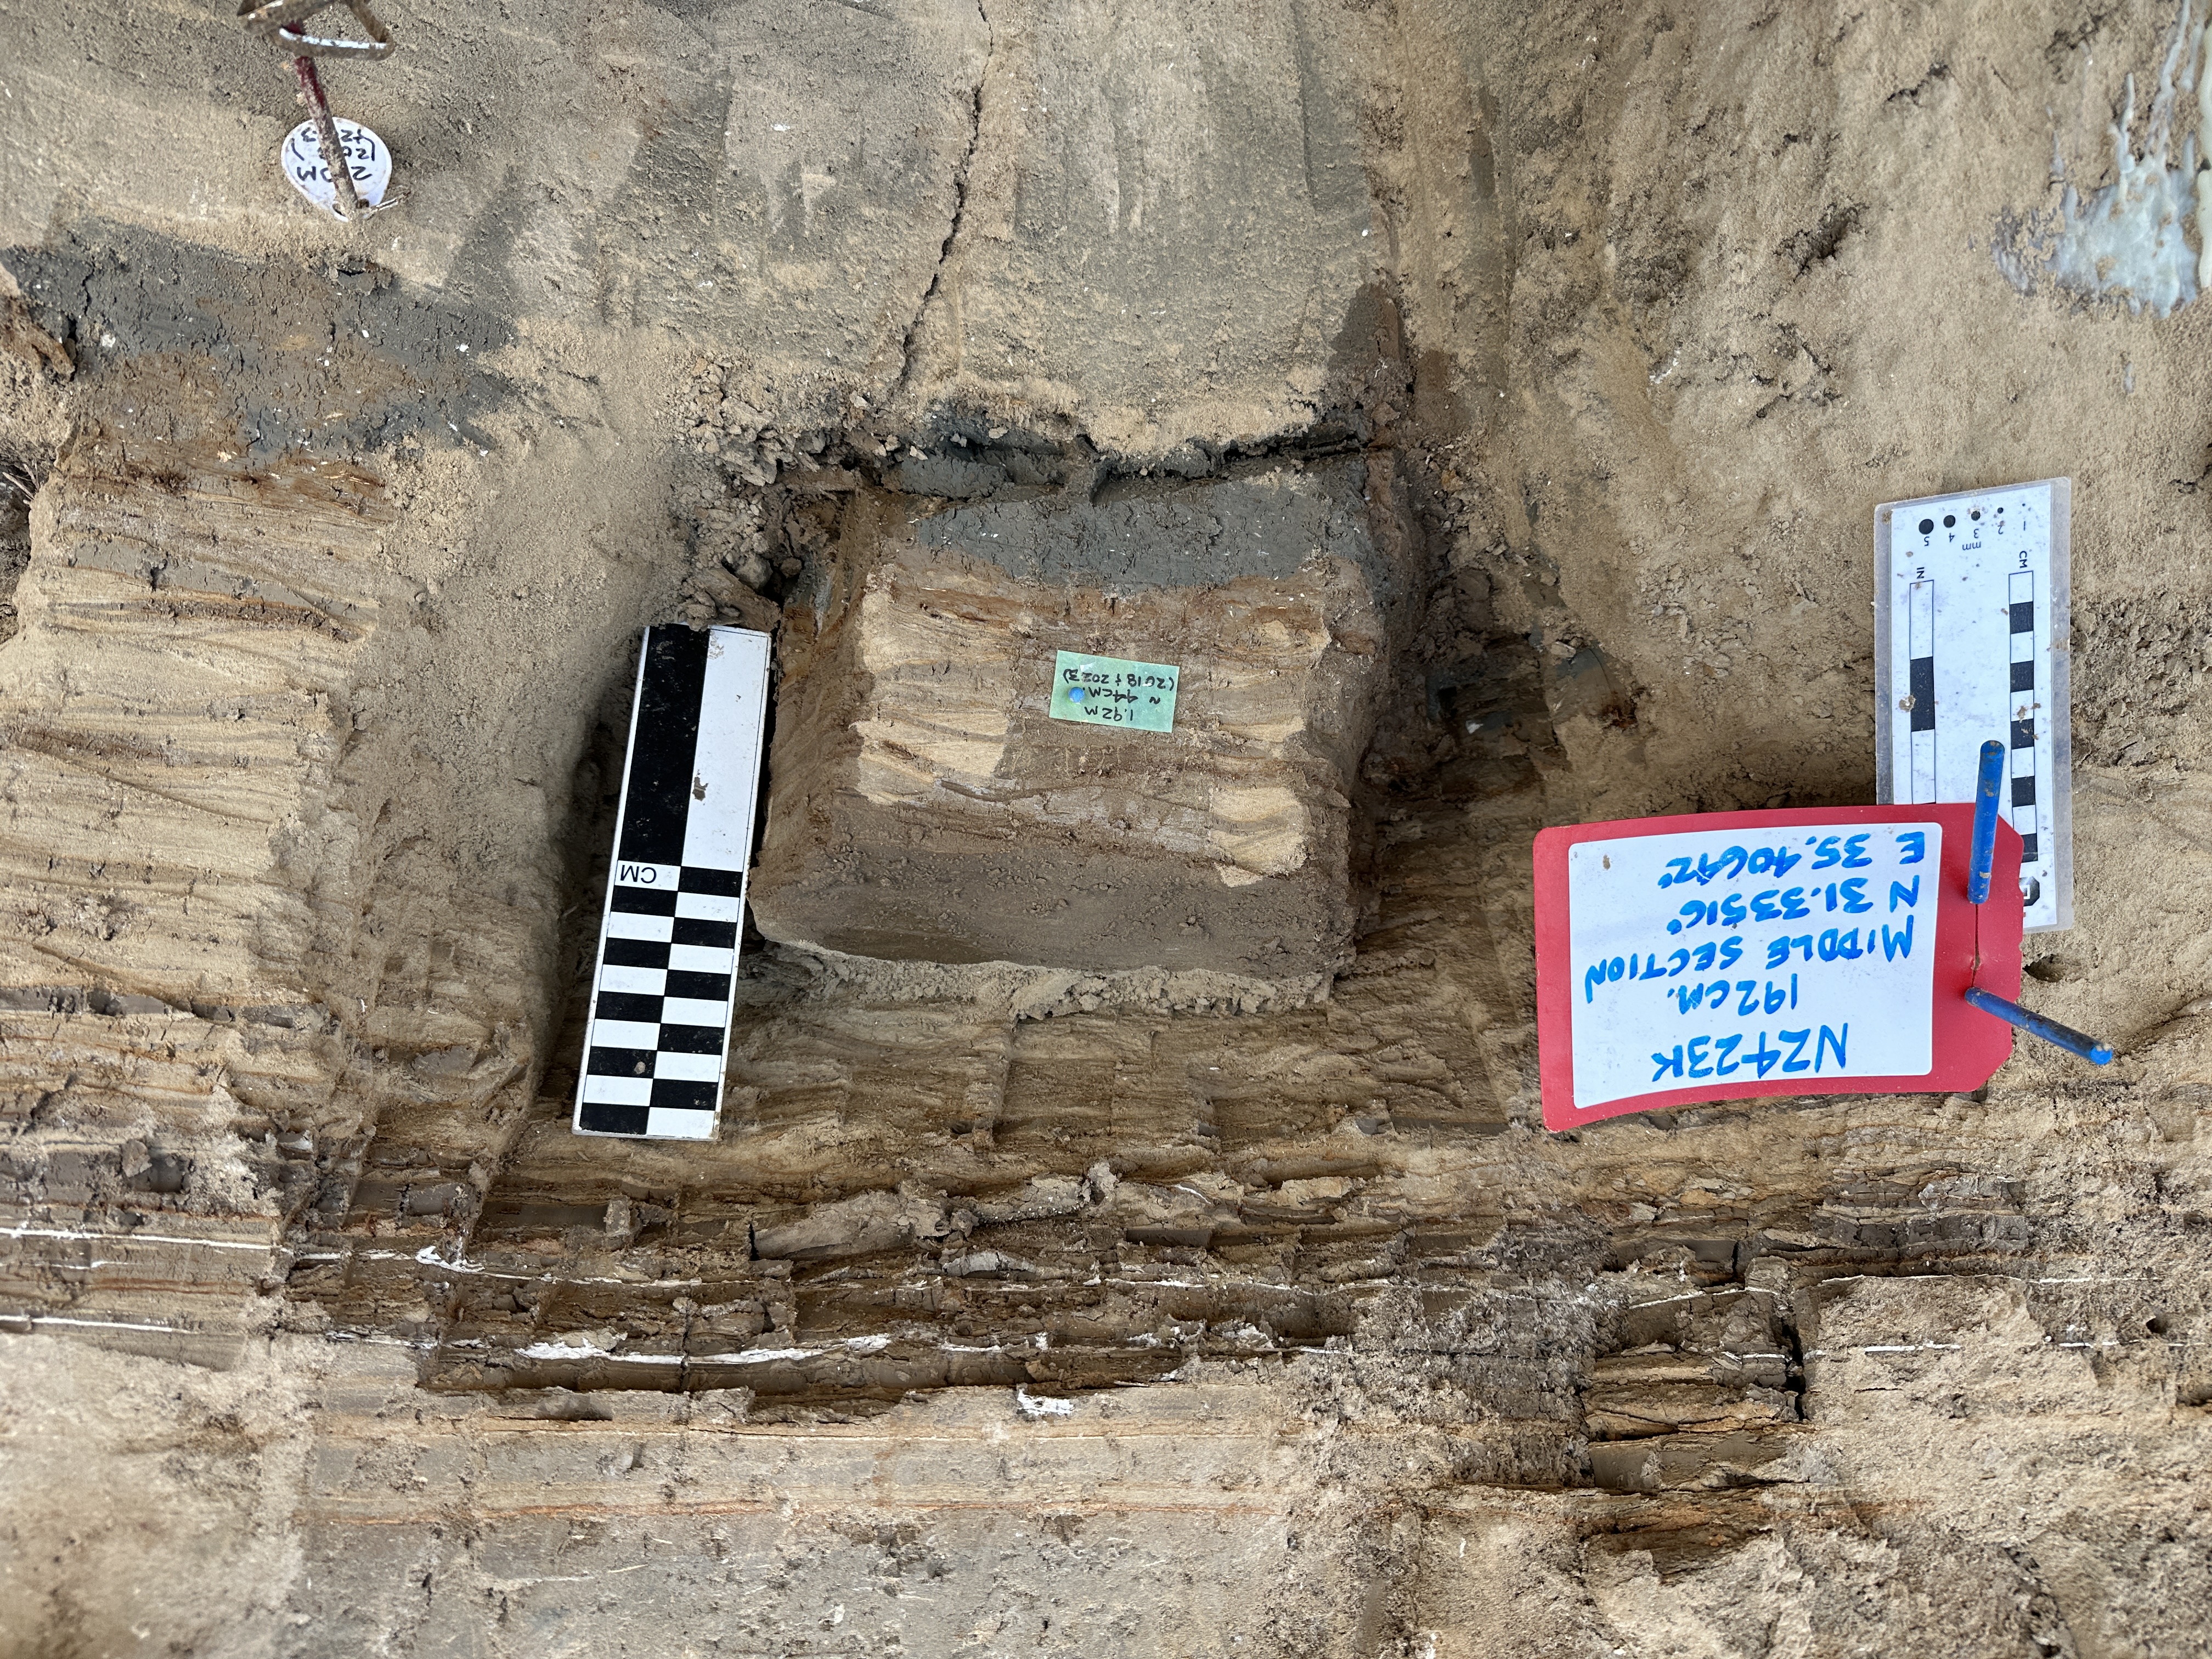
| 195 | 192 | ~44 | 419 CE | NZ423K |
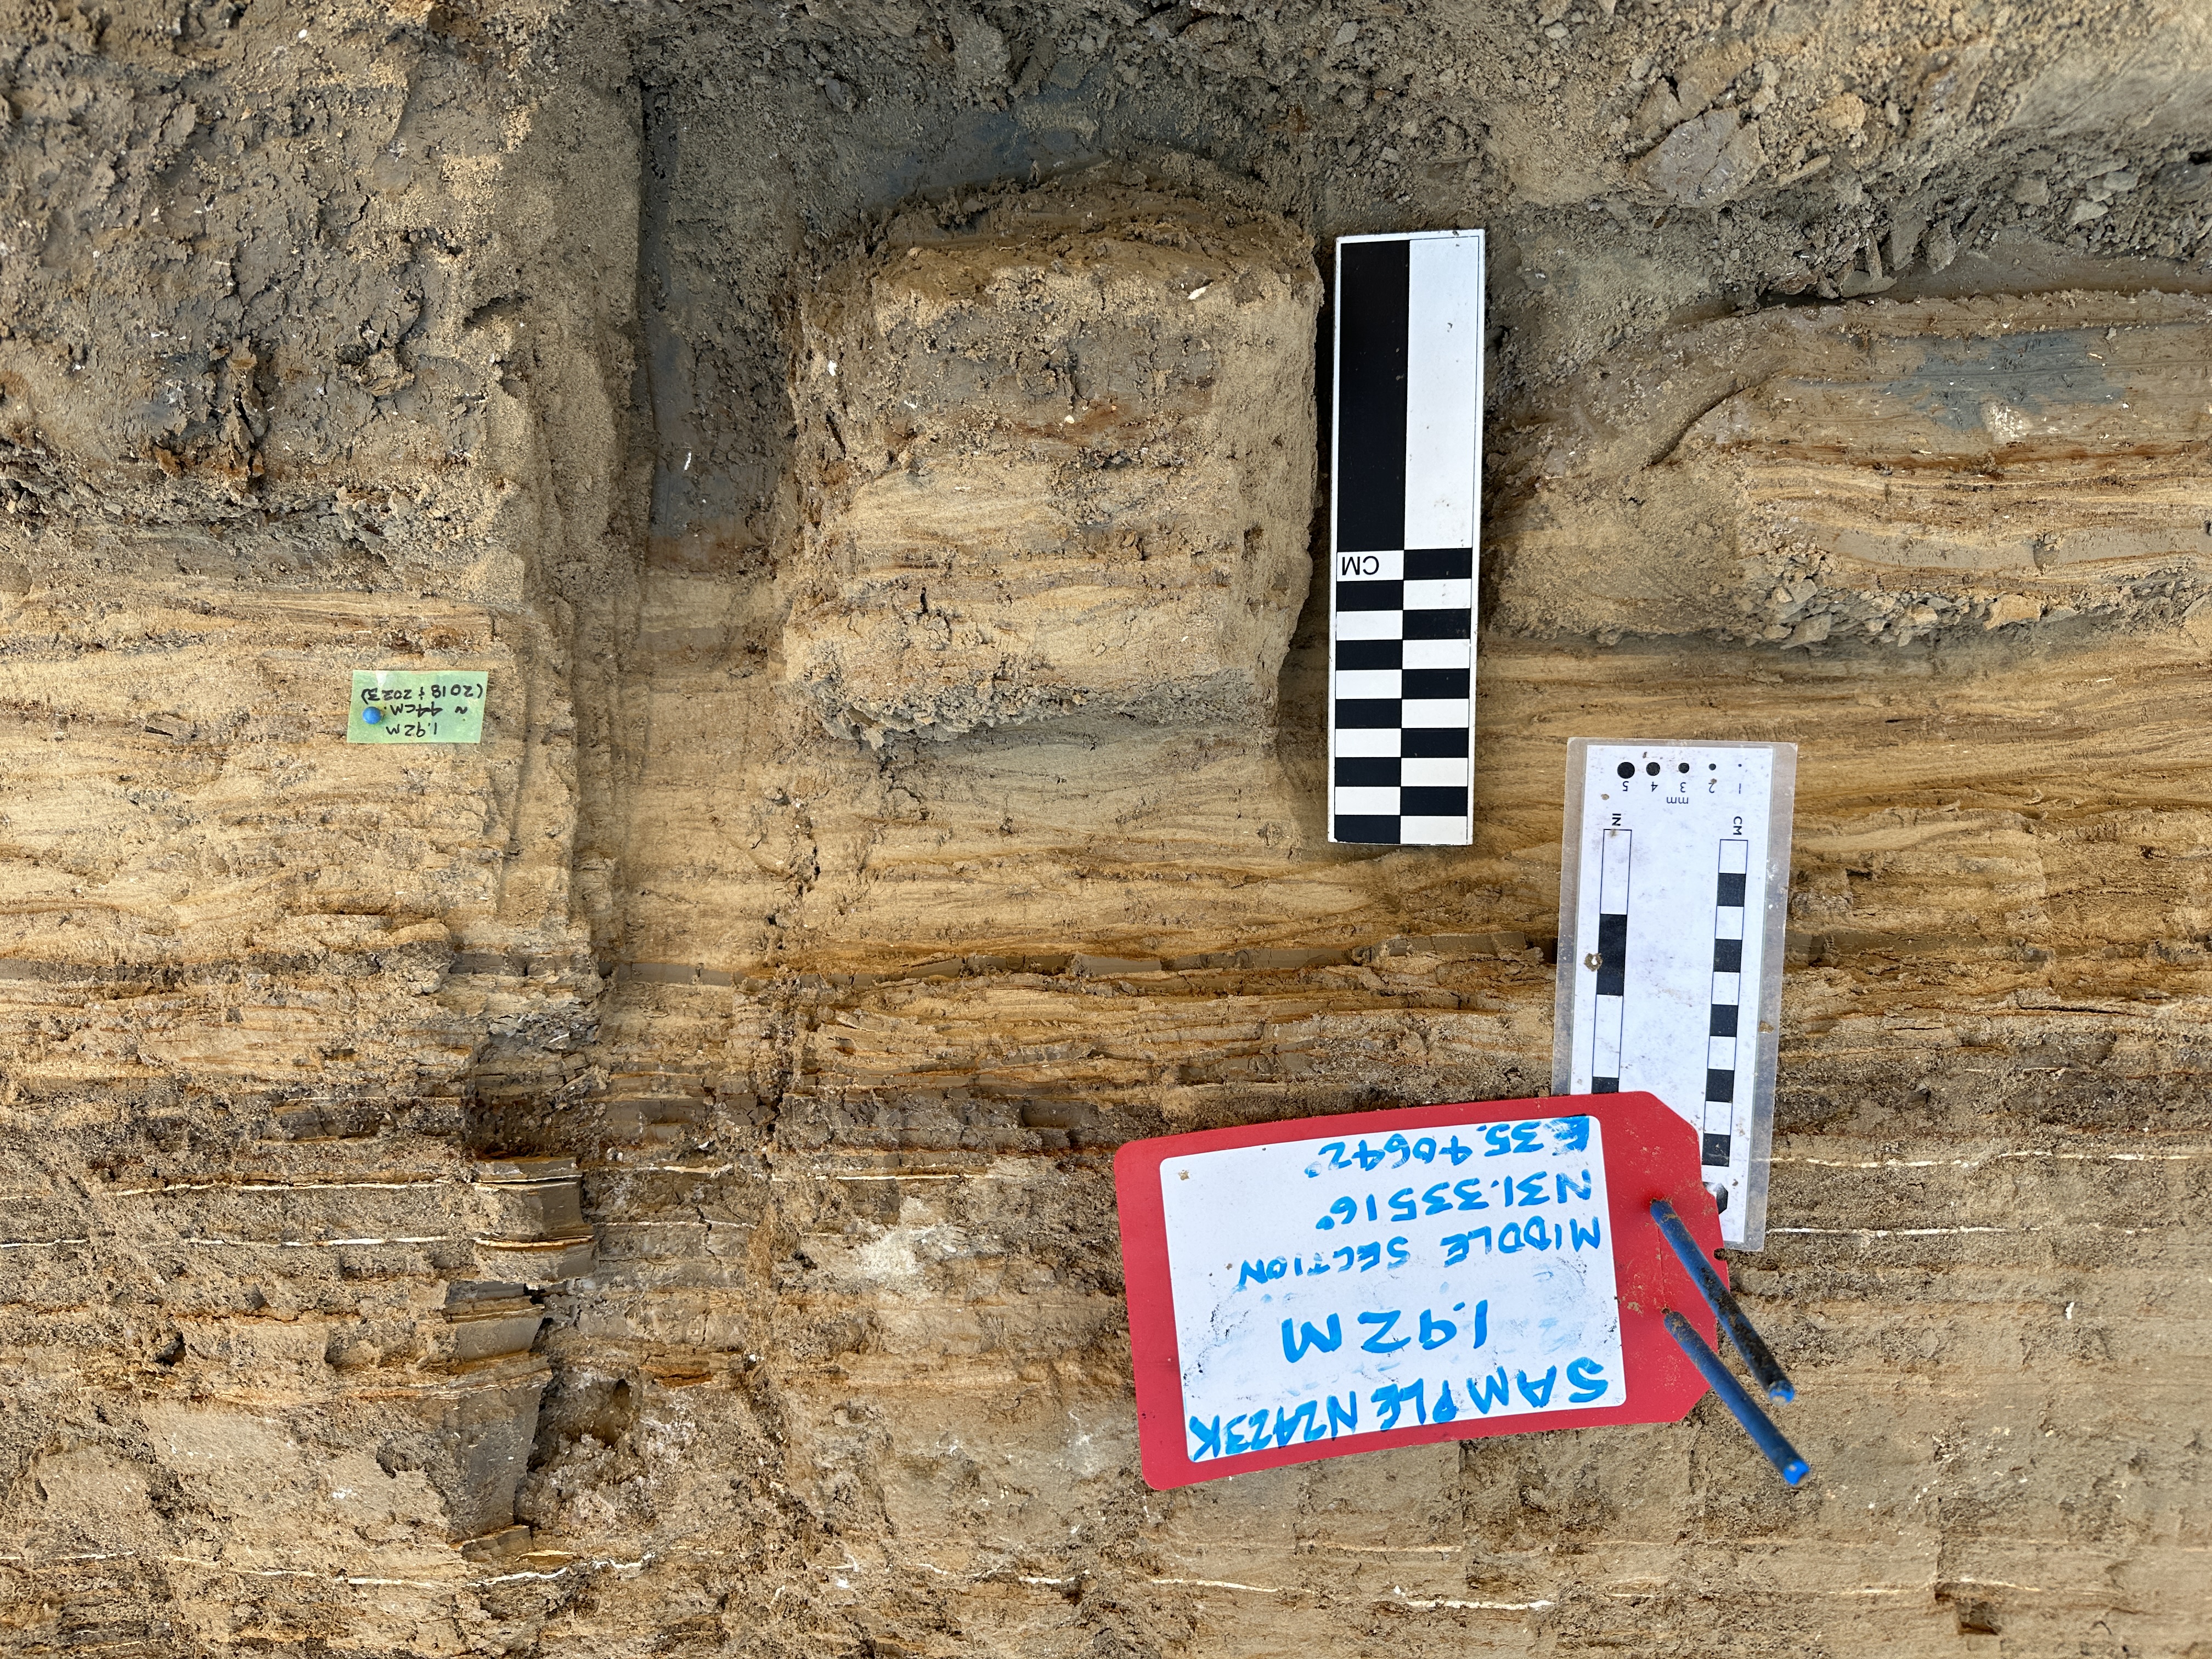 NZ423K in situ
Click on photo to open 3D Lidar Scan in a new tab Photo by Jefferson Williams 2023
NZ423K in situClick on photo to open high resolution magnifiable image in a new tab Photo by Jefferson Williams 2023  193 cm. seismite
Click on photo to open high resolution magnifiable image in a new tab Photo by Jefferson Williams 2023 |
 NZ423K after extraction and "shaving"
Click on photo to open 3D Lidar Scan in a new tab Photo by Jefferson Williams 2023 |
|
| 195 | 192 | ~44 | 419 CE | NZ423K - resample |
 NZ423K resample in situ
Click on photo to open 3D Lidar Scan in a new tab Photo by Jefferson Williams 2023
NZ423K resample in situClick on photo to open high resolution magnifiable image in a new tab Photo by Jefferson Williams 2023
193 cm. seismiteClick on photo to open high resolution magnifiable image in a new tab Photo by Jefferson Williams 2023 |
Top Top of NZ423K resample after extraction and "shaving"
Click on photo to open 3D Lidar Scan in a new tab Photo by Jefferson Williams 2023 Bottom  Bottom of NZ423K resample after extraction and "shaving"
Click on photo to open 3D Lidar Scan in a new tab Photo by Jefferson Williams 2023 |
|
| 240 | 251 (2018) 249 (2023) |
16 (2018) 16 (2023) |
363 CE | NZ423I |
 NZ423I in situ
Click on photo to open high resolution magnifiable image in a new tab Photo by Jefferson Williams 2023 |
 NZ423I after extraction and "shaving" (rightside up)
Click on photo to open 3D Lidar Scan in a new tab (Sample is upside down in new tab) Photo by Jefferson Williams 2023 |
|
| 380 | 400 (2023) 389 (2018) |
7.5 (2018) 7.5 (2023) |
~31 CE | NZ423A |
 NZ423A in situ
Click on photo to open high resolution magnifiable image in a new tab Photo by Jefferson Williams 2023 |
 NZ423A after extraction and "shaving"
Click on photo to open 3D Lidar Scan in a new tab Photo by Jefferson Williams 2023 |
| RC Depth (cm) |
Sample Depth (cm) |
Thickness (cm) |
Quake | Sample Name |
InSitu Image | Extracted Image | Notes |
|---|---|---|---|---|---|---|---|
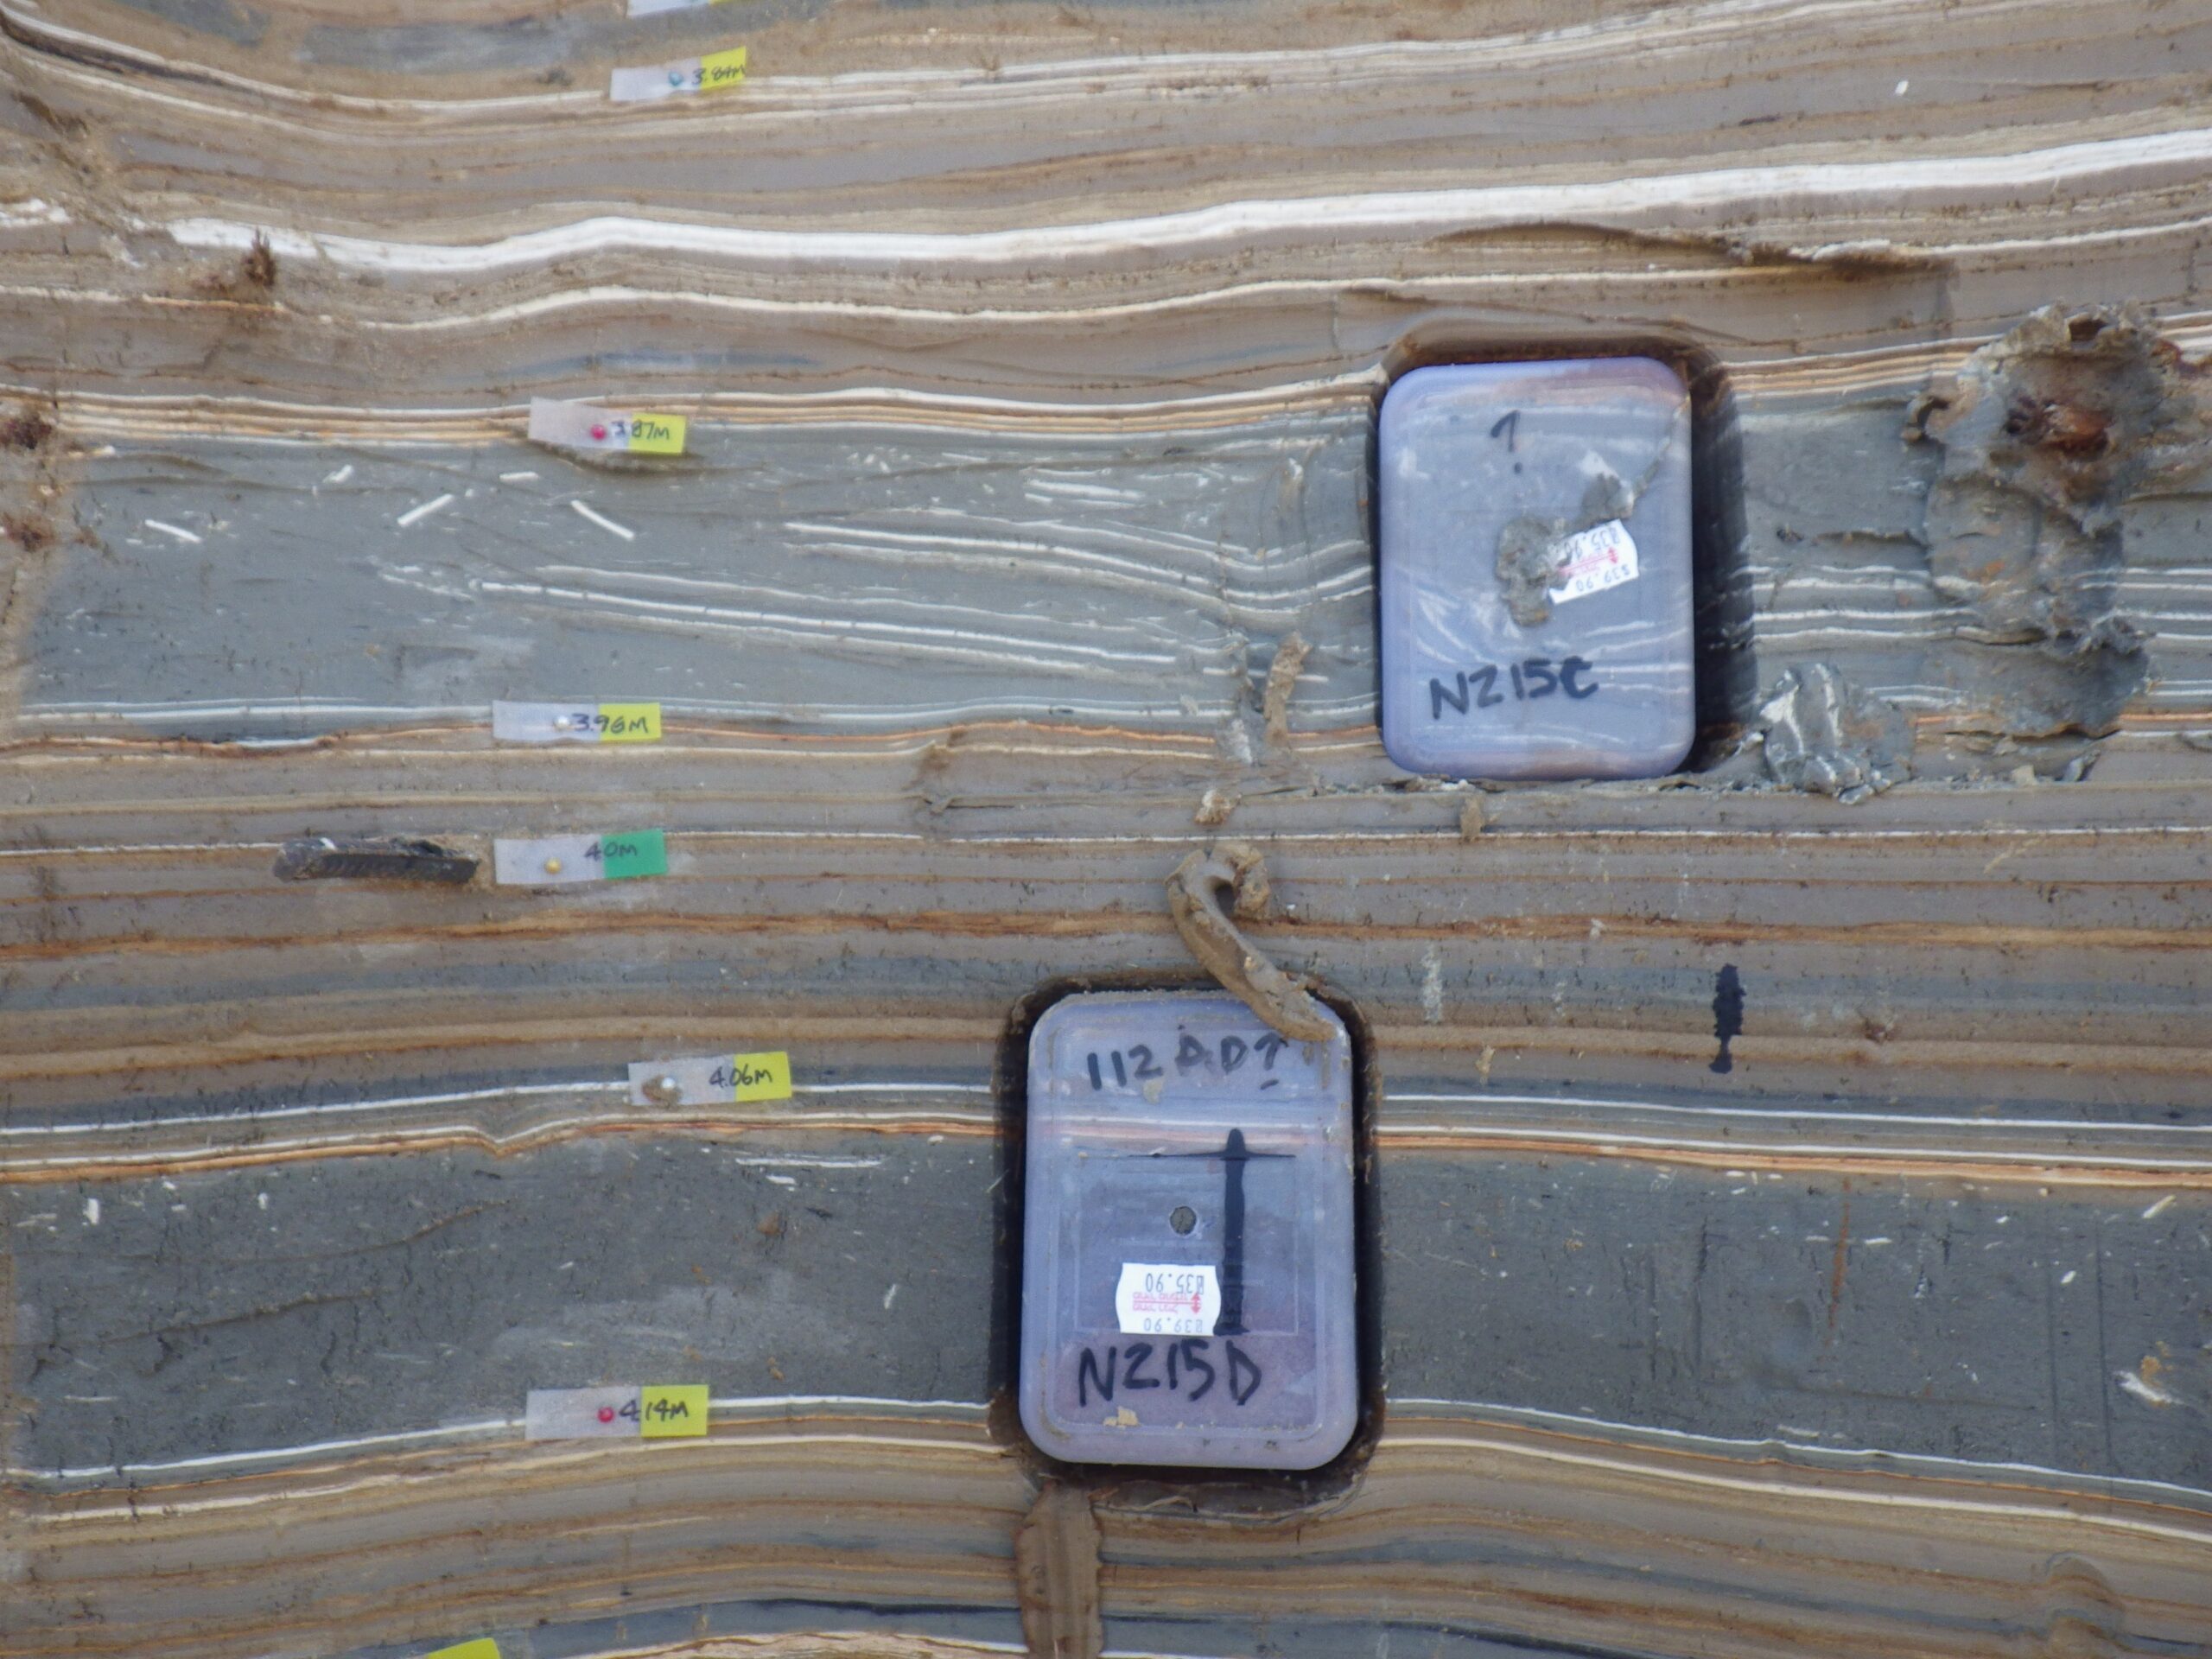
| 387 | 12 | NZ415C |
 NZ415C and NZ415D in situ
Click on photo to open magnifiable image in a new tab Photo by Jefferson Williams 2015 |
 Hardened Sample NZ415C
Click on photo to open magnifiable image in a new tab Photo by Jefferson Williams  Thin Section of Sample NZ415C
Click on photo to open magnifiable image in a new tab Photo by Jefferson Williams |
|||
| 406 | 8 | NZ415D |
NZ415C and NZ415D in situ Click on photo to open magnifiable image in a new tab Photo by Jefferson Williams 2015 |
 Hardened Sample NZ415D
Click on photo to open magnifiable image in a new tab Photo by Jefferson Williams  Slide Billet Sample NZ415D
Click on photo to open magnifiable image in a new tab Photo by Jefferson Williams  Thin Section Slide Sample NZ415D
Click on photo to open magnifiable image in a new tab Photo by Jefferson Williams |
|||
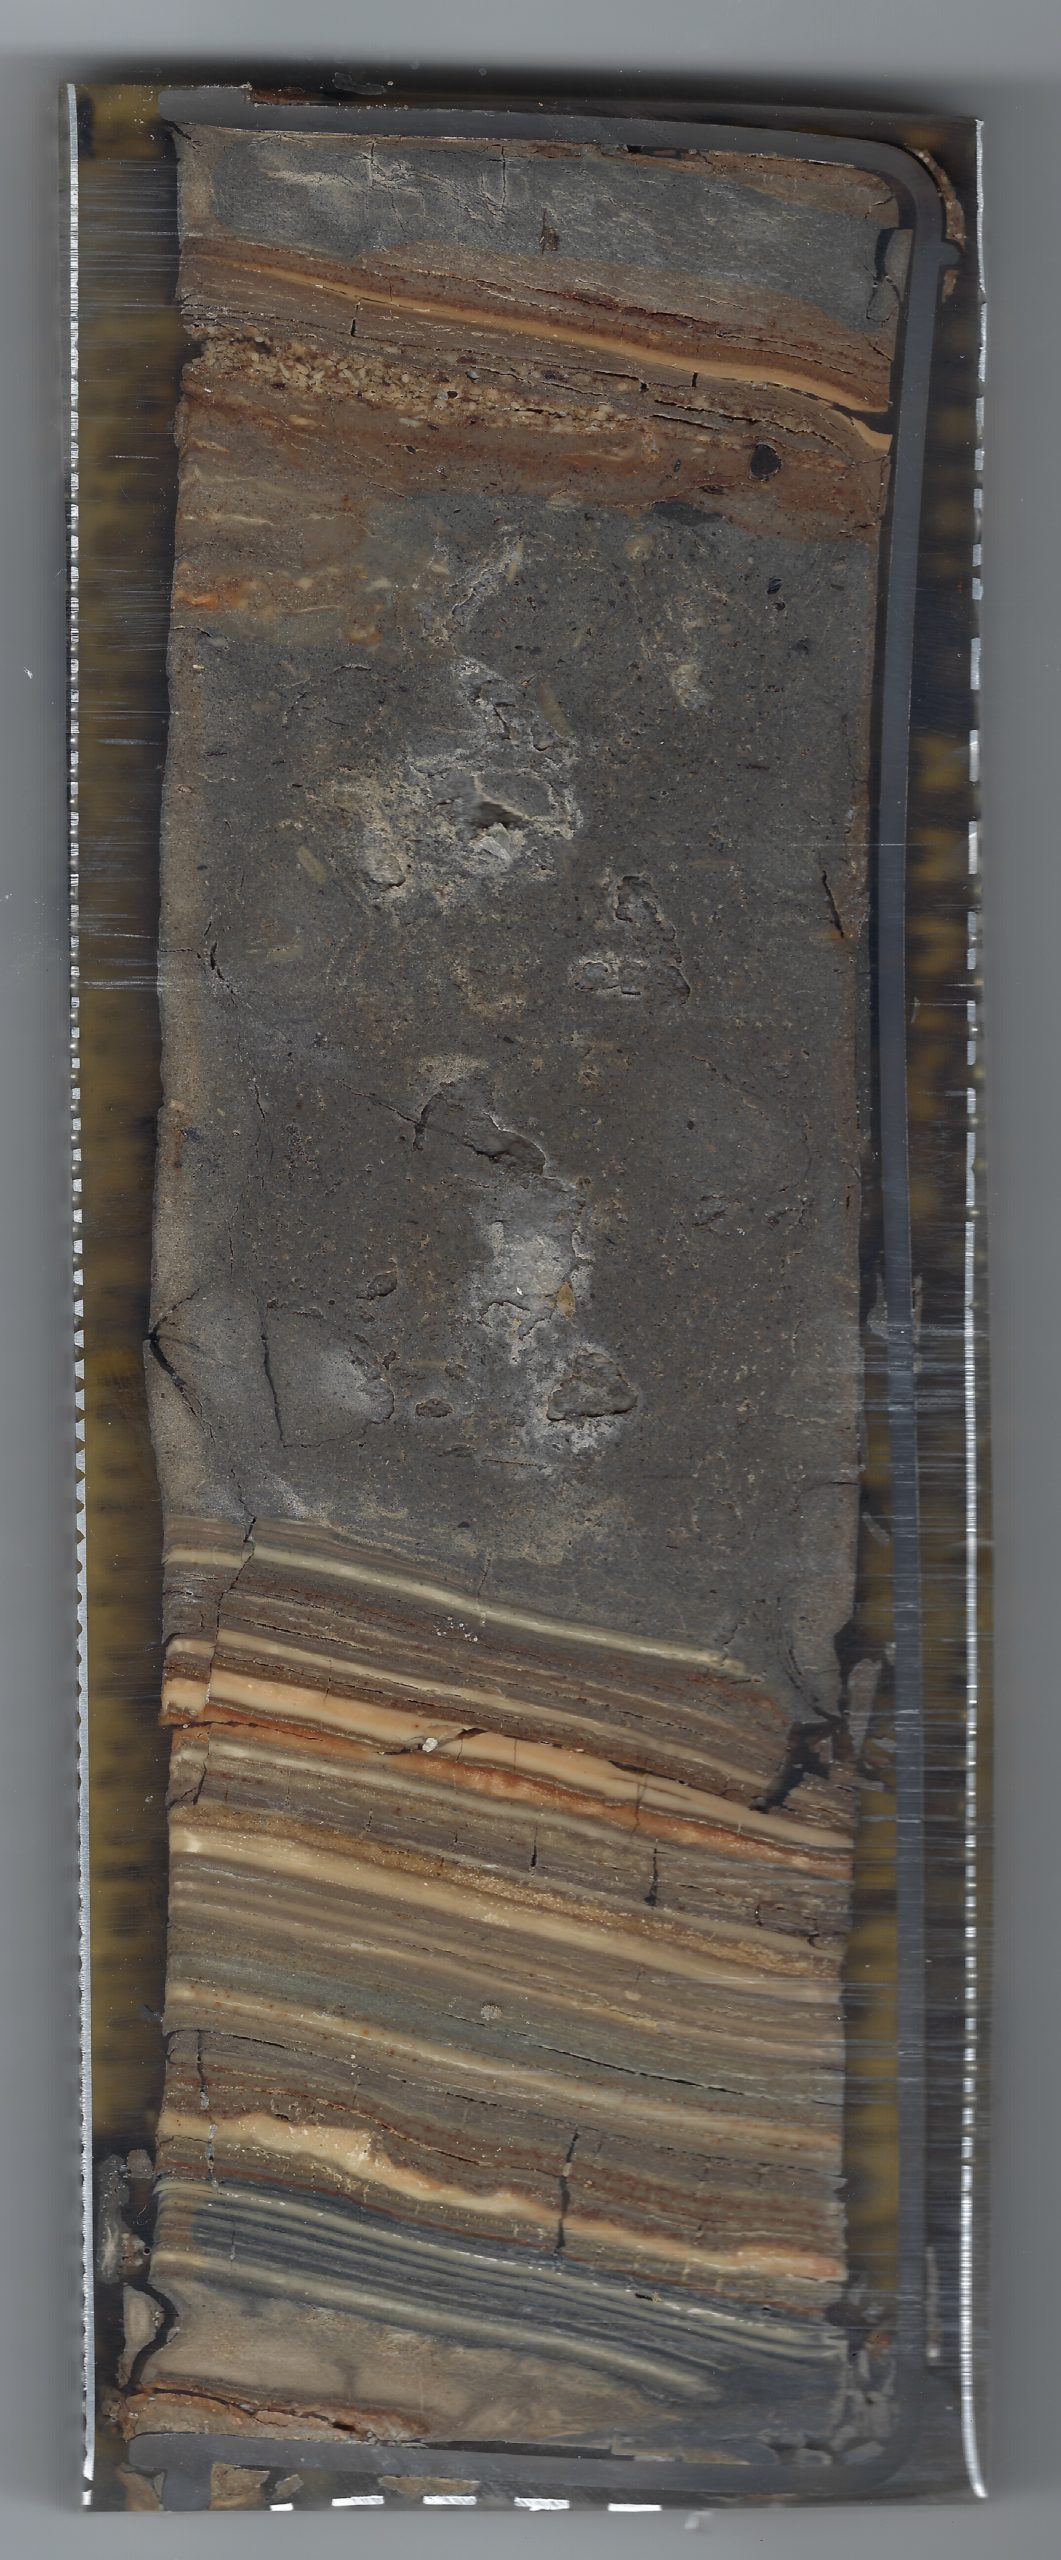
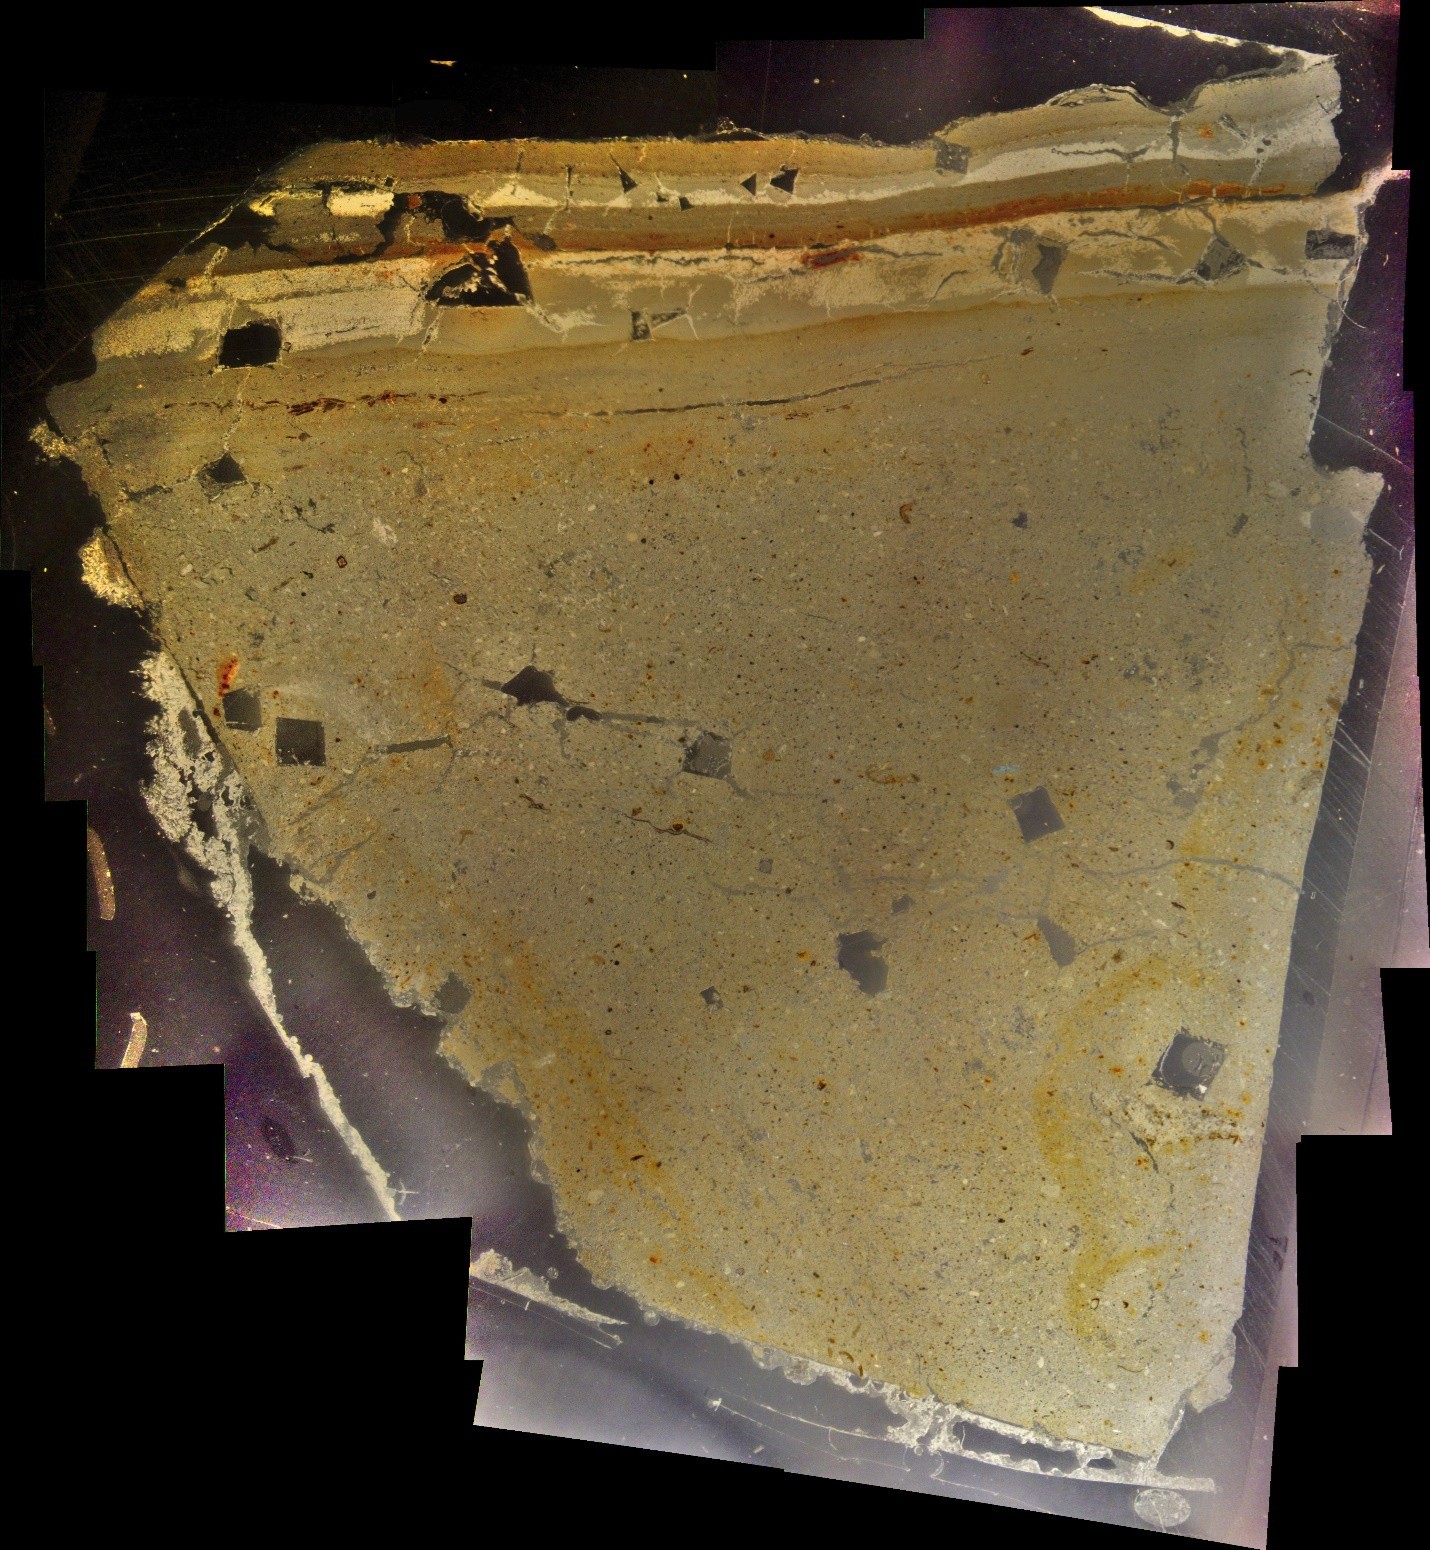
| 405 | 7 | NZ418F |
 NZ418F in situ
Click on photo to open magnifiable image in a new tab Photo by Jefferson Williams 2018  NZ418F in situ
Click on photo to open magnifiable image in a new tab Photo by Jefferson Williams 2018 |
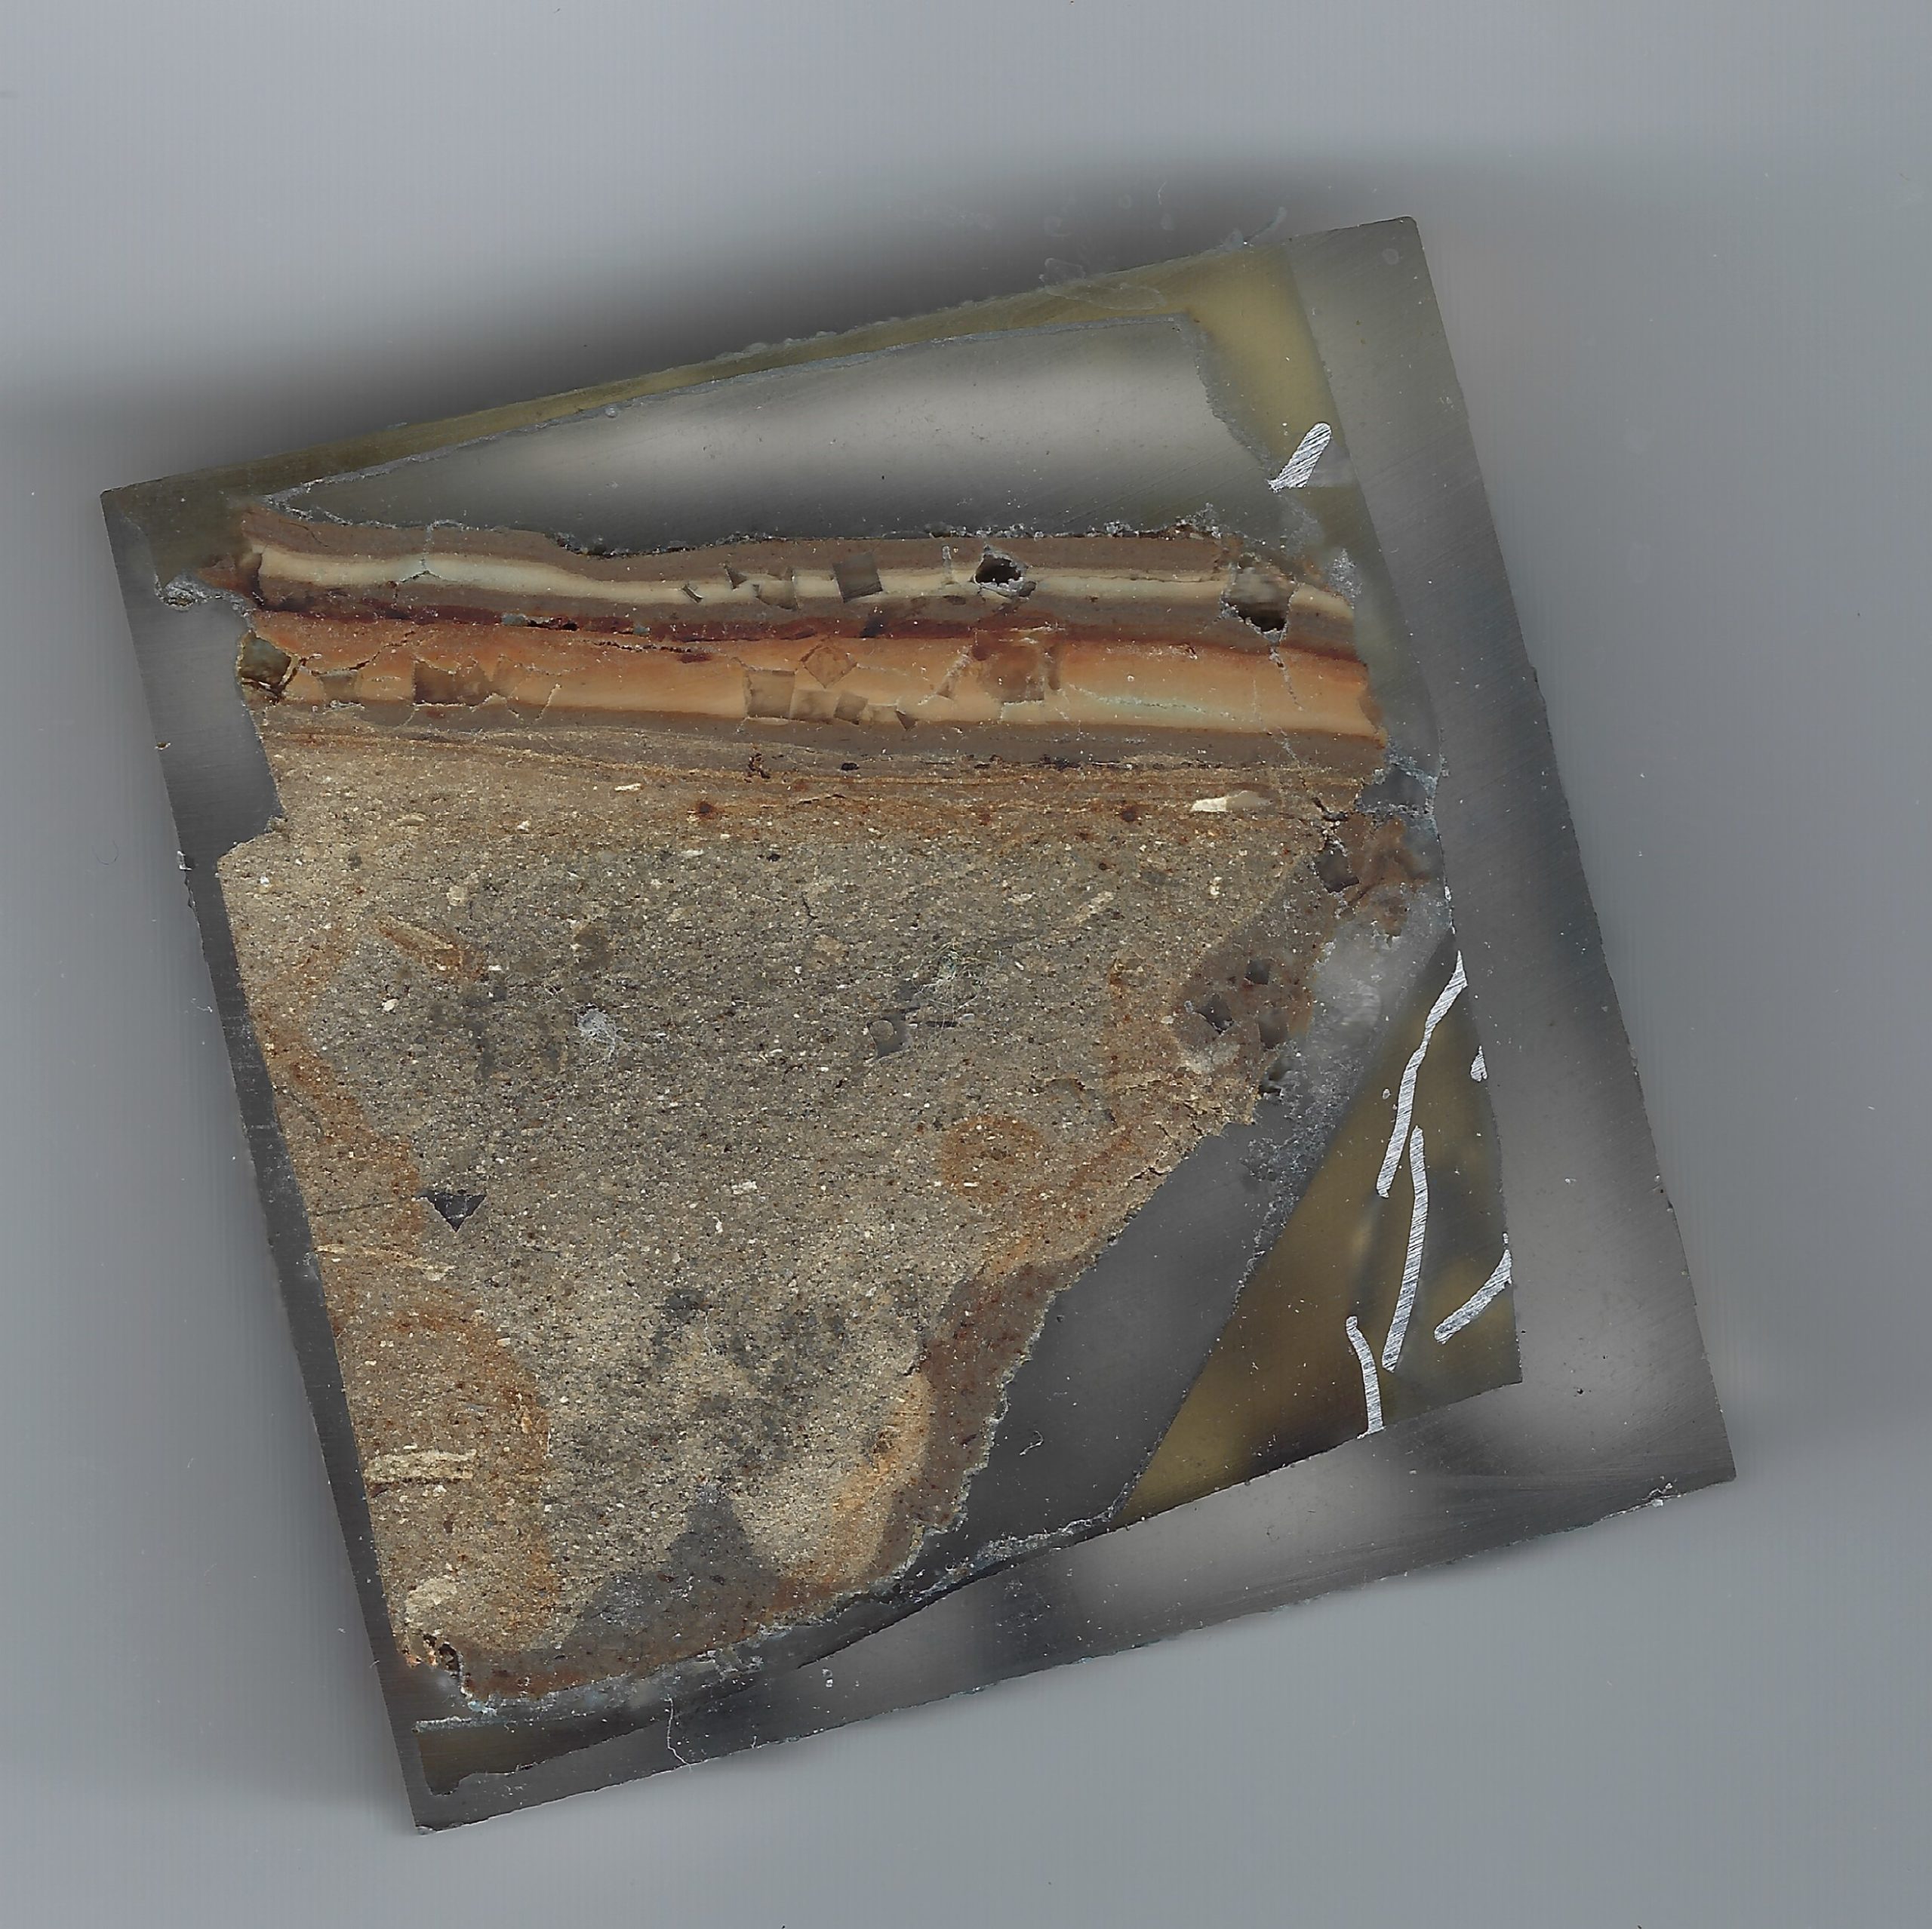 Slide Billet NZ418F
Click on photo to open magnifiable image in a new tab Photo by Jefferson Williams 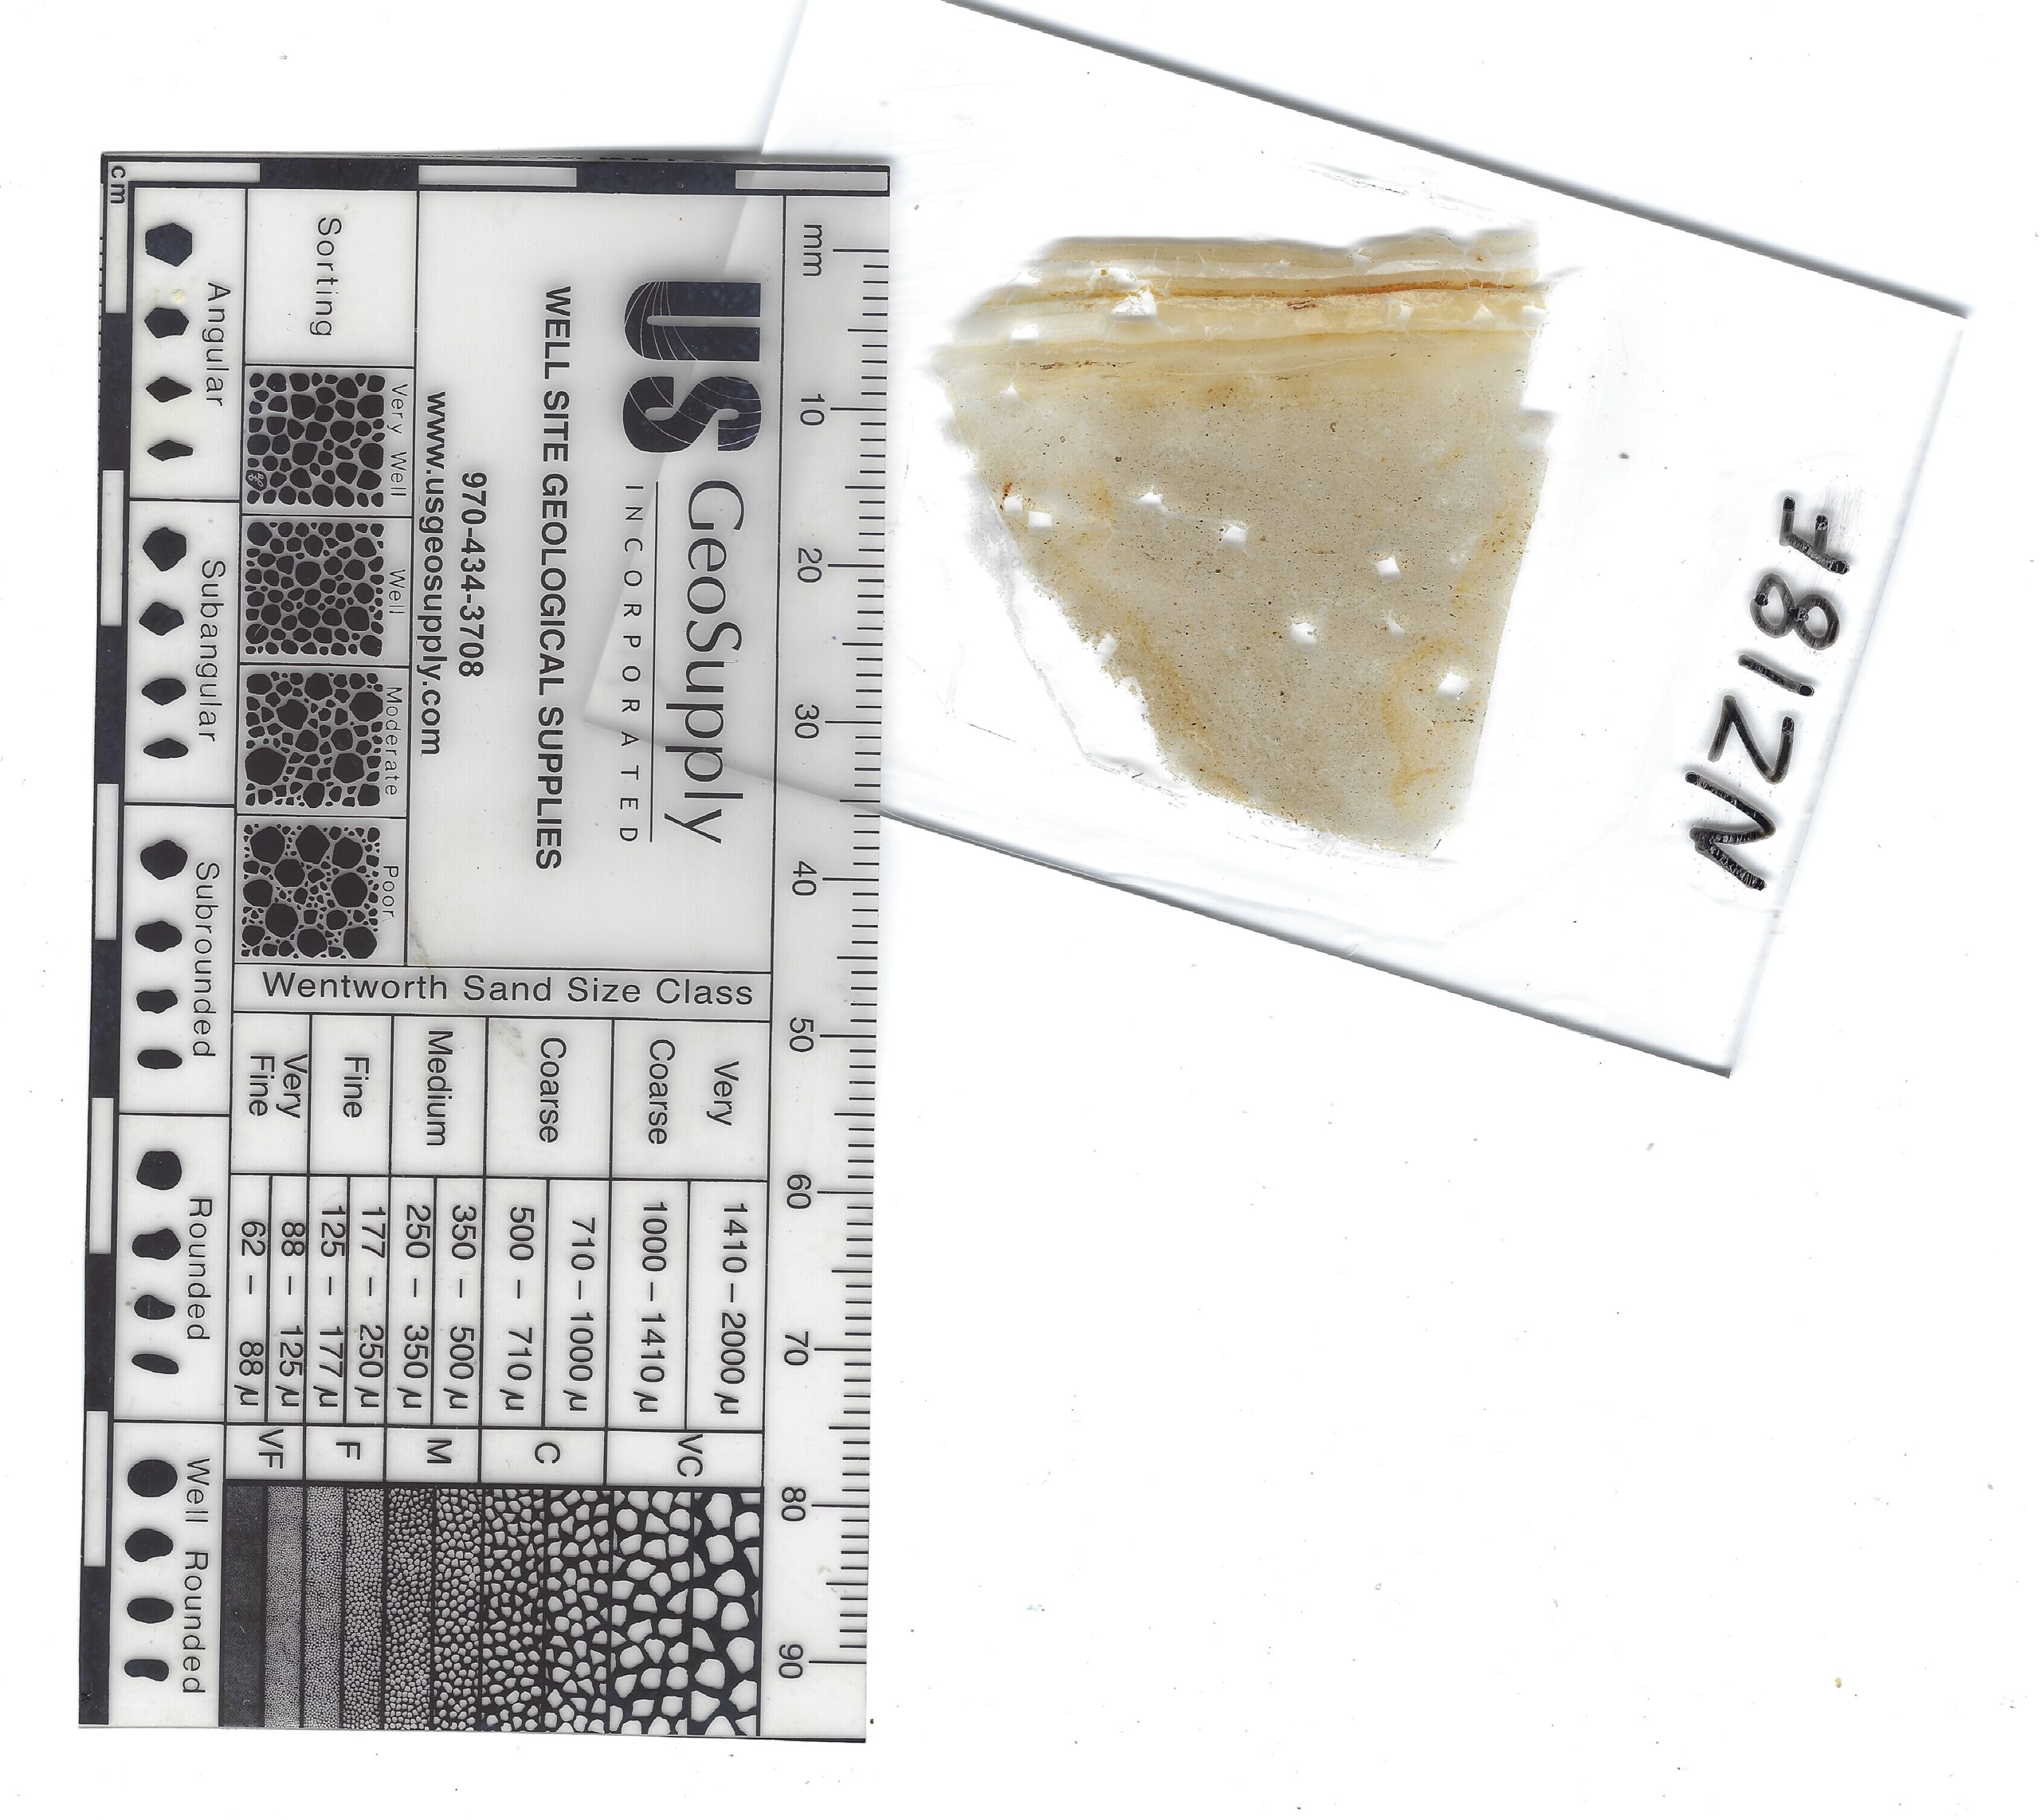 Thin Section of NZ418F with ruler
Click on photo to open magnifiable image in a new tab Photo by Jefferson Williams 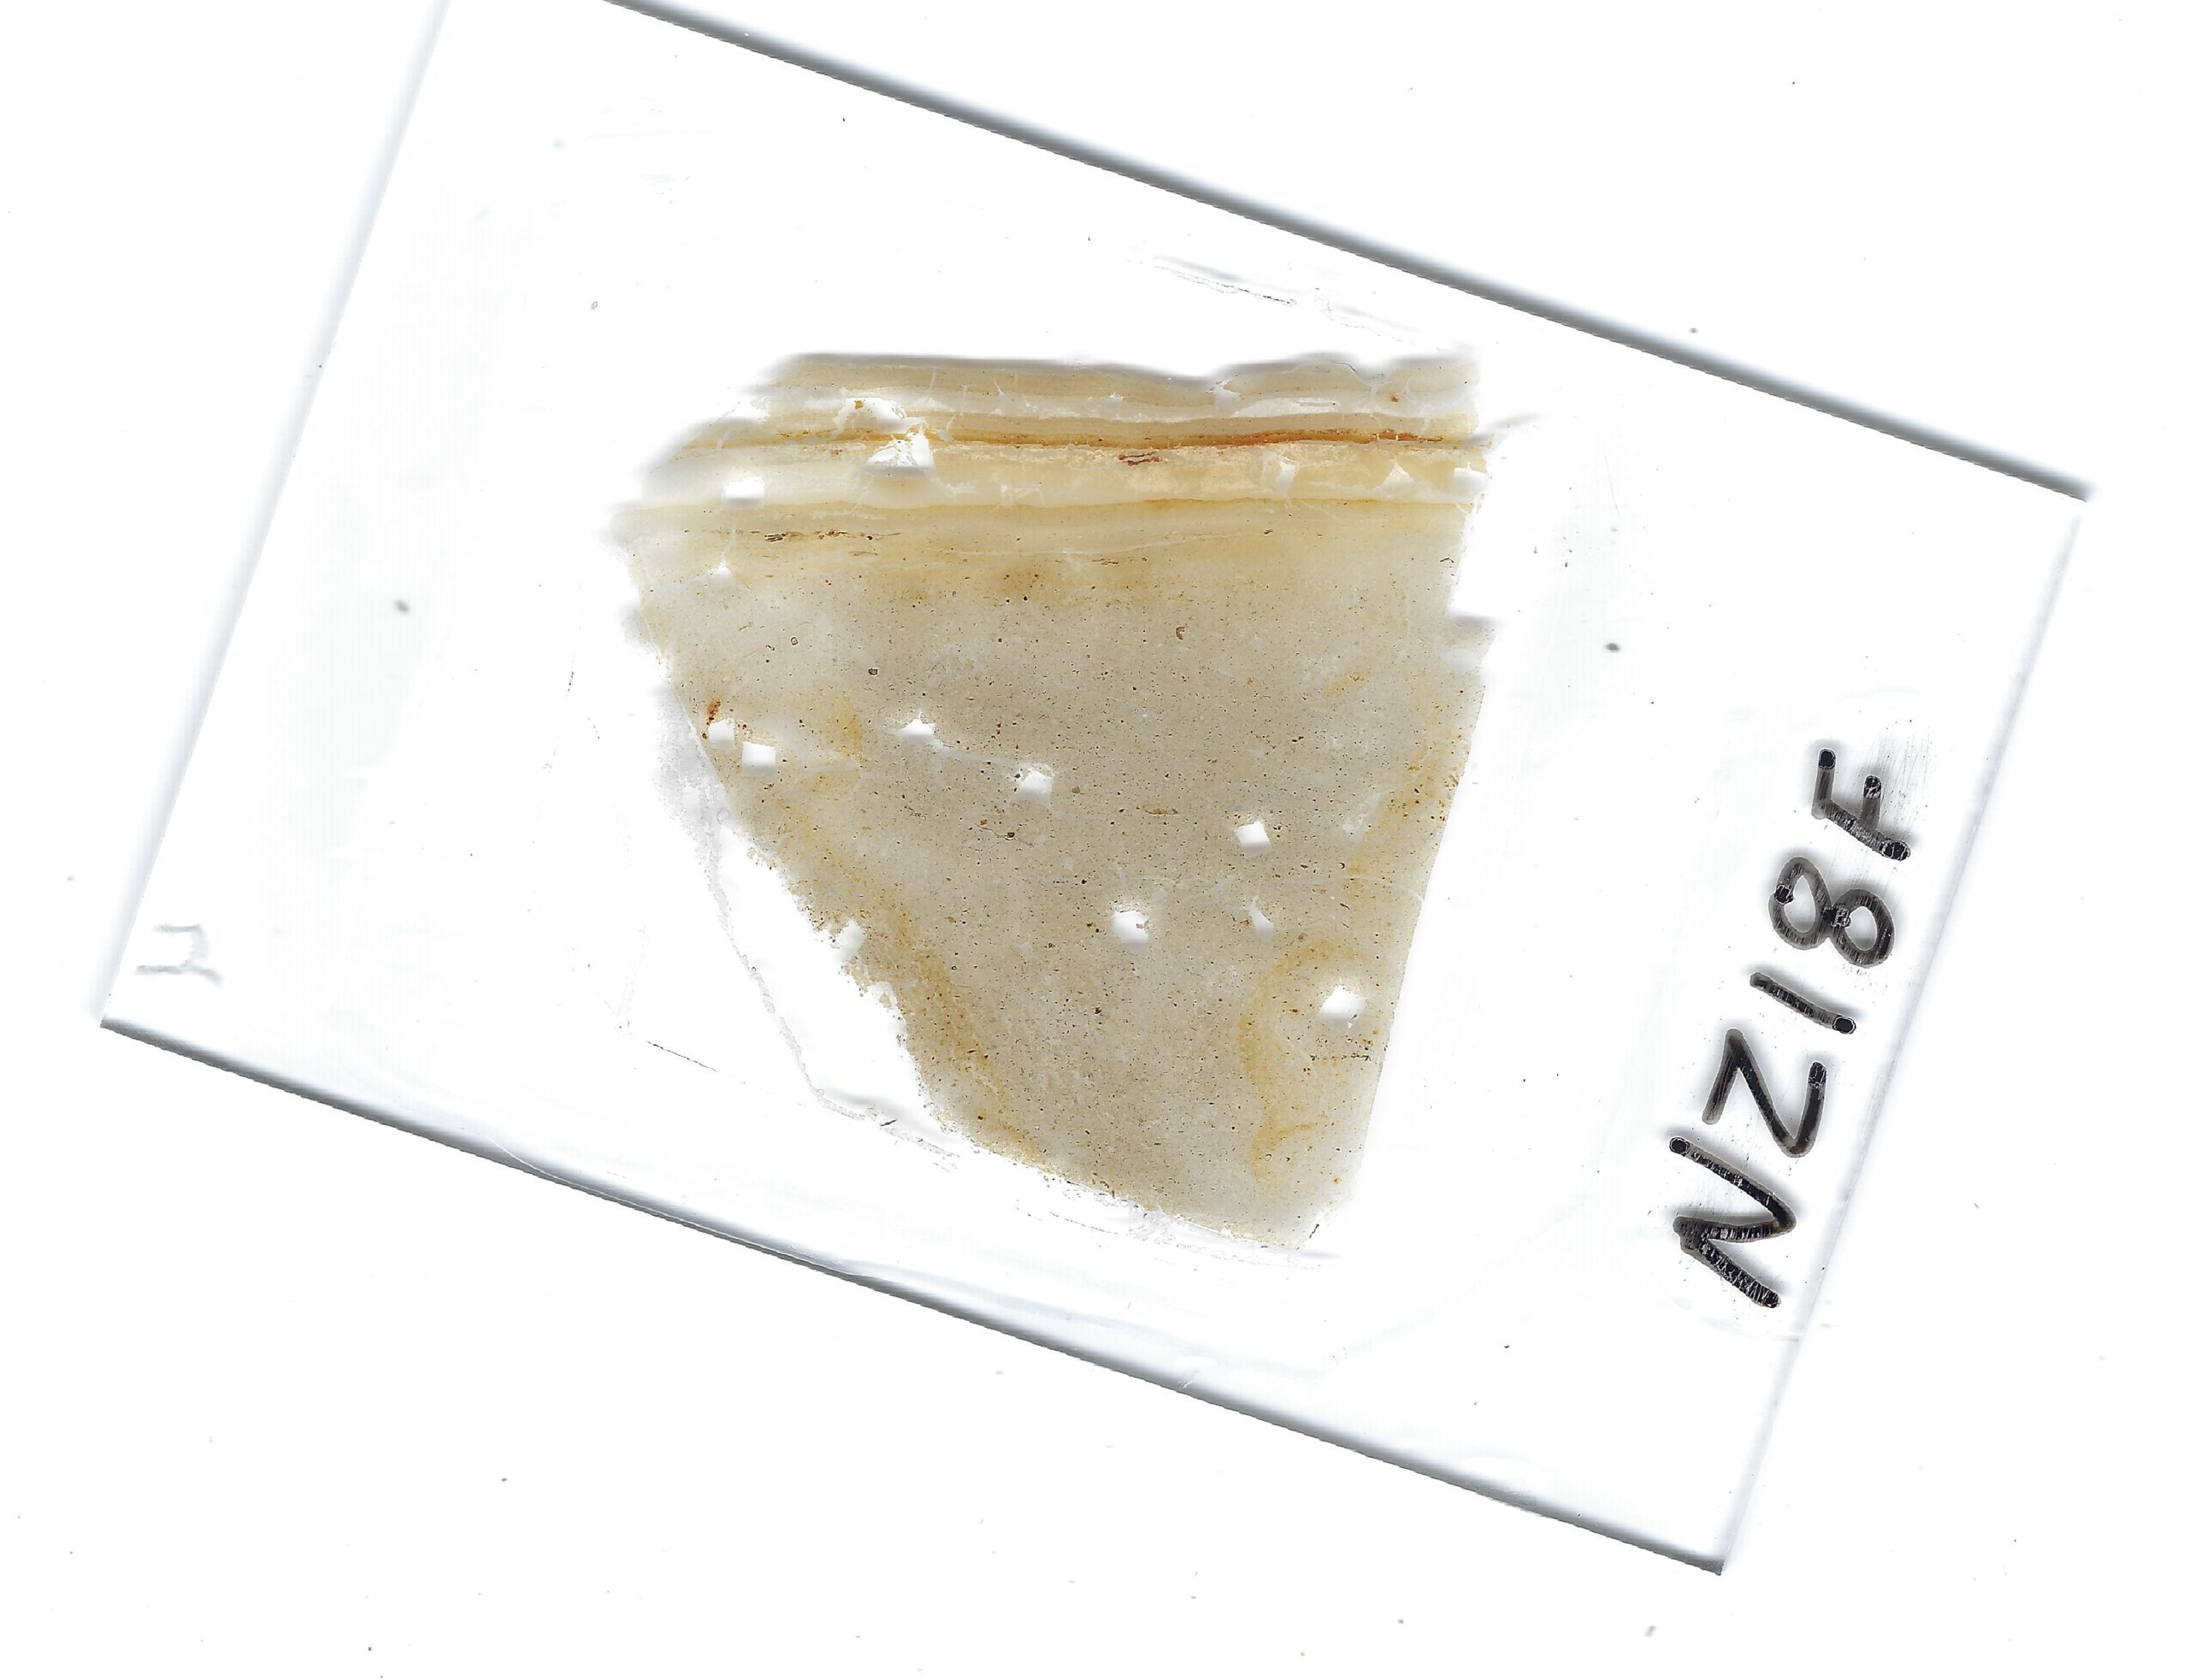 Thin Section of NZ418F with ruler
Click on photo to open magnifiable image in a new tab Photo by Jefferson Williams |
|||
| 466 in 2015 464 in 2018 |
10 in 2015 12-14 in 2018 |
31 BCE ? | NZ415G |
 NZ15G and other samples in situ
Click on photo to open magnifiable image in a new tab Photo by Jefferson Williams 2105  Seismite at 466 cm depth (Middle Outcrop 2015)
Click on photo to open magnifiable image in a new tab Photo by Jefferson Williams 2018  Seismite at 464 cm depth (Middle Outcrop 2018)
Click on photo to open magnifiable image in a new tab Photo by Jefferson Williams 2018 |
 Hardened Sample NZ415G
Click on photo to open magnifiable image in a new tab Photo by Jefferson Williams 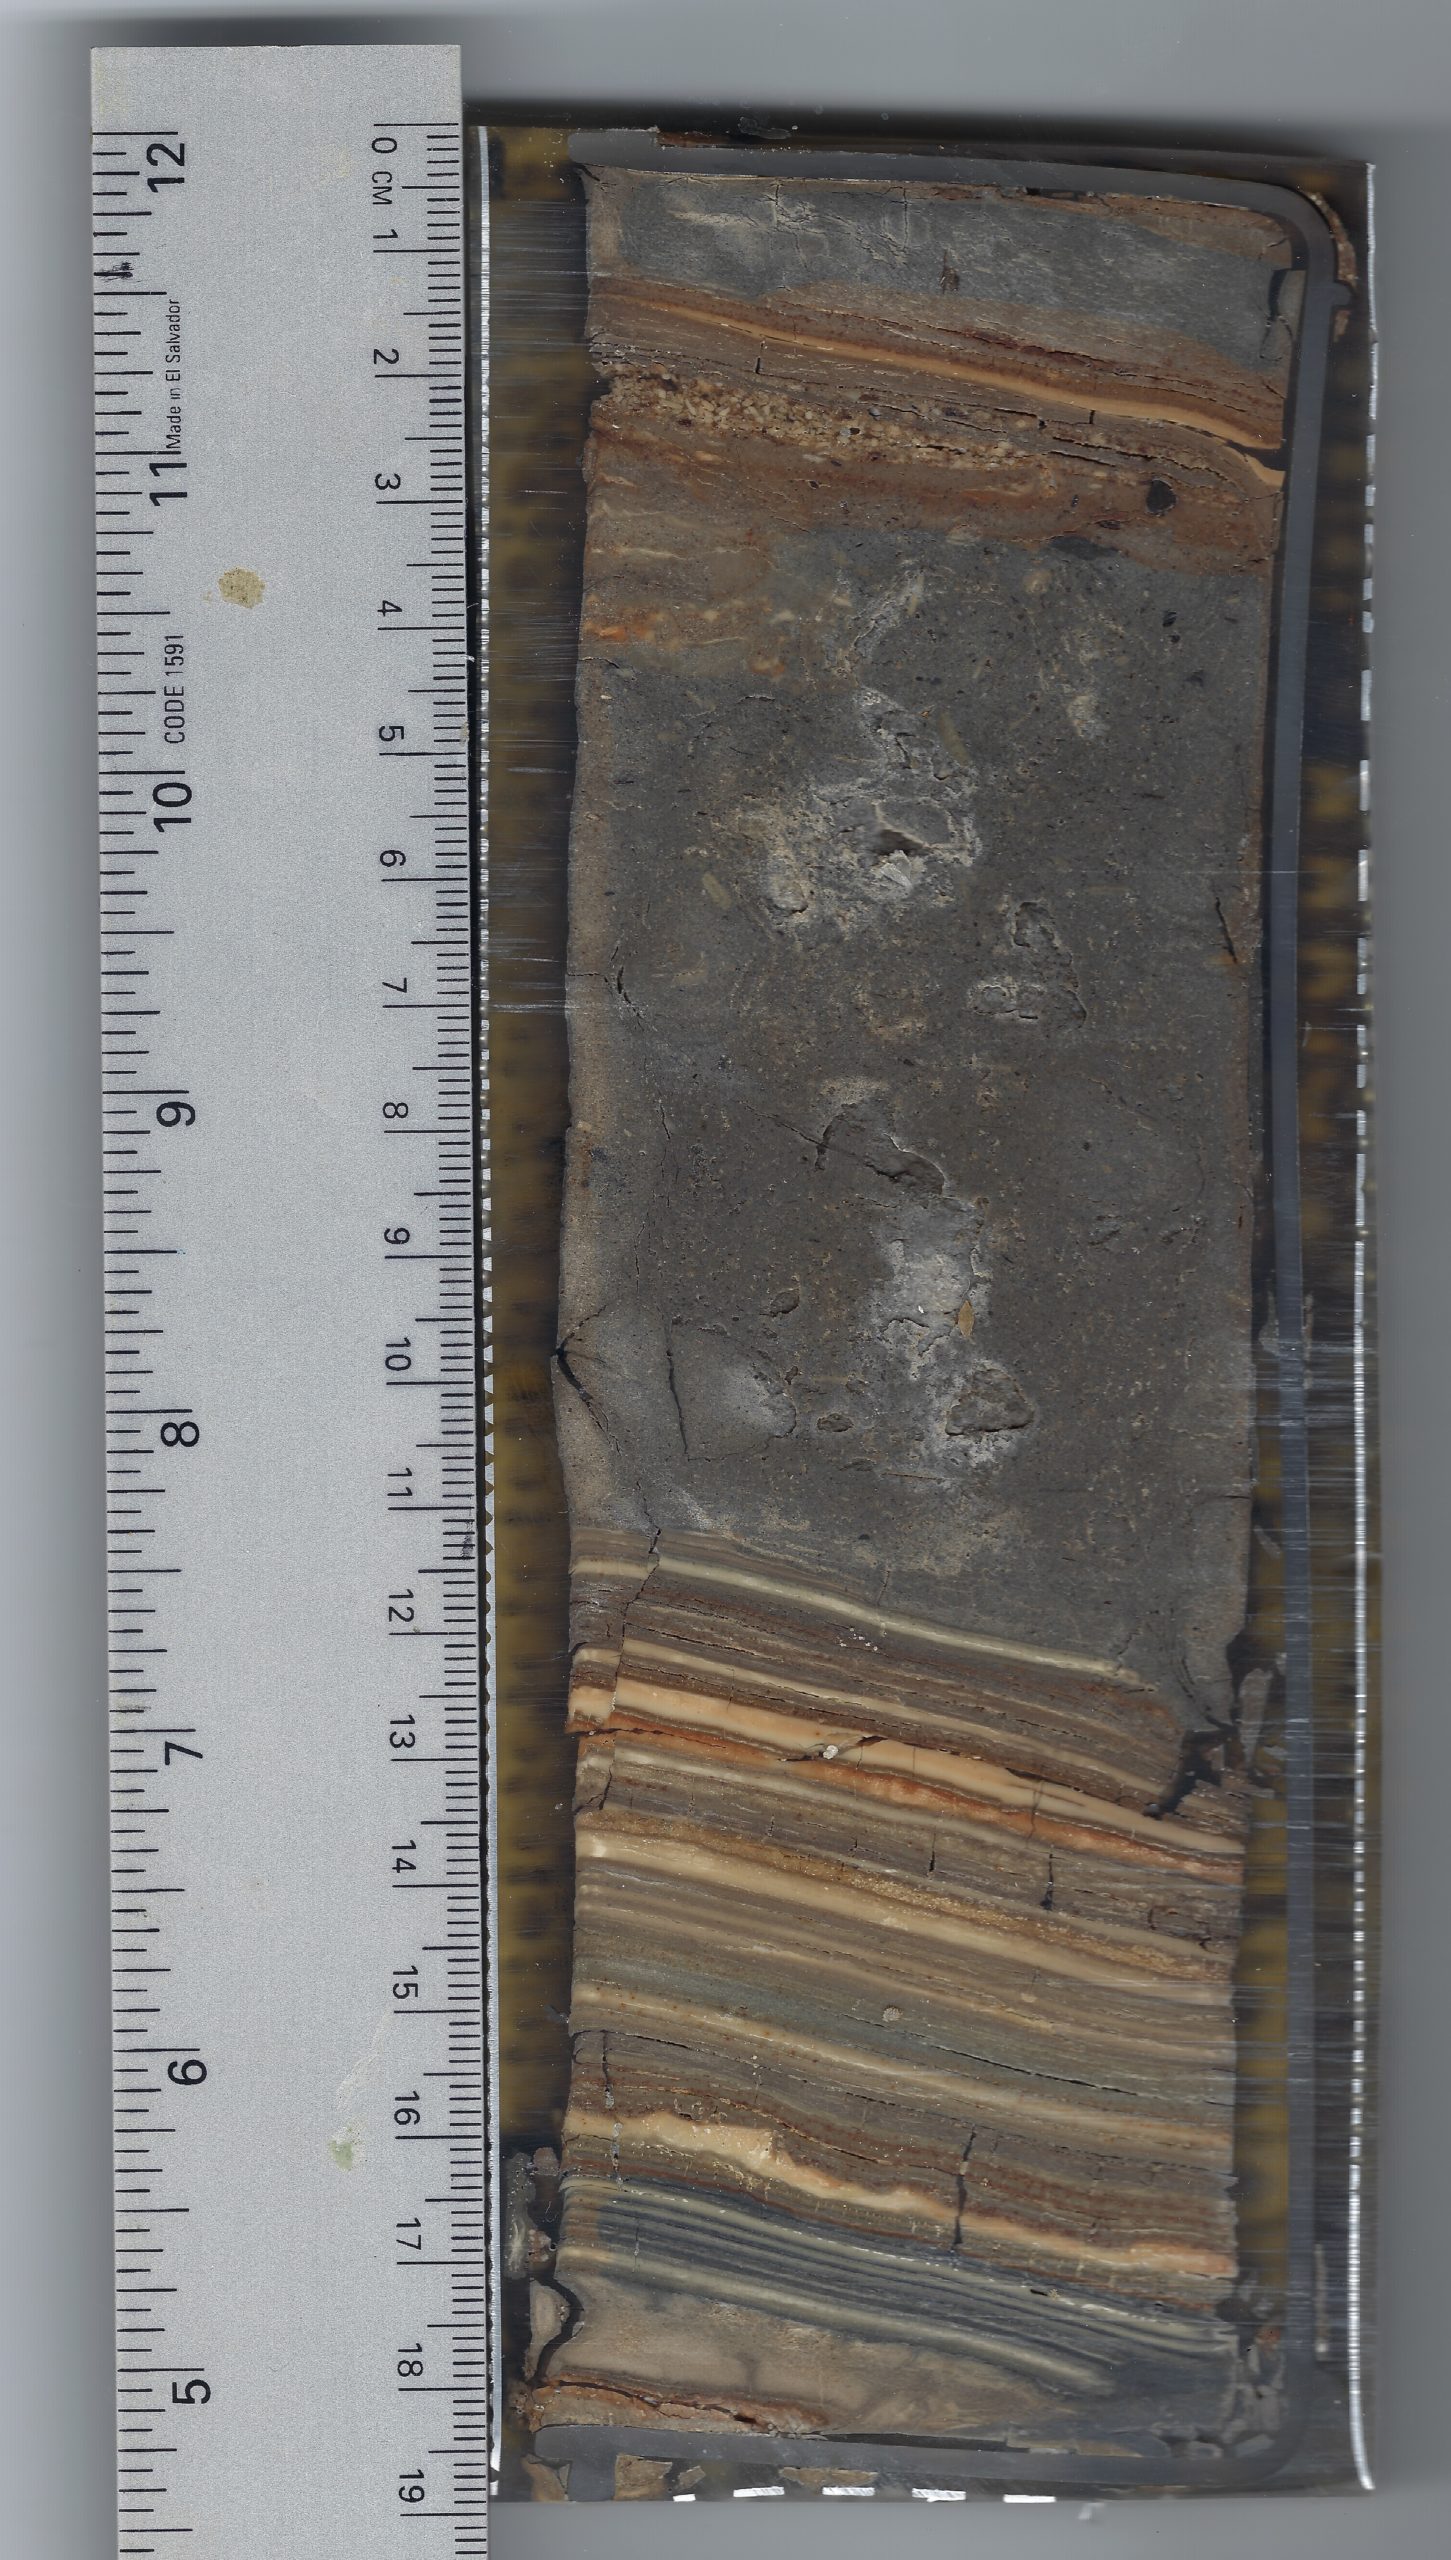 Hardened Sample NZ415G with ruler
Click on photo to open magnifiable image in a new tab Photo by Jefferson Williams 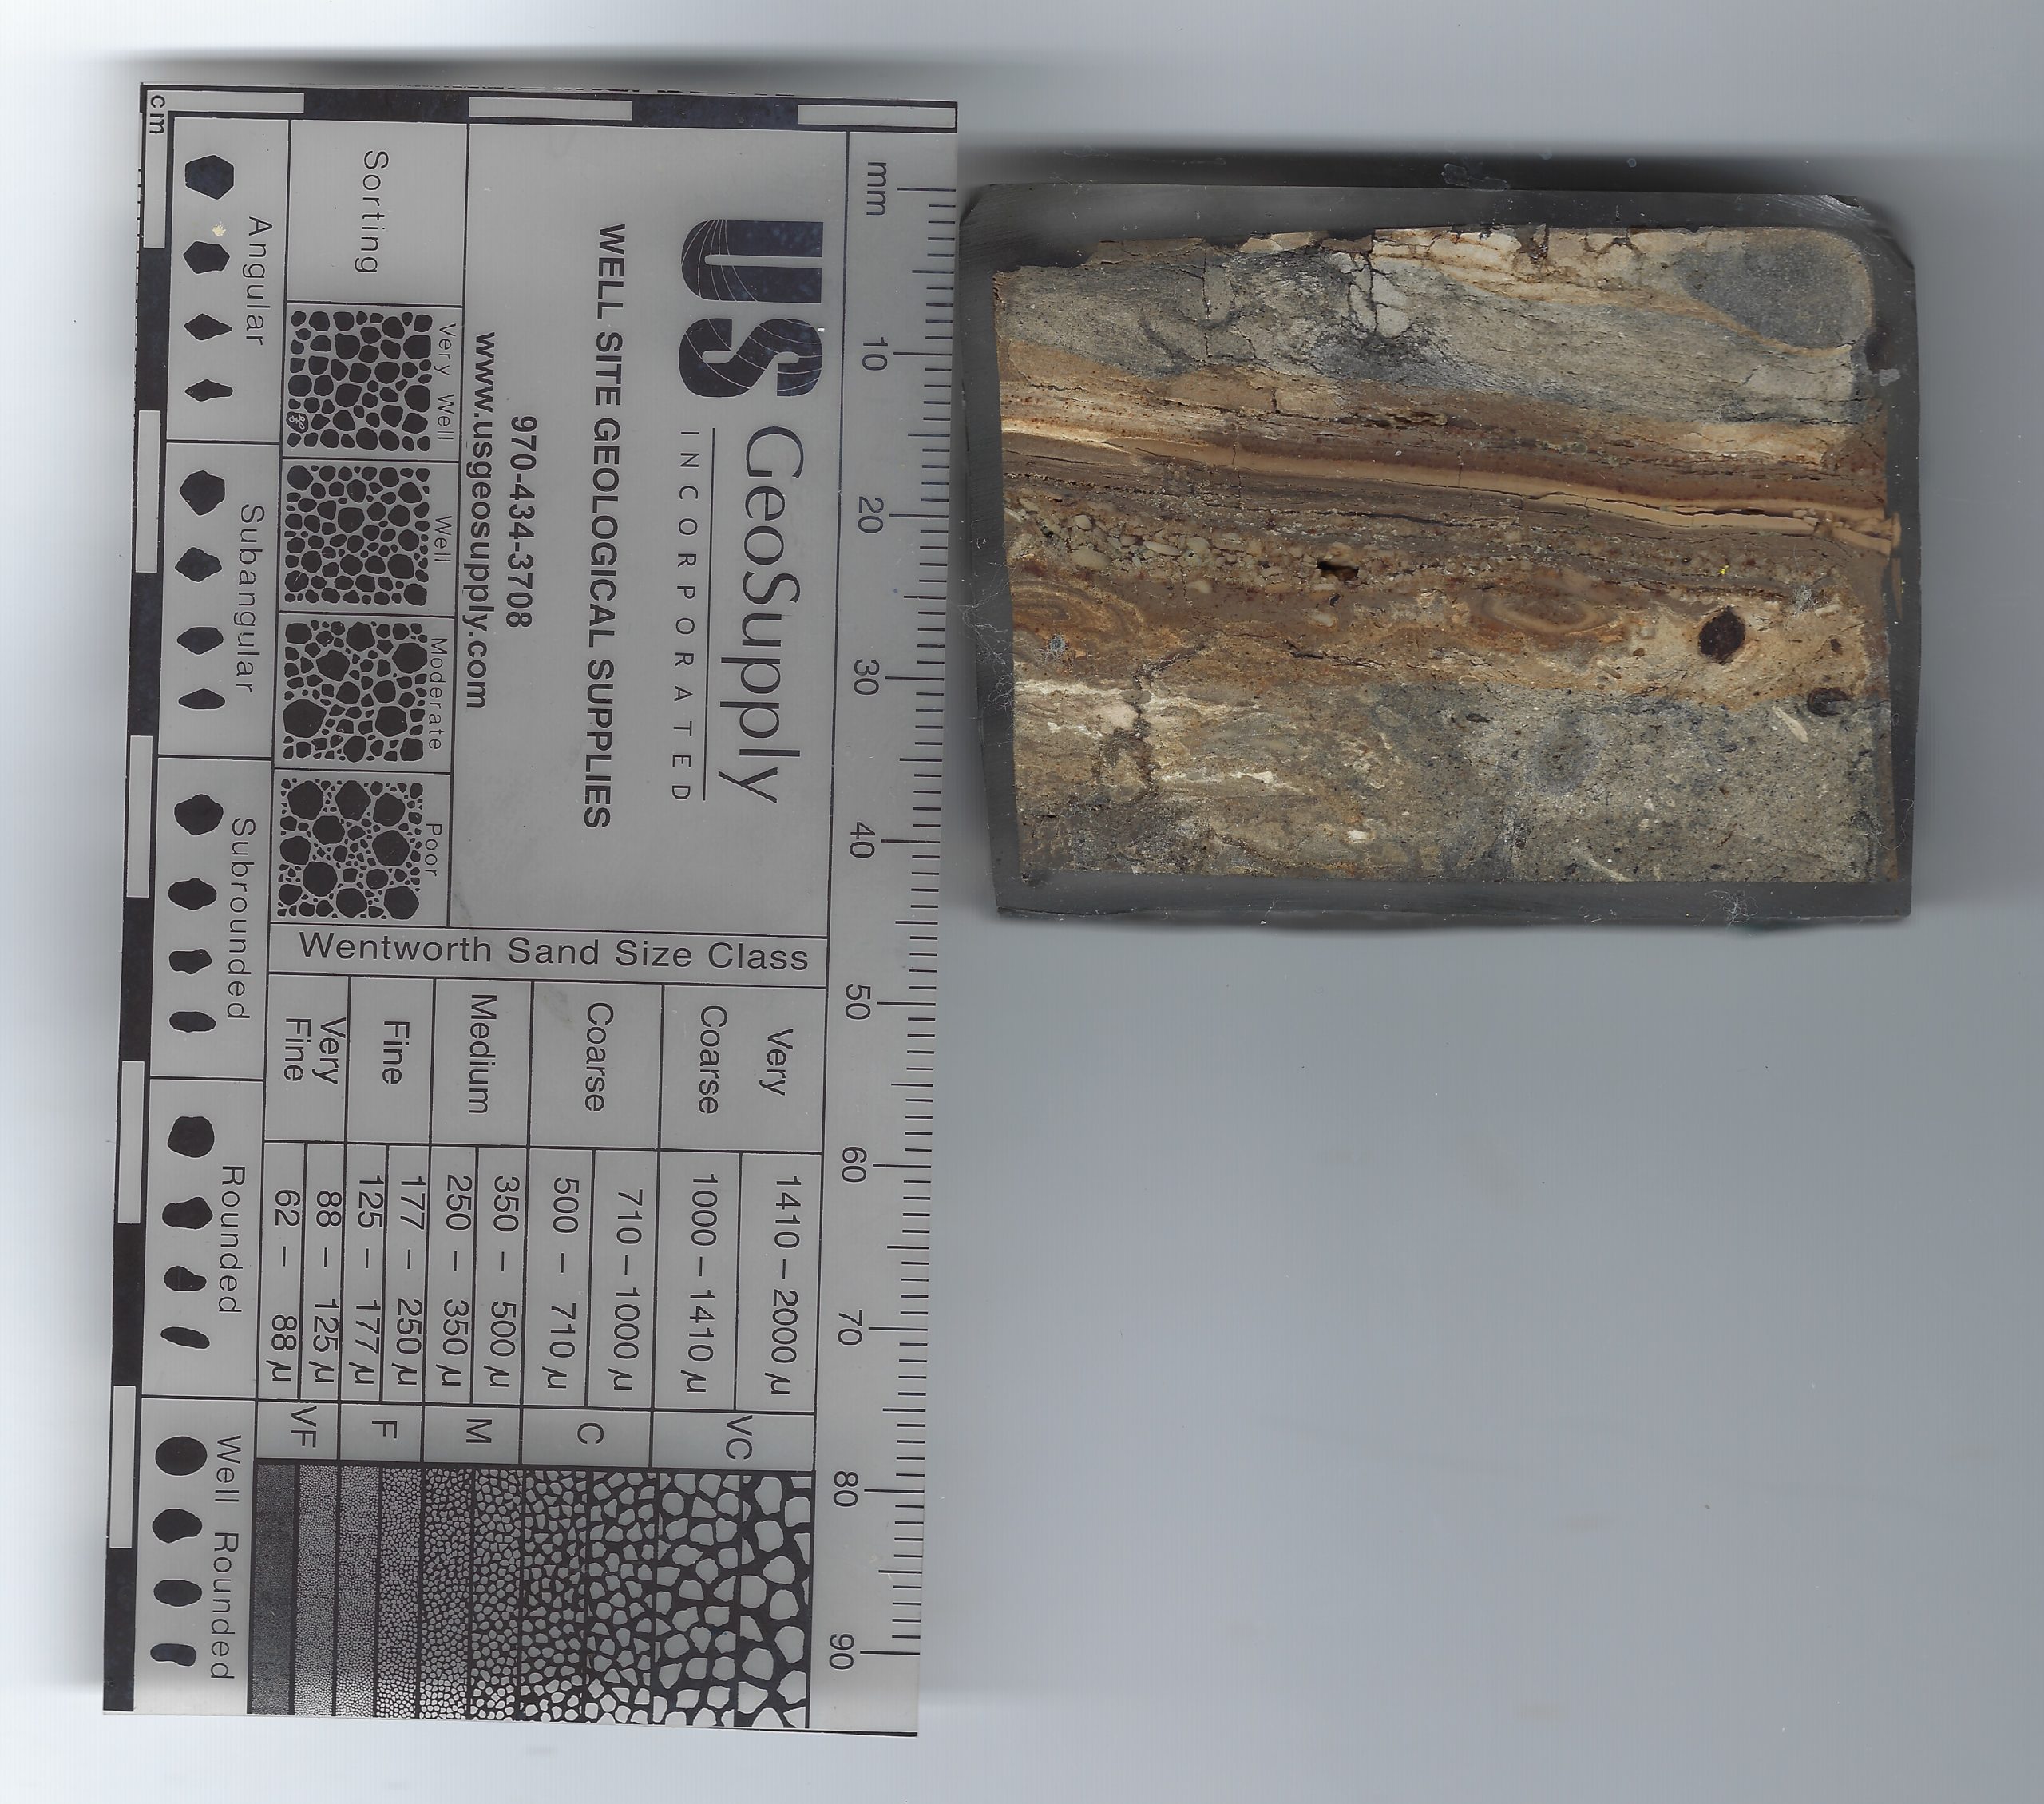 Slide Billet of Sample NZ415G
Click on photo to open magnifiable image in a new tab Photo by Jefferson Williams 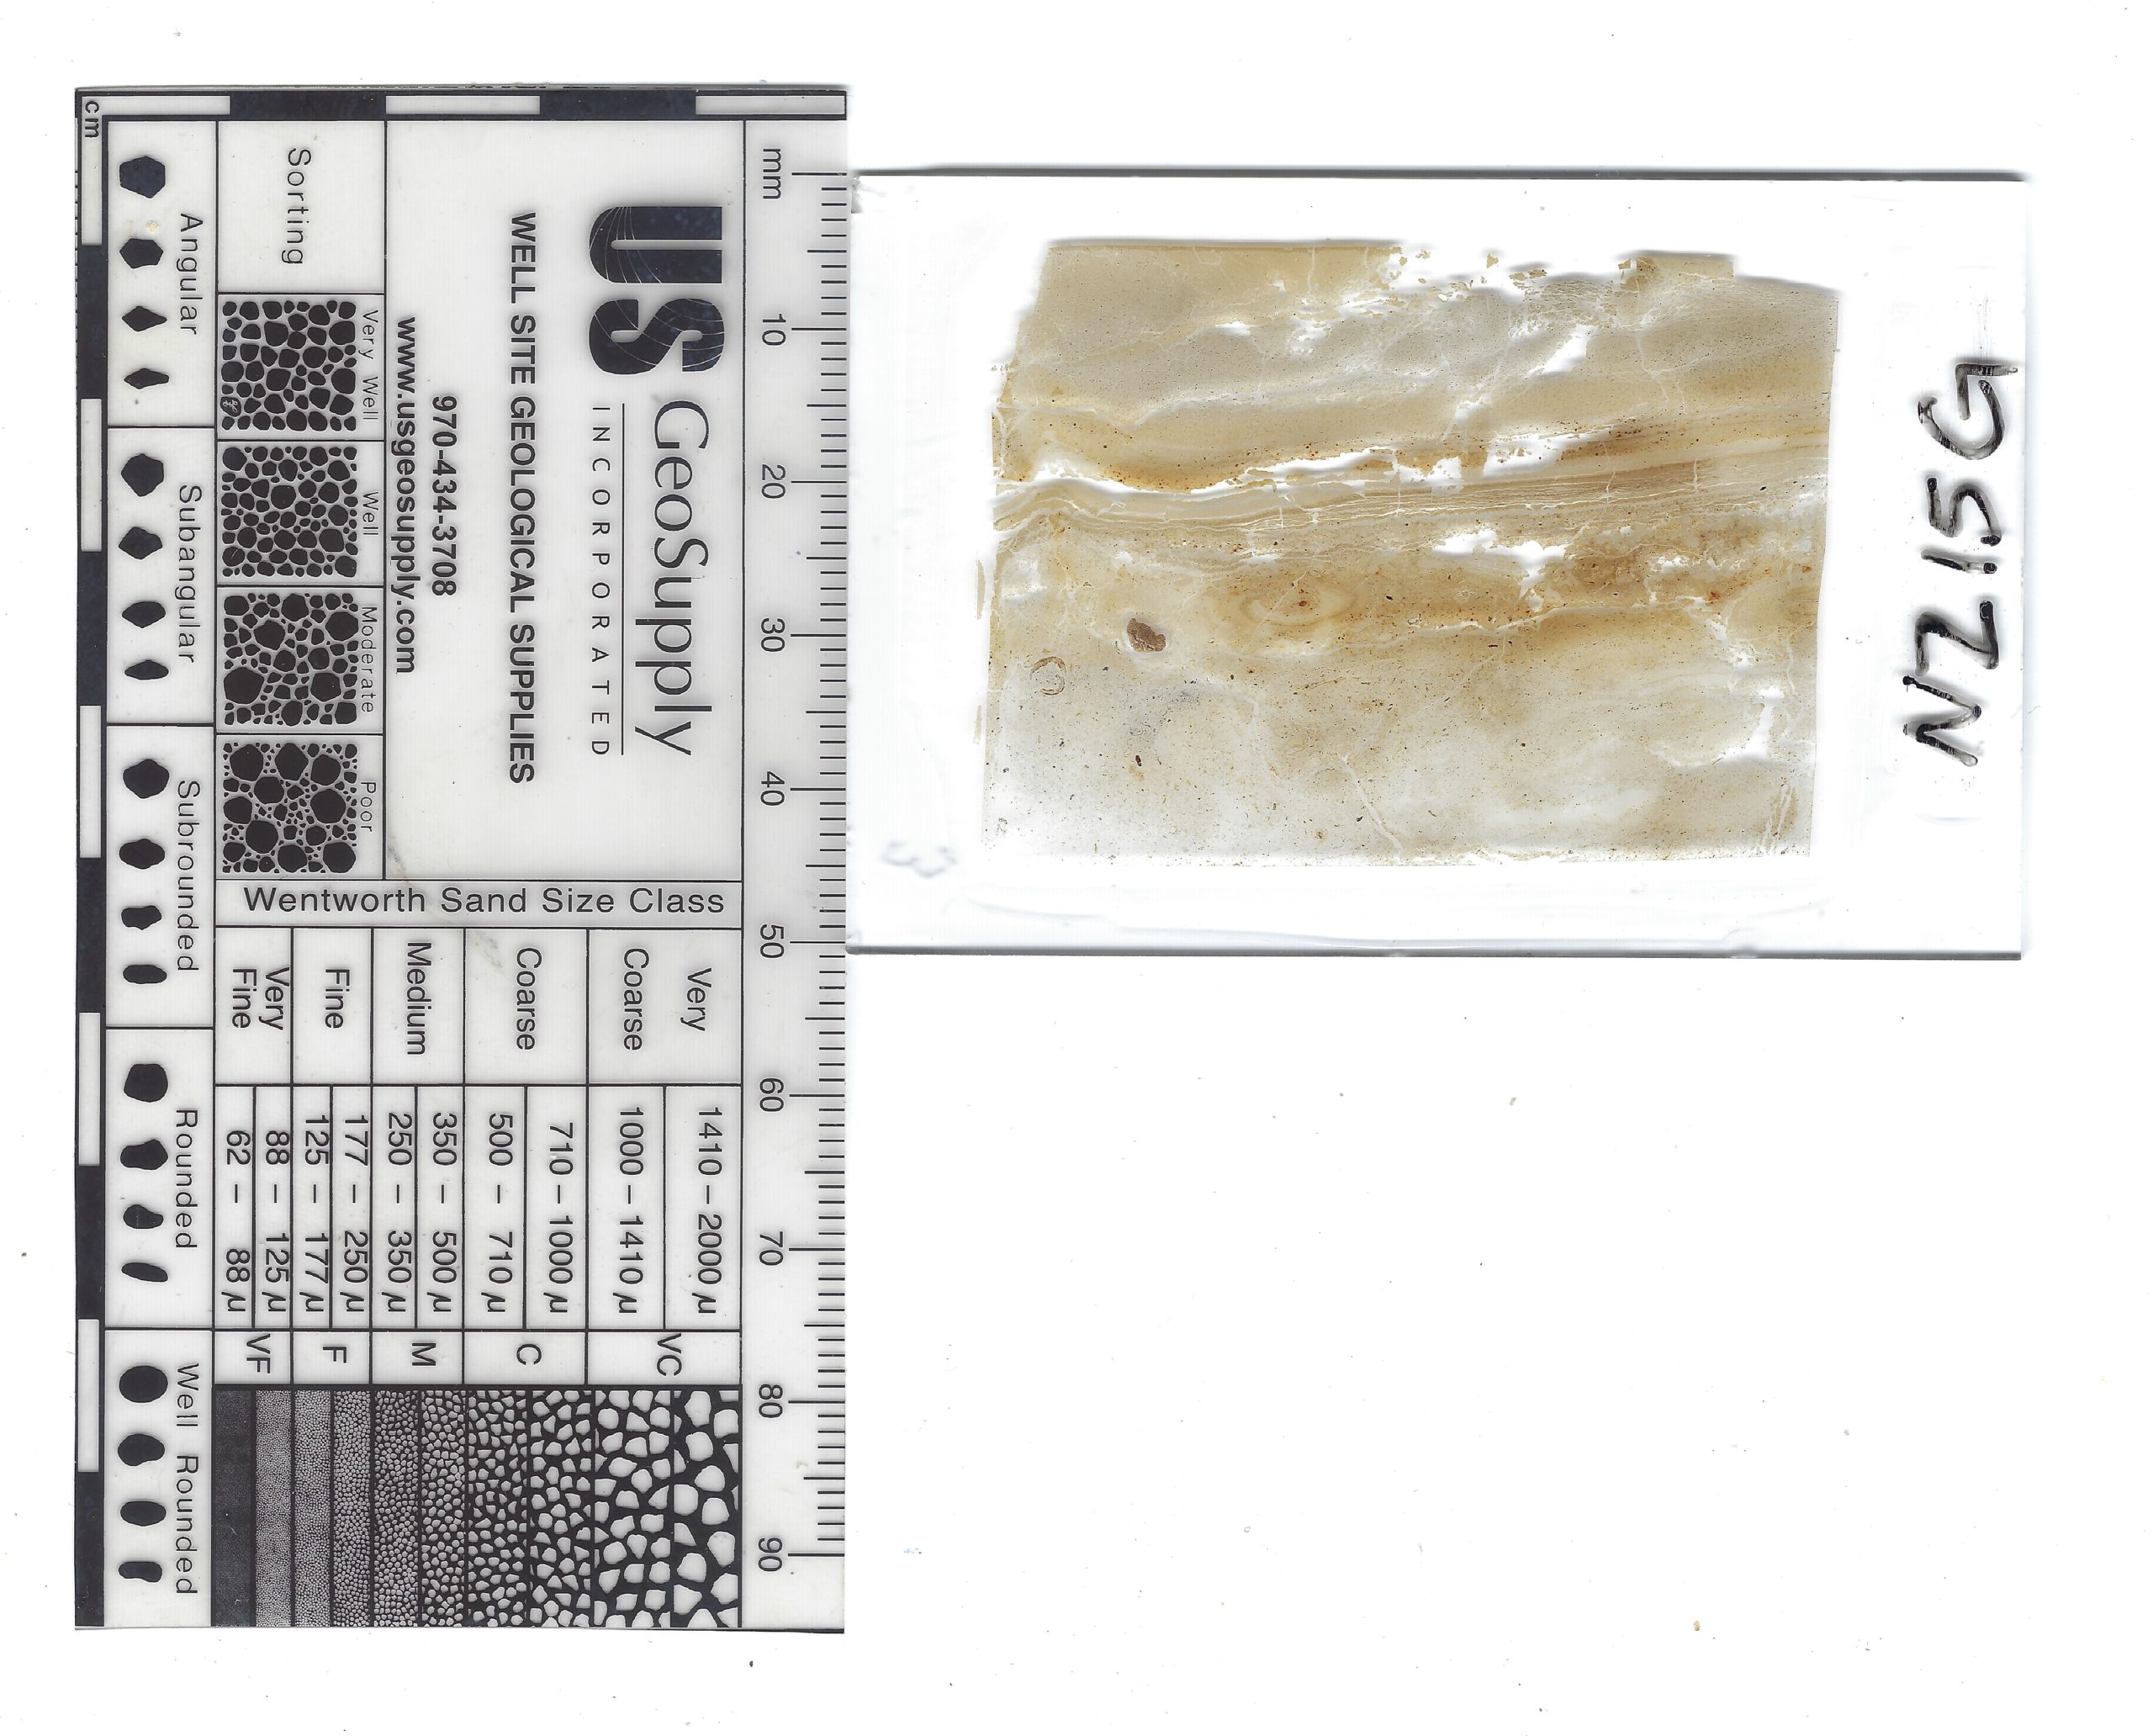 Thin Section Slide of Sample NZ415G
Click on photo to open magnifiable image in a new tab Photo by Jefferson Williams |
 NZ423I in the Lab
Click on Image to open high resolution version in a new tab
Photo by JW - Nov. 2024
 NZ423I in the Lab
Click on Image to open high resolution version in a new tab
Photo by JW - Nov. 2024
 NZ423I in the Lab
Click on Image to open high resolution version in a new tab
Photo by JW - Nov. 2024
 NZ423I in the Lab
Click on Image to open high resolution version in a new tab
Photo by JW - Nov. 2024
 NZ423I in the Lab
Click on Image to open high resolution version in a new tab
Photo by JW - Nov. 2024
 NZ423I in the Lab
Click on Image to open high resolution version in a new tab
Photo by JW - Nov. 2024
 Sample NZ423I Annotated
Click on Image to open high resolution version in a new tab
Photo by JW - Nov. 2024
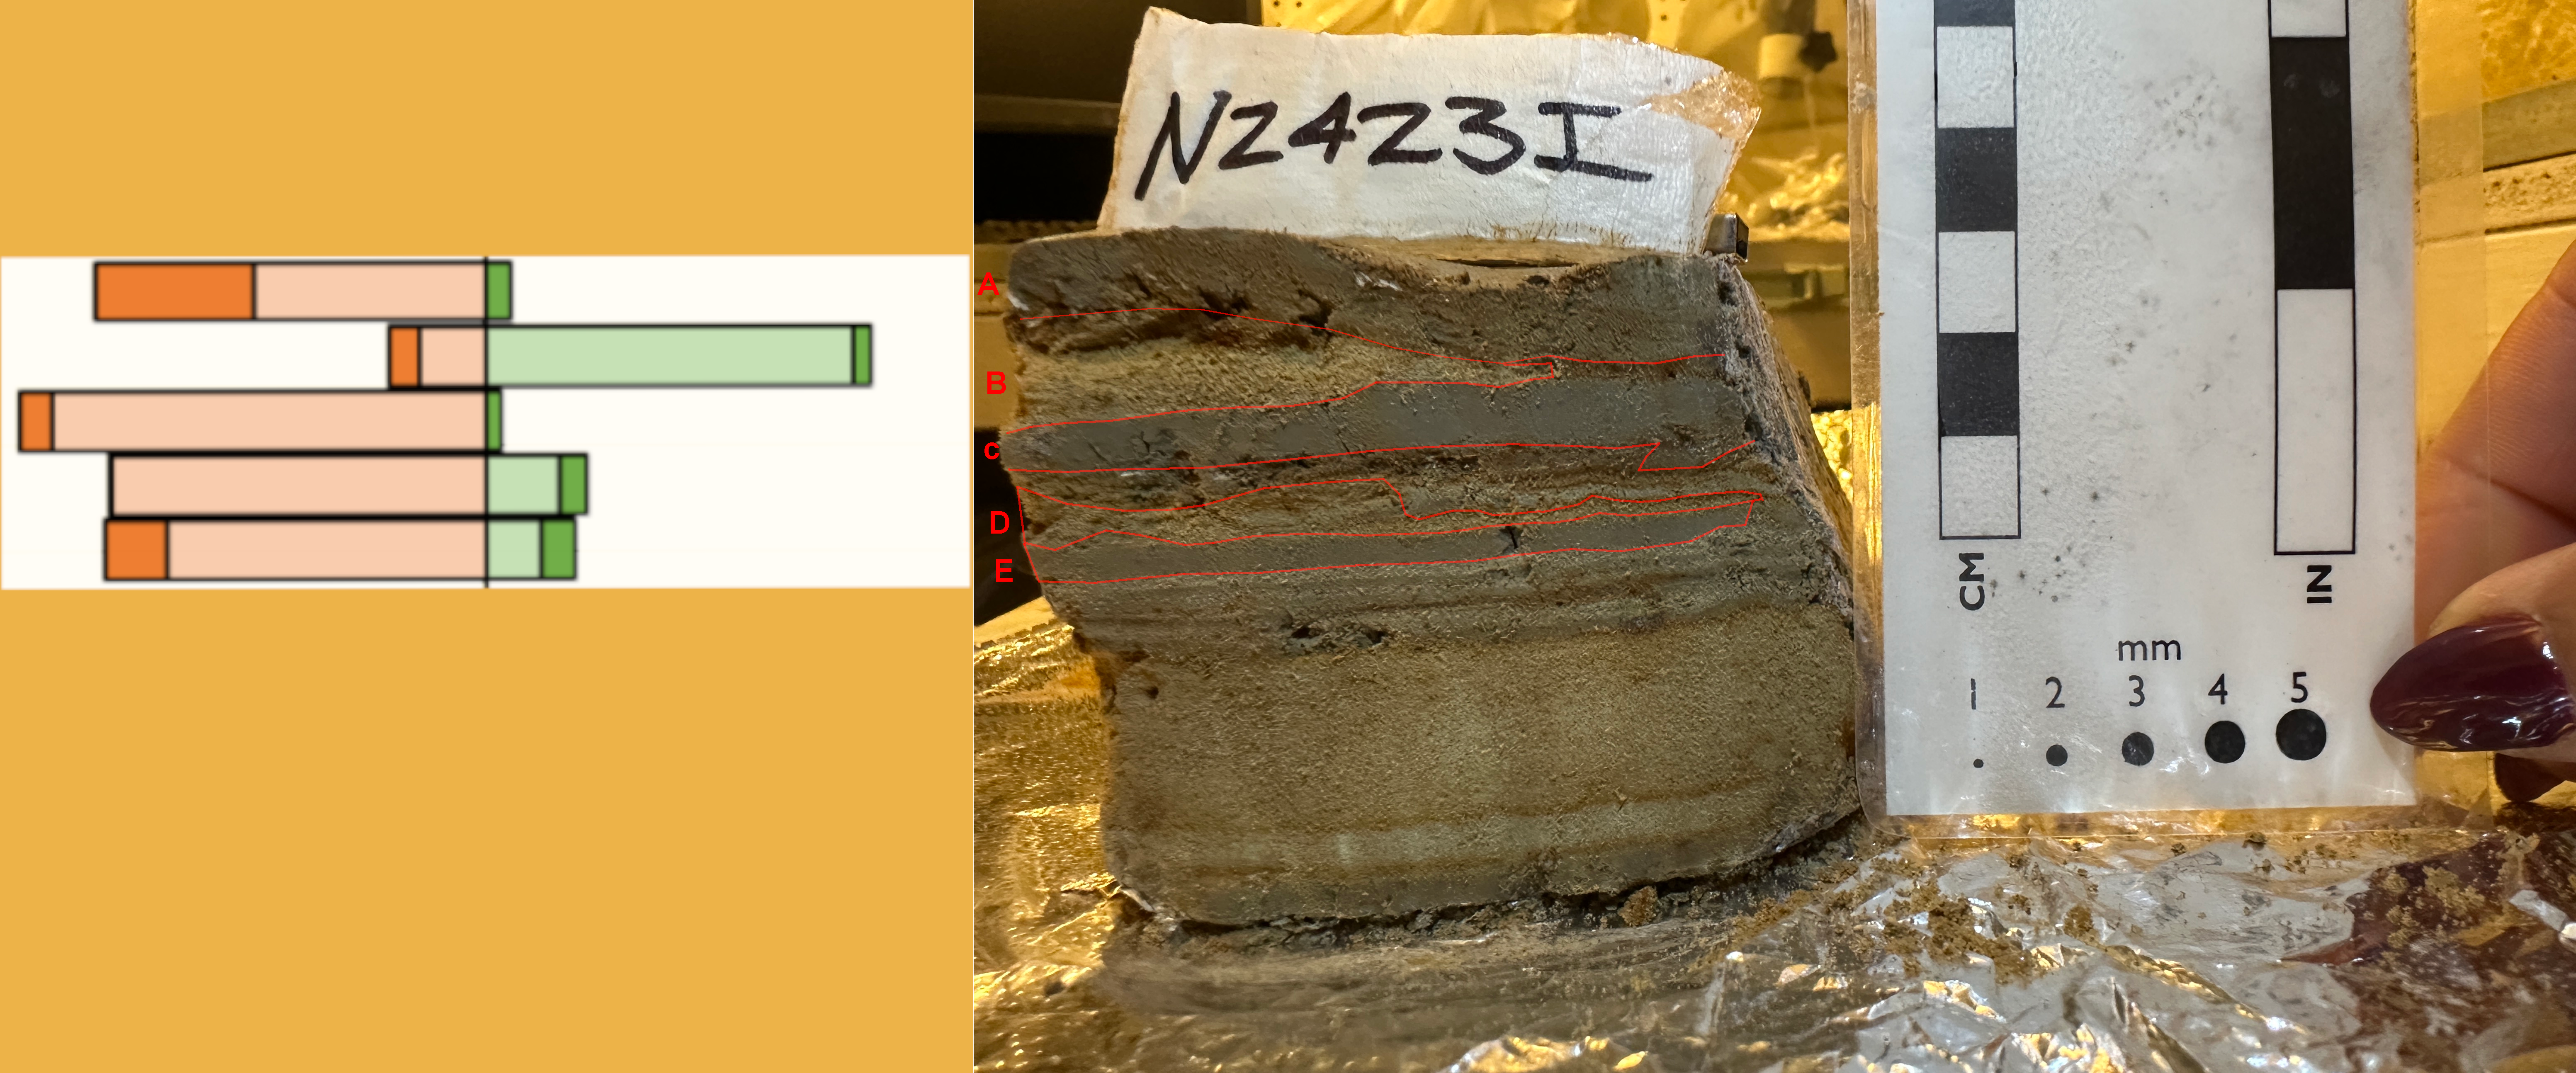 Sample NZ423I Annotated with Pollen Results - Green is Spring
Click on Image to open high resolution version in a new tab
Photo by JW - Nov. 2024
 NZ423I in the Lab
Click on Image to open high resolution version in a new tab
Photo by JW - Nov. 2024
 NZ423K Resample Bottom Piece in the Lab
Click on Image to open high resolution version in a new tab
Photo by JW - Nov. 2024
 NZ423K Resample Bottom Piece in the Lab
Click on Image to open high resolution version in a new tab
Photo by JW - Nov. 2024
 NZ423K Resample Bottom Piece Annotated with Pollen Results - Green is Spring
Click on Image to open high resolution version in a new tab
Photo by JW - Nov. 2024
 NZ423K Resample Bottom Piece in the Lab
Click on Image to open high resolution version in a new tab
Photo by JW - Nov. 2024
 Initial Thin Sections of NZ423I and NZ423K Resample Bottom Piece
Click on Image to open high resolution version in a new tab
from National Petrographic October 2025
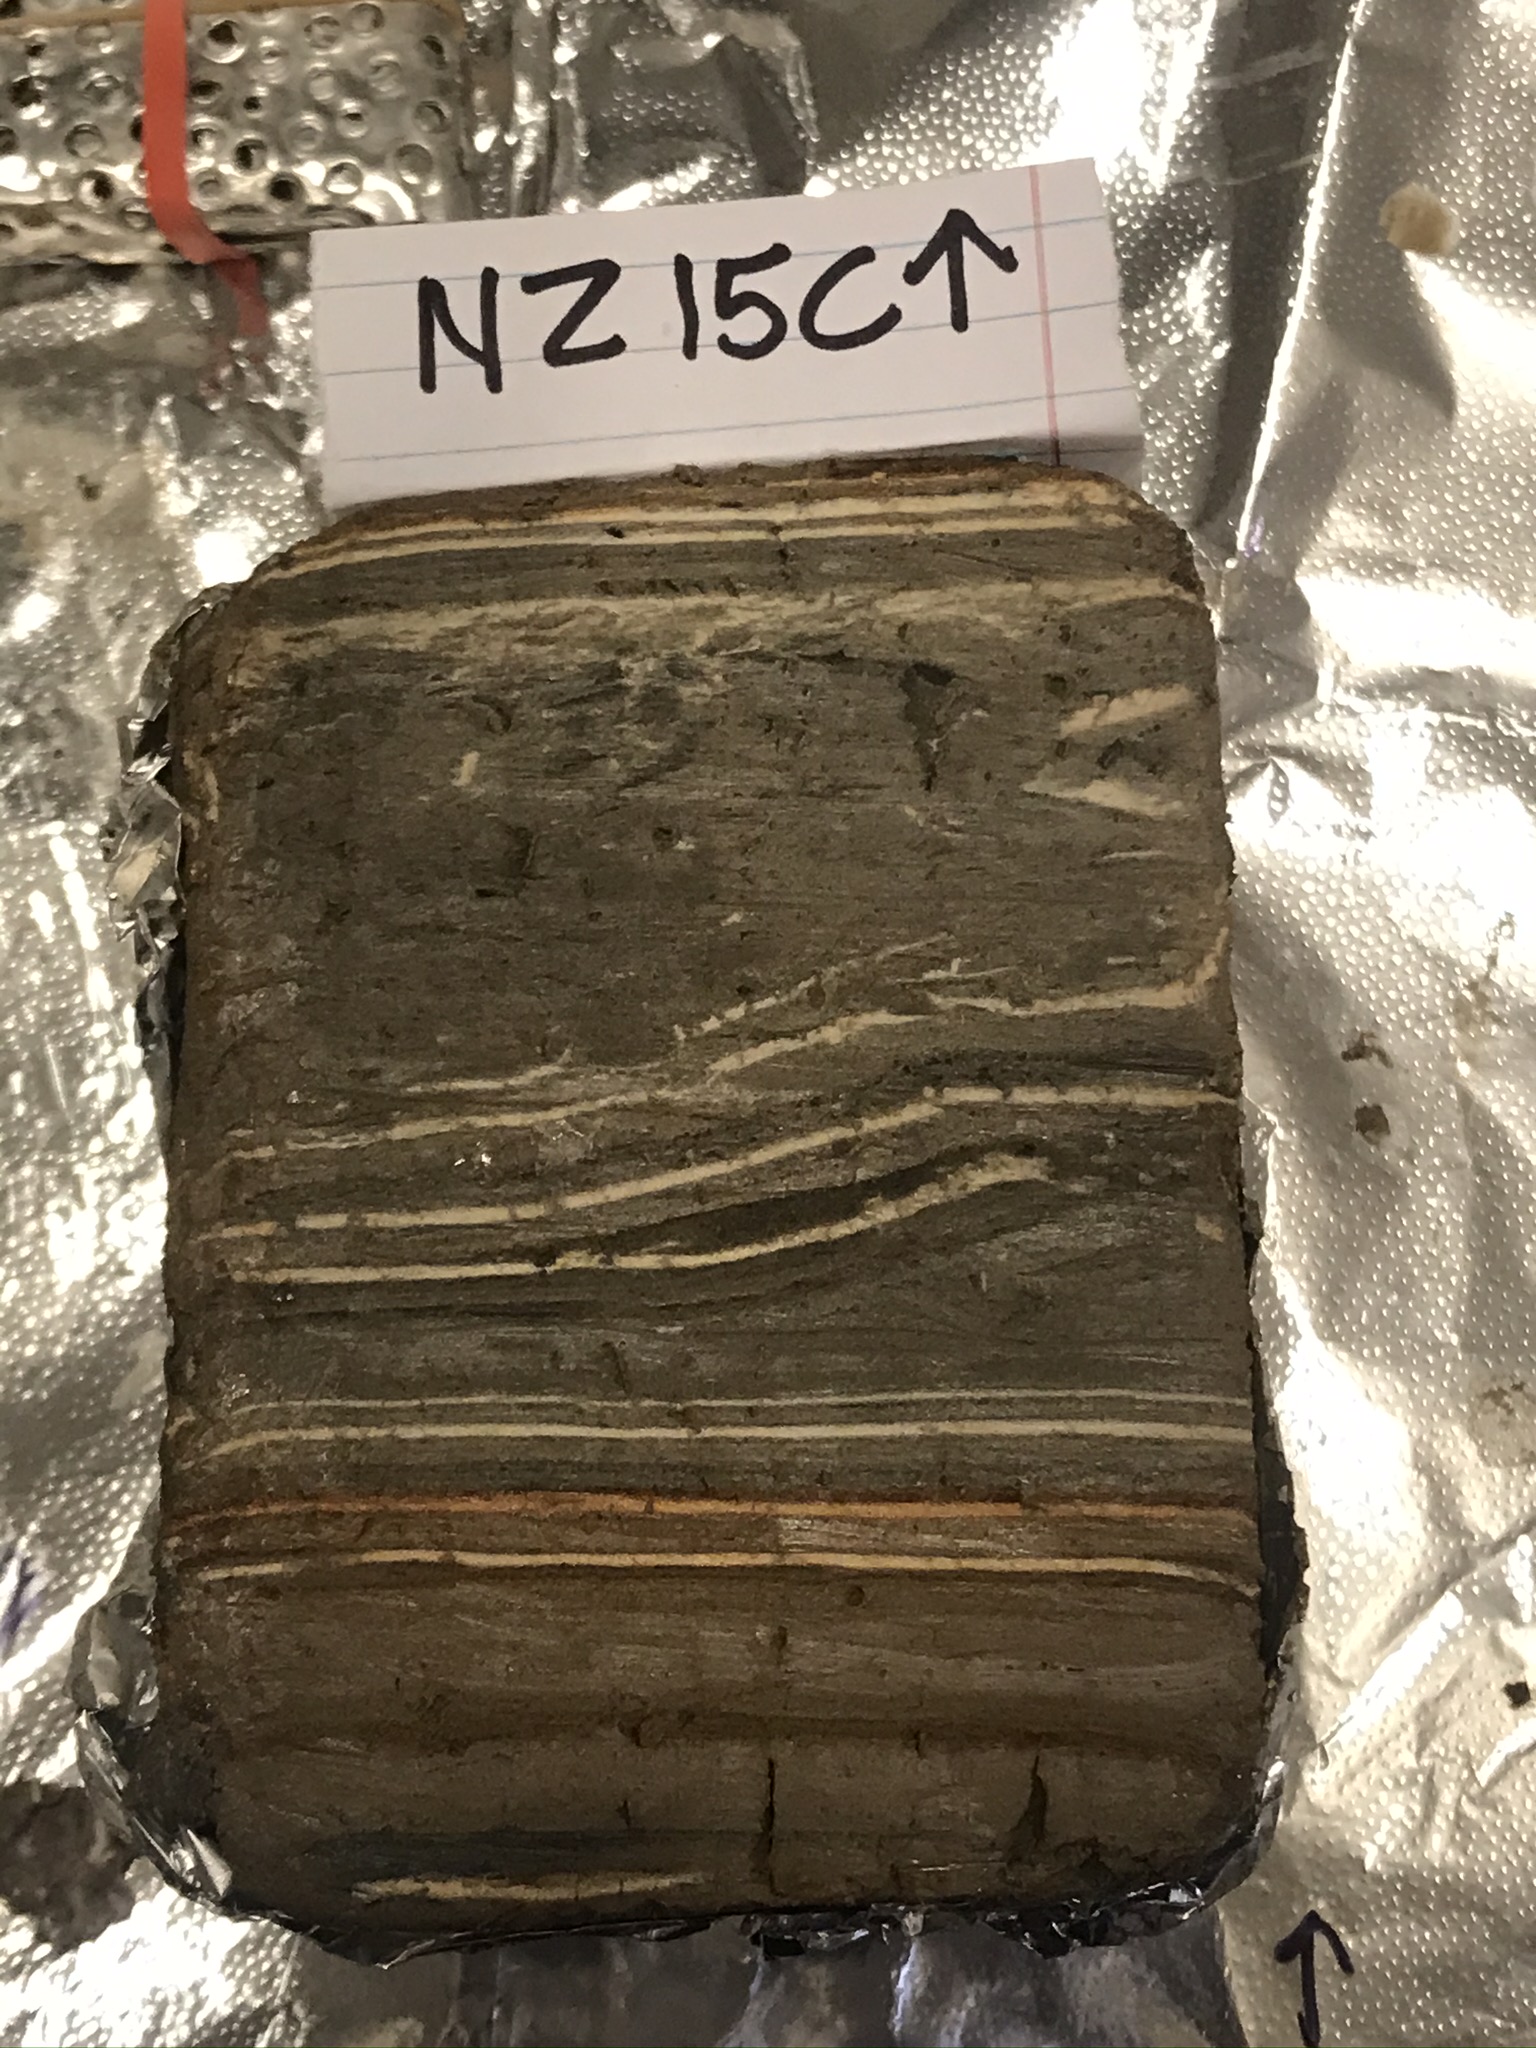 NZ15C in the Lab
Click on Image to open high resolution version in a new tab
Photo by JW
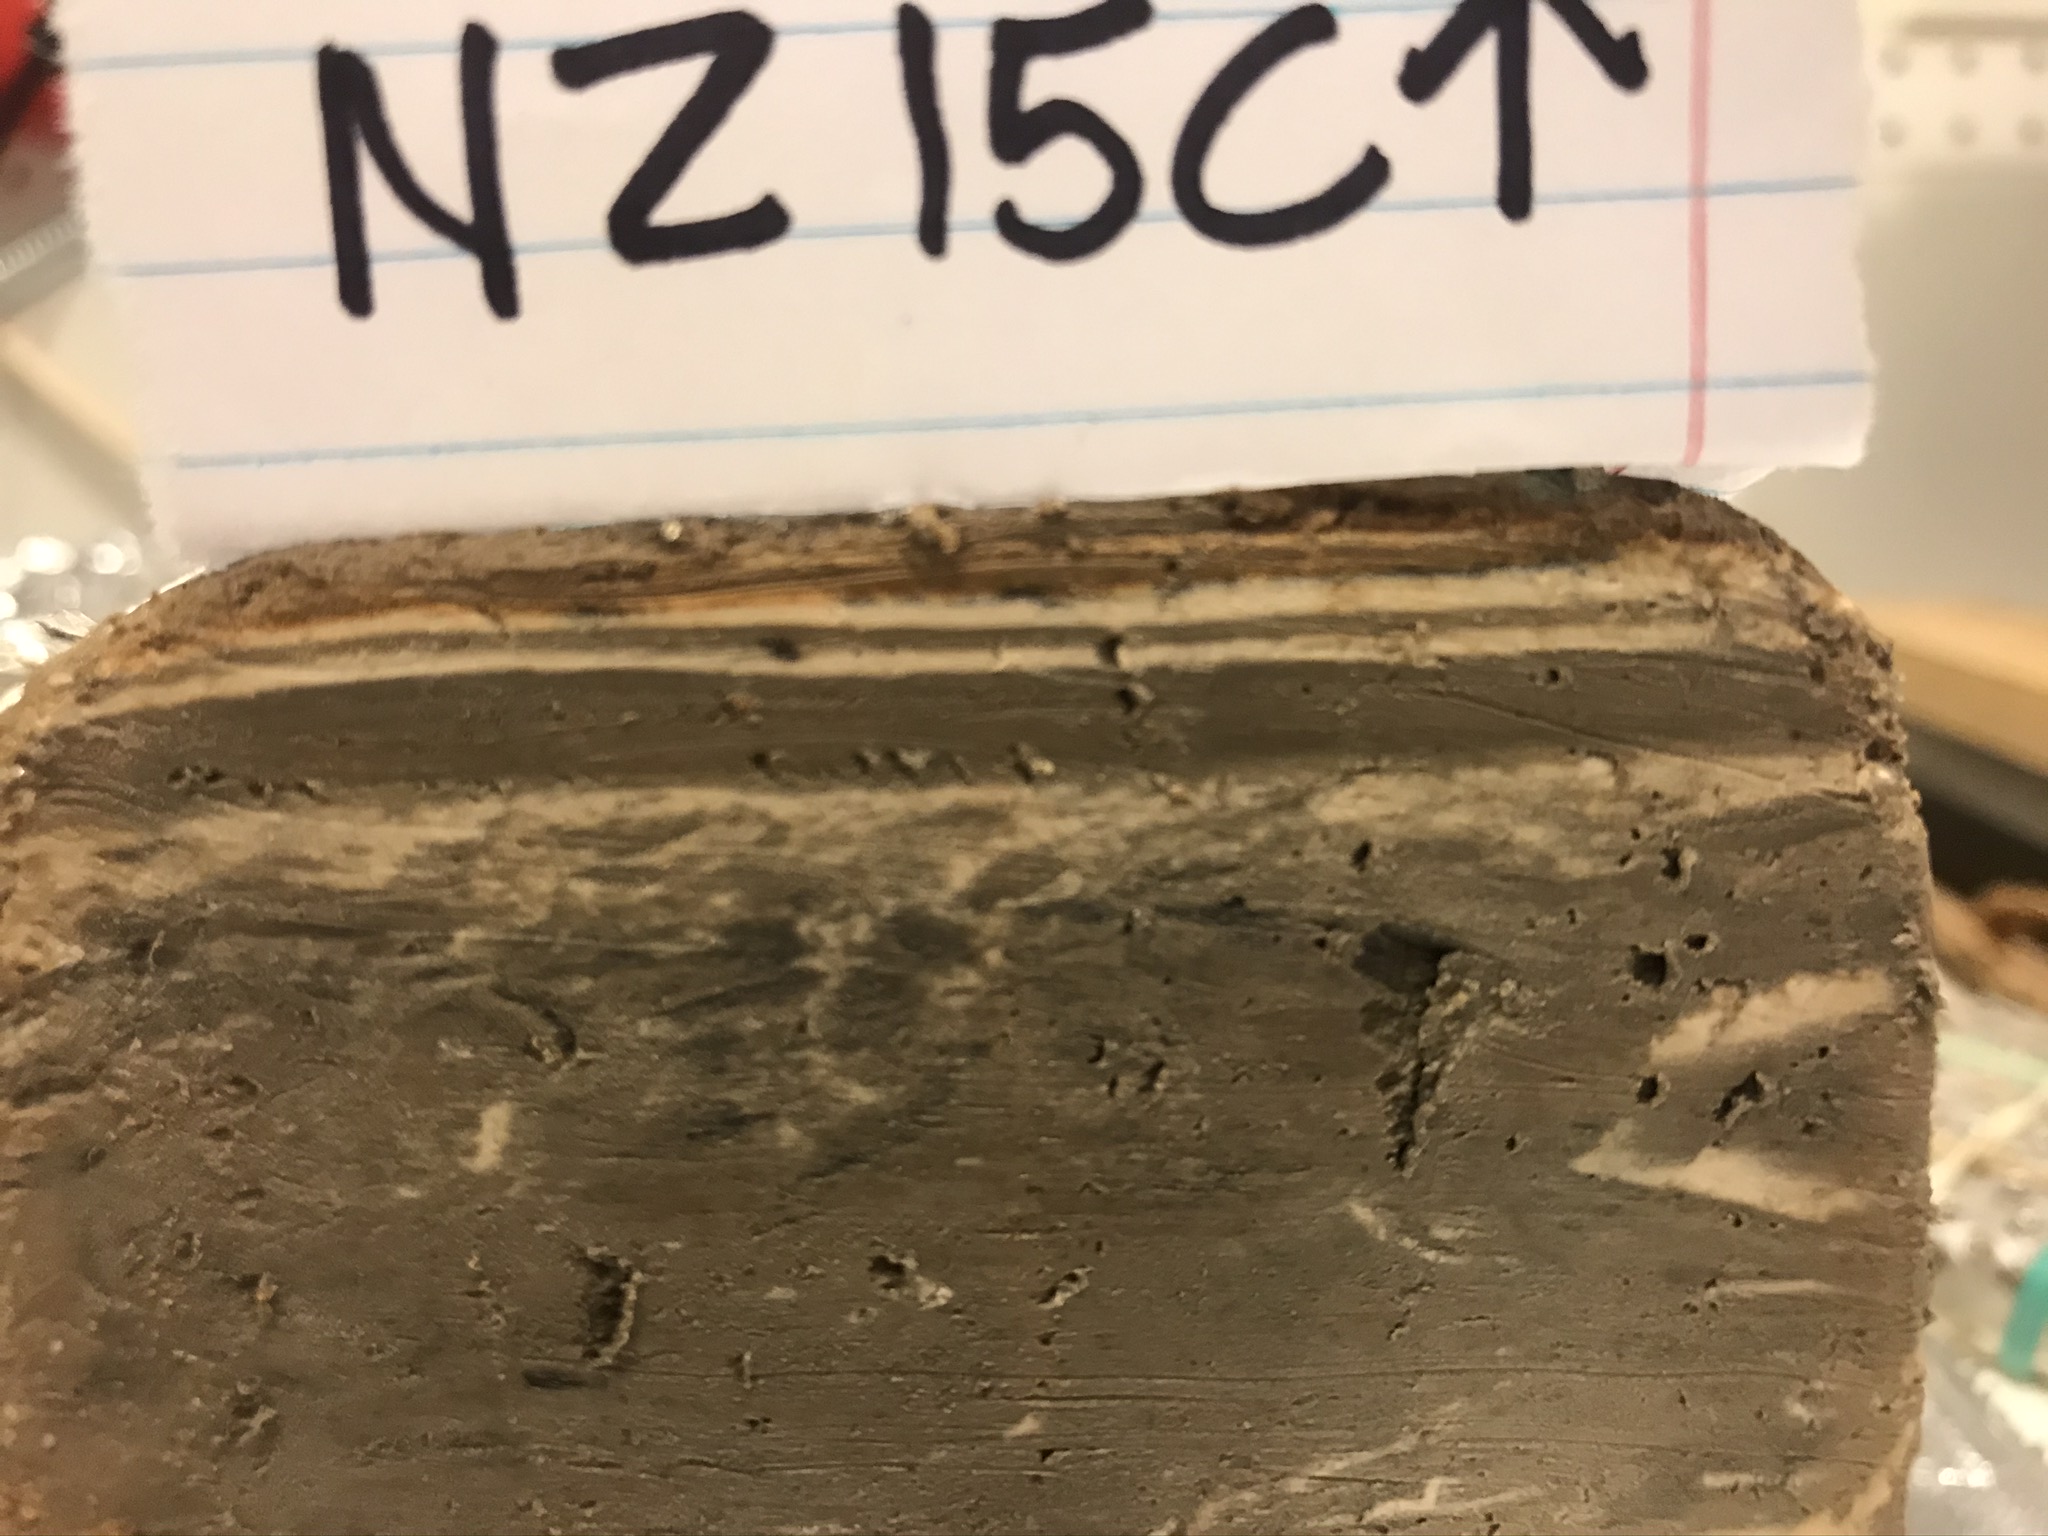 NZ15C in the Lab
Click on Image to open high resolution version in a new tab
Photo by JW
 NZ15C in the Lab - Annotated
Click on Image to open high resolution version in a new tab
Photo by JW
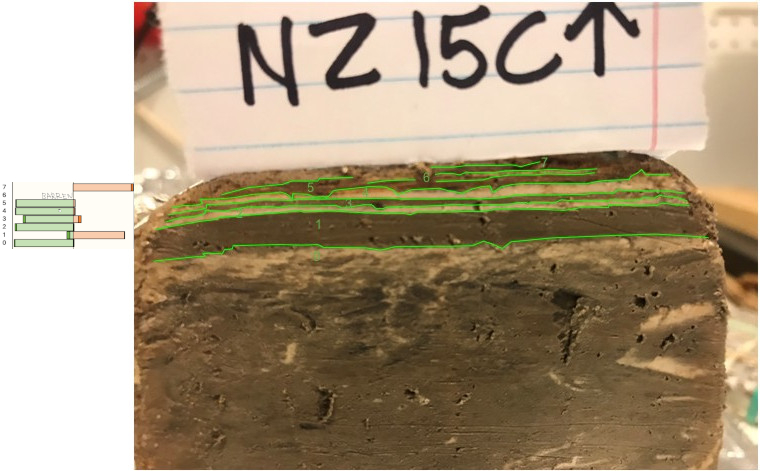 NZ15C in the Lab - Annotated with POllen - Green is Spring
Click on Image to open high resolution version in a new tab
Photo by JW
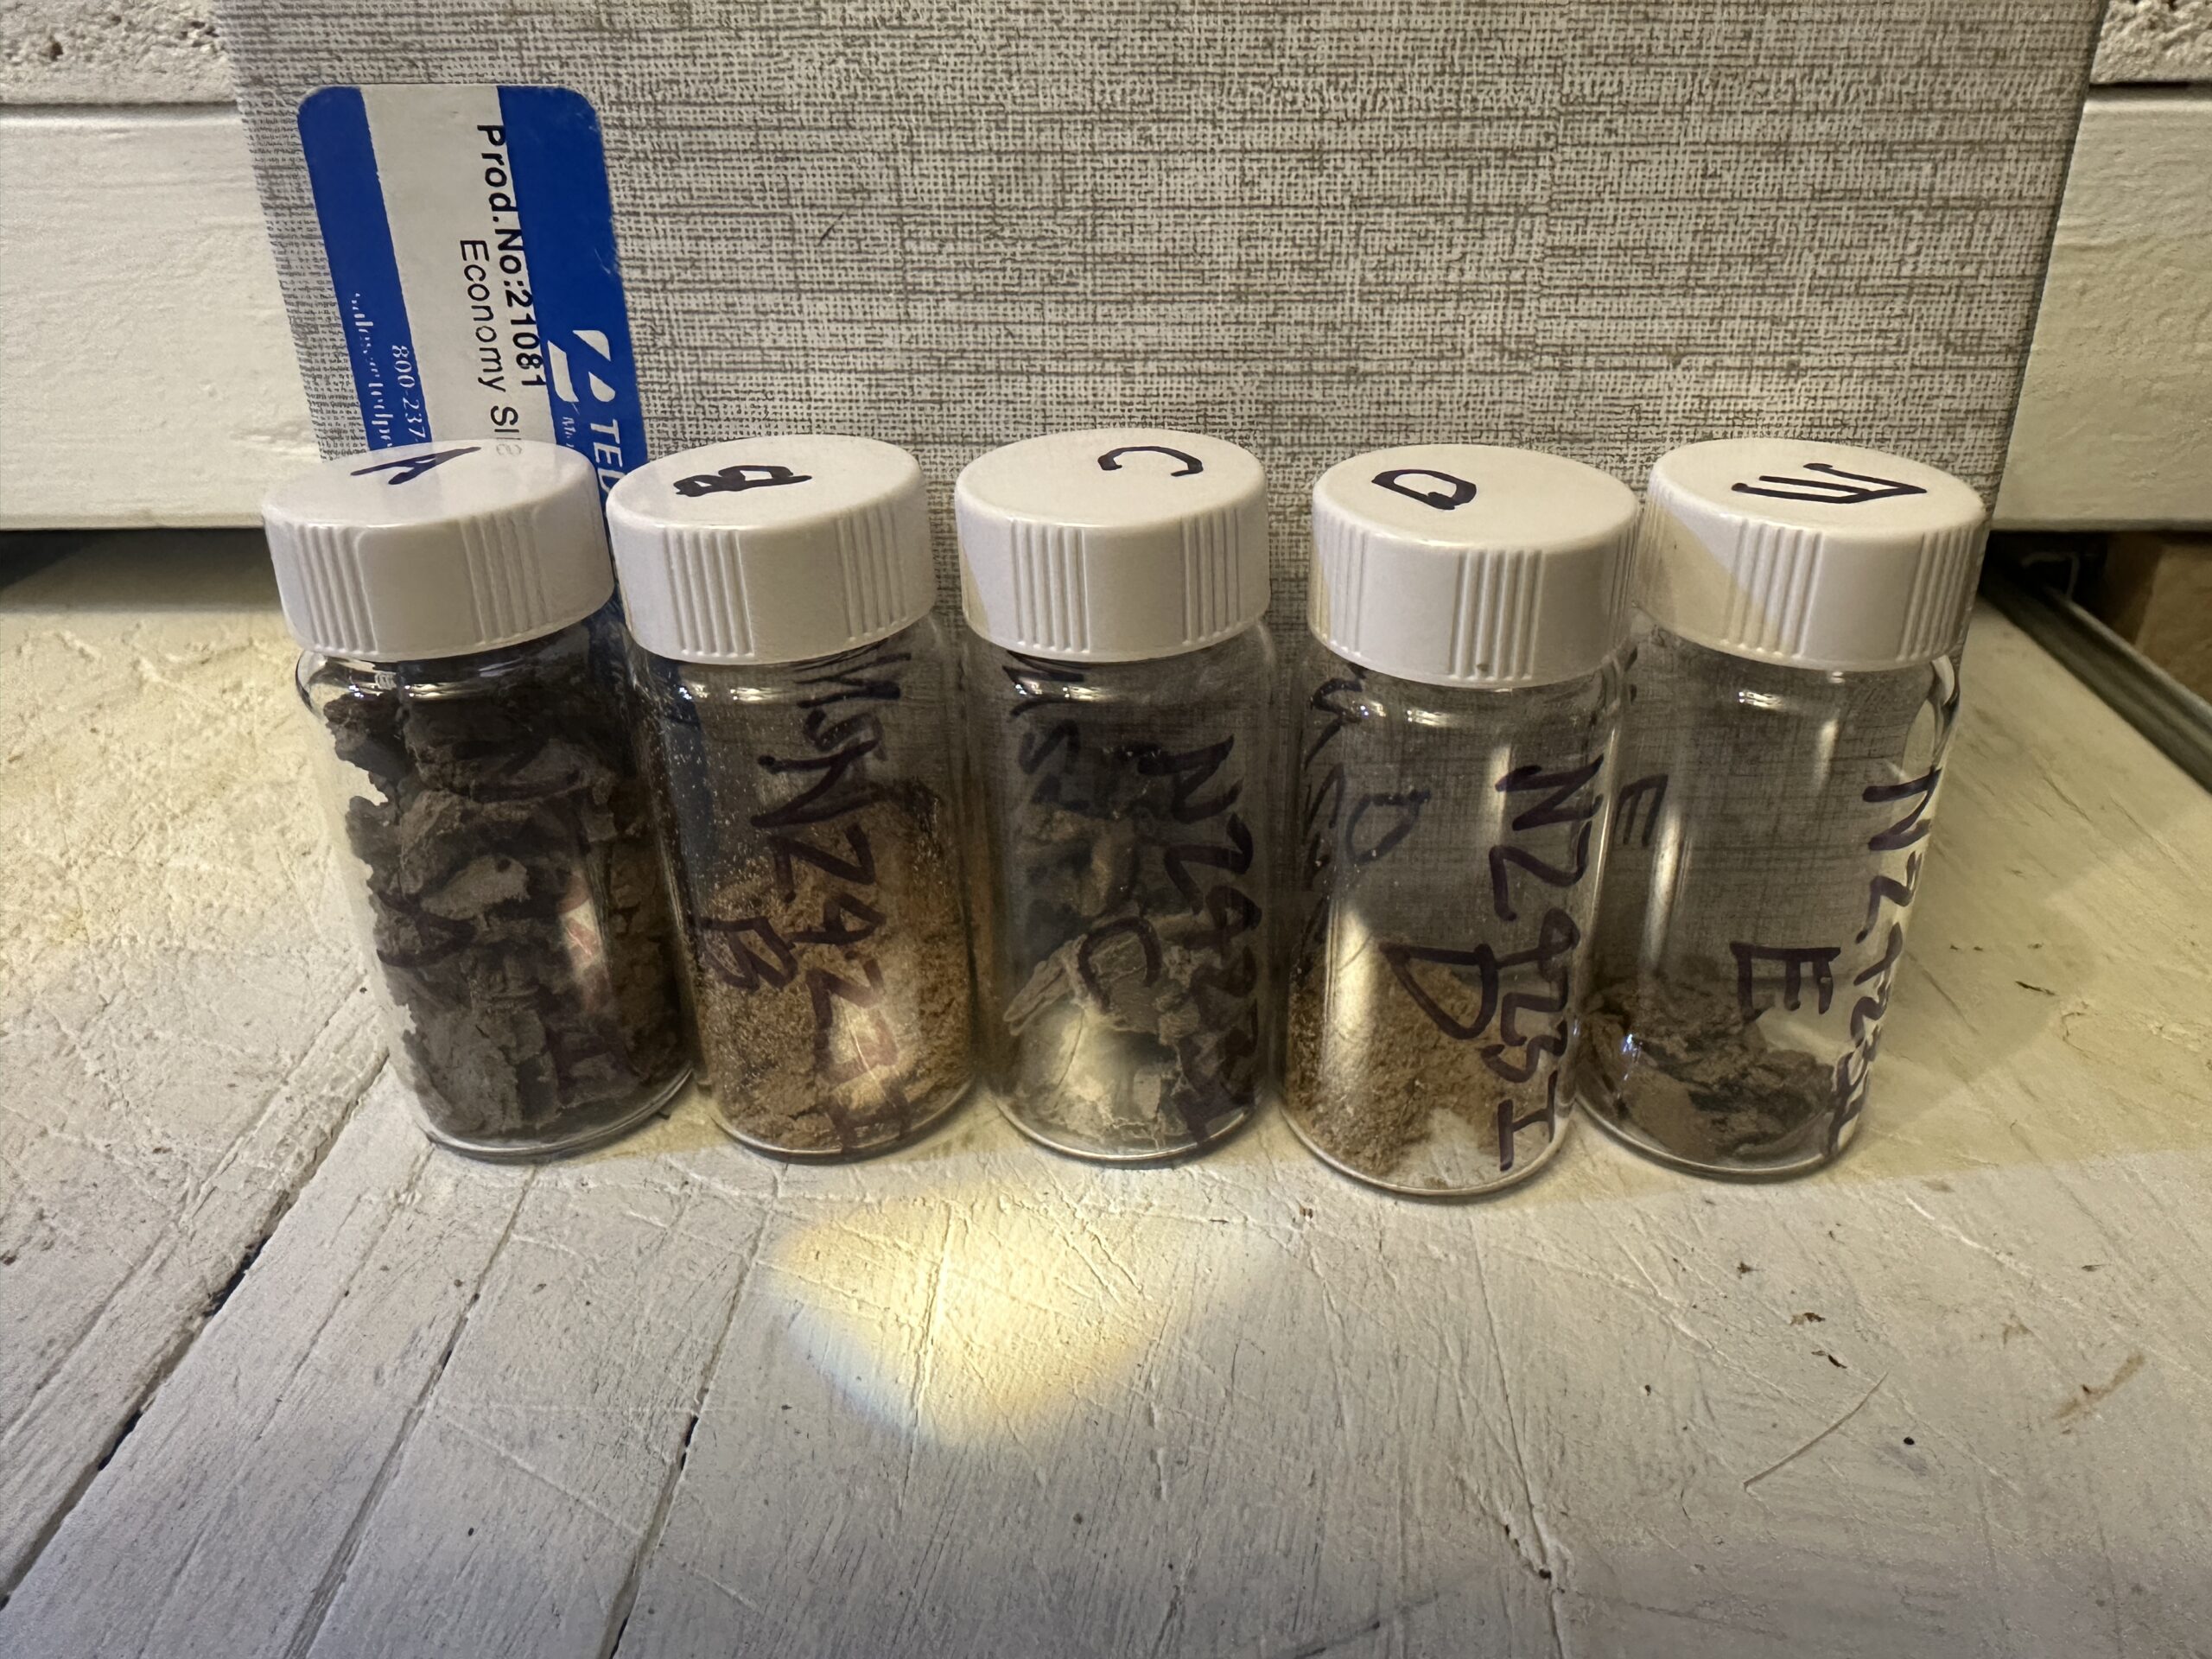
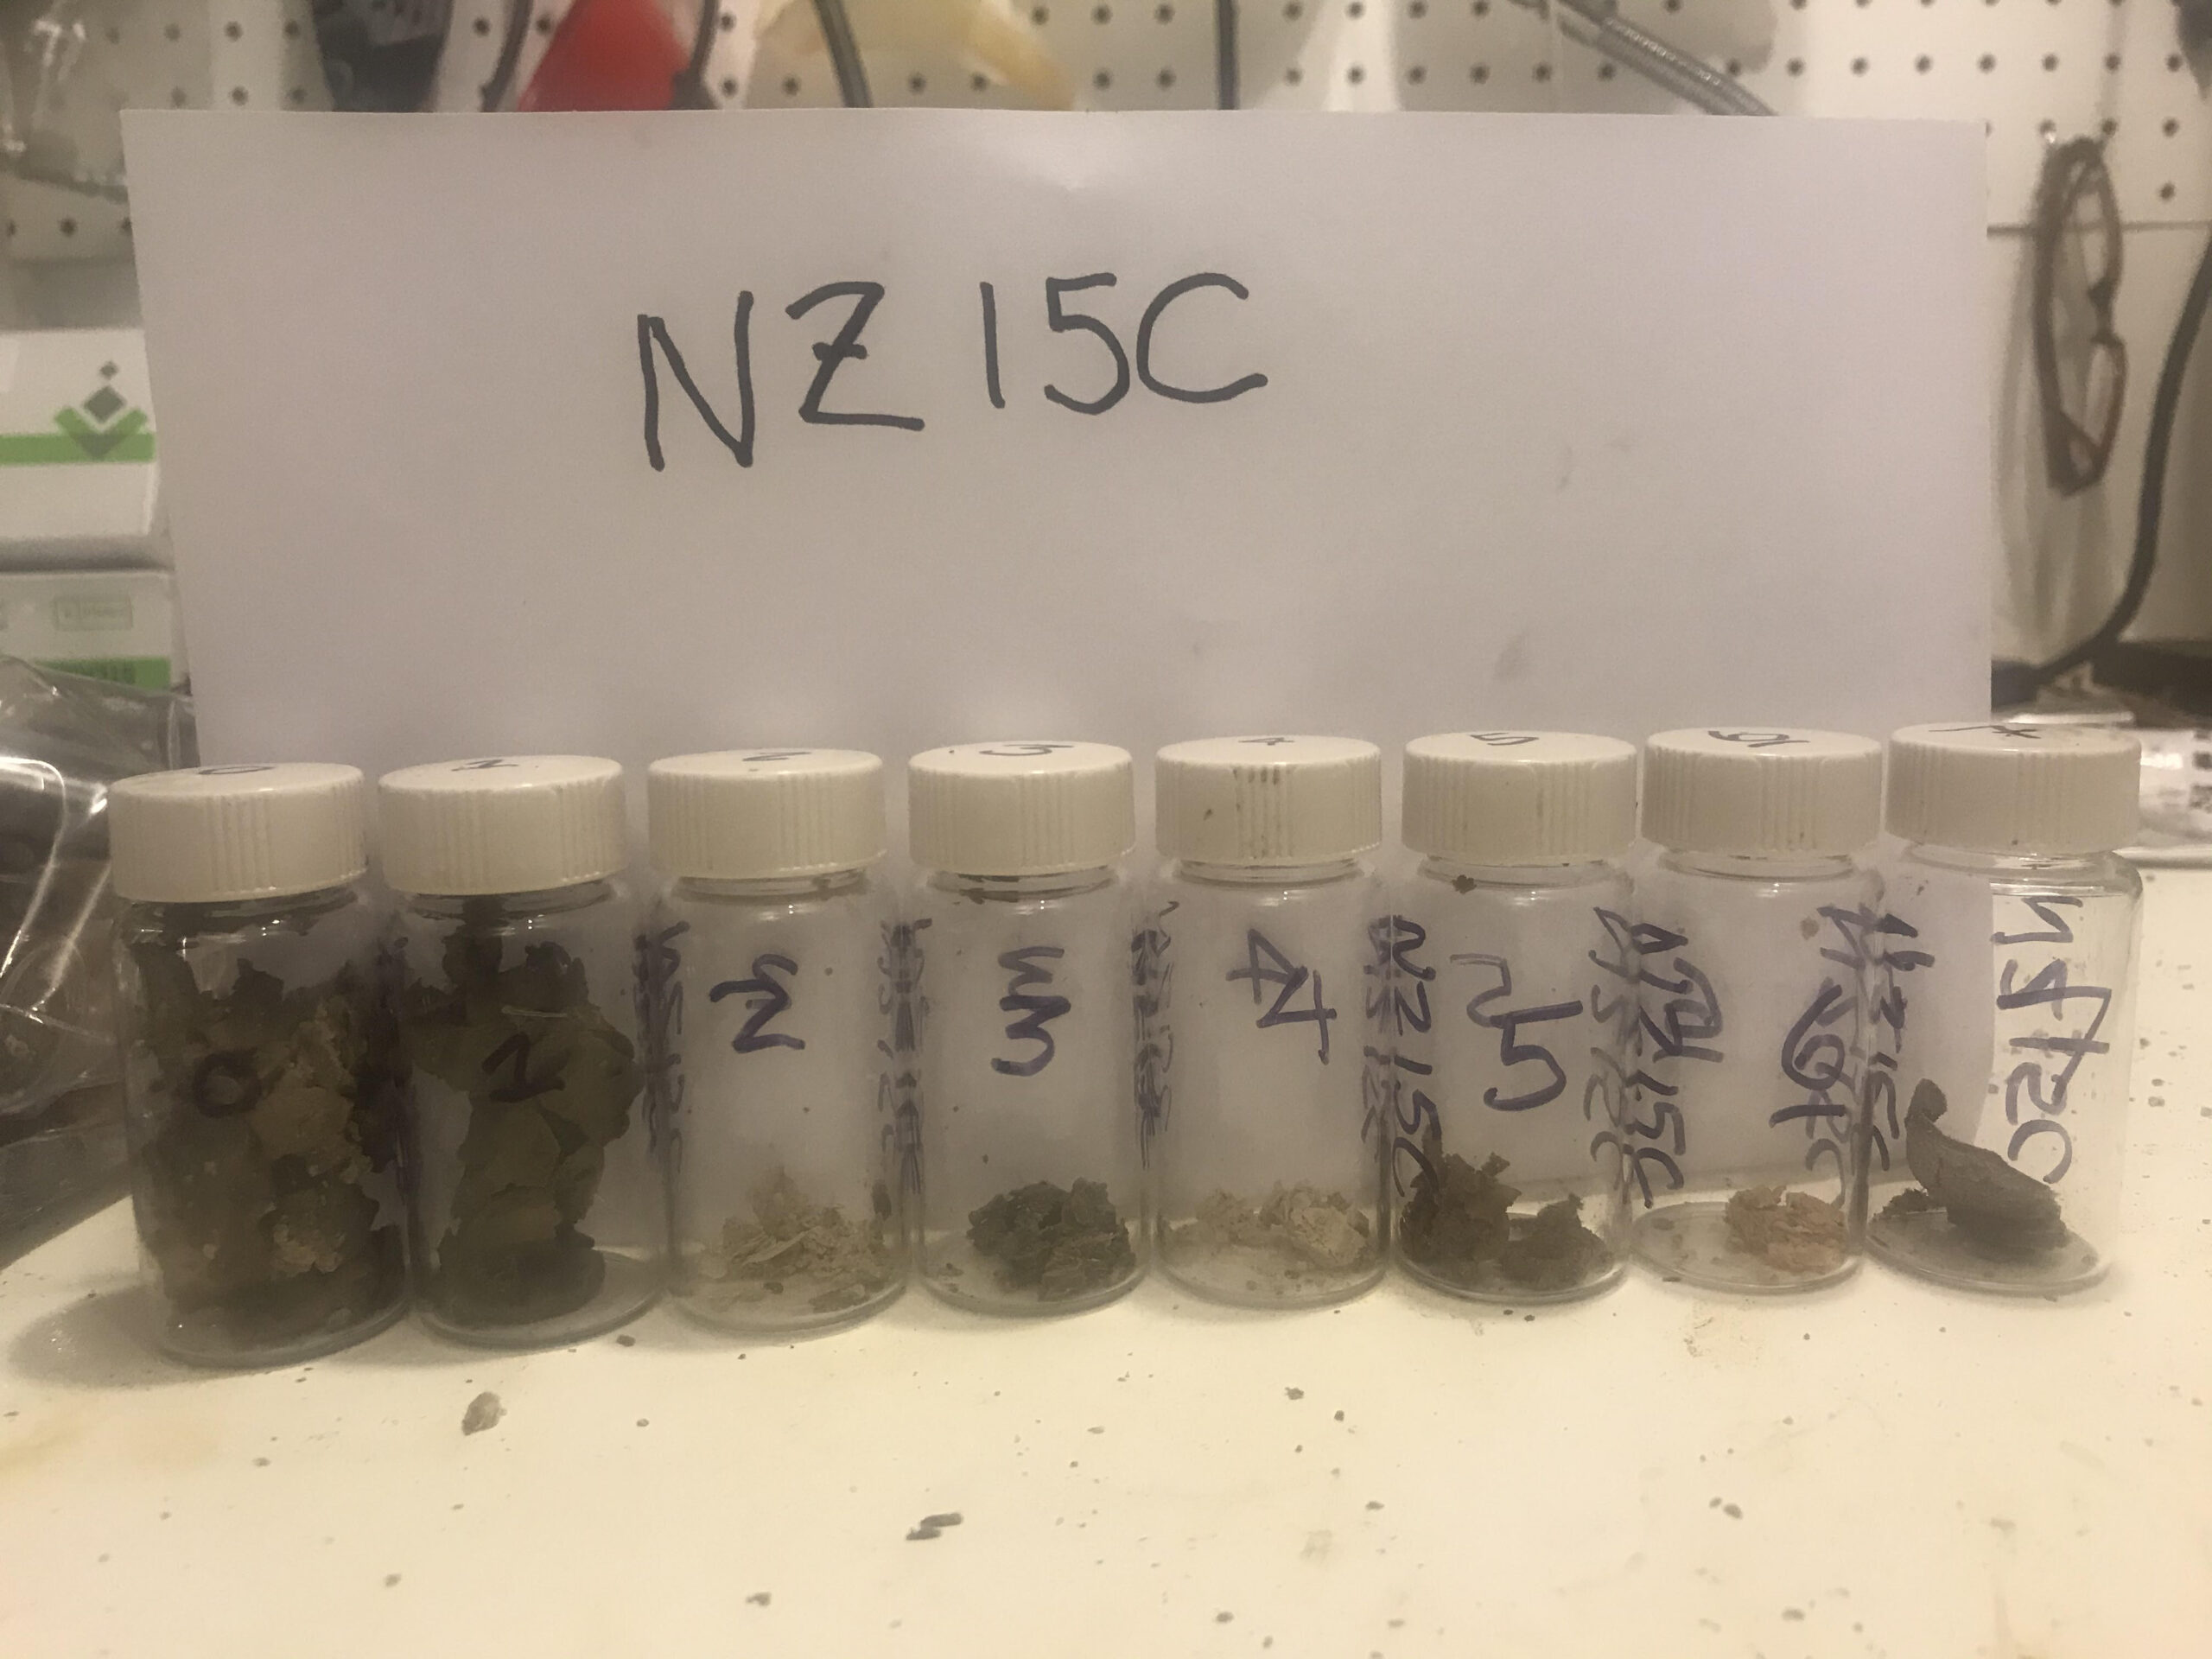 NZ15C Sample Bottles
Click on Image to open high resolution version in a new tab
Photo by JW
Thin Section Slide of NZ415CClick on Image to open high resolution version in a new tab
Photo by JW
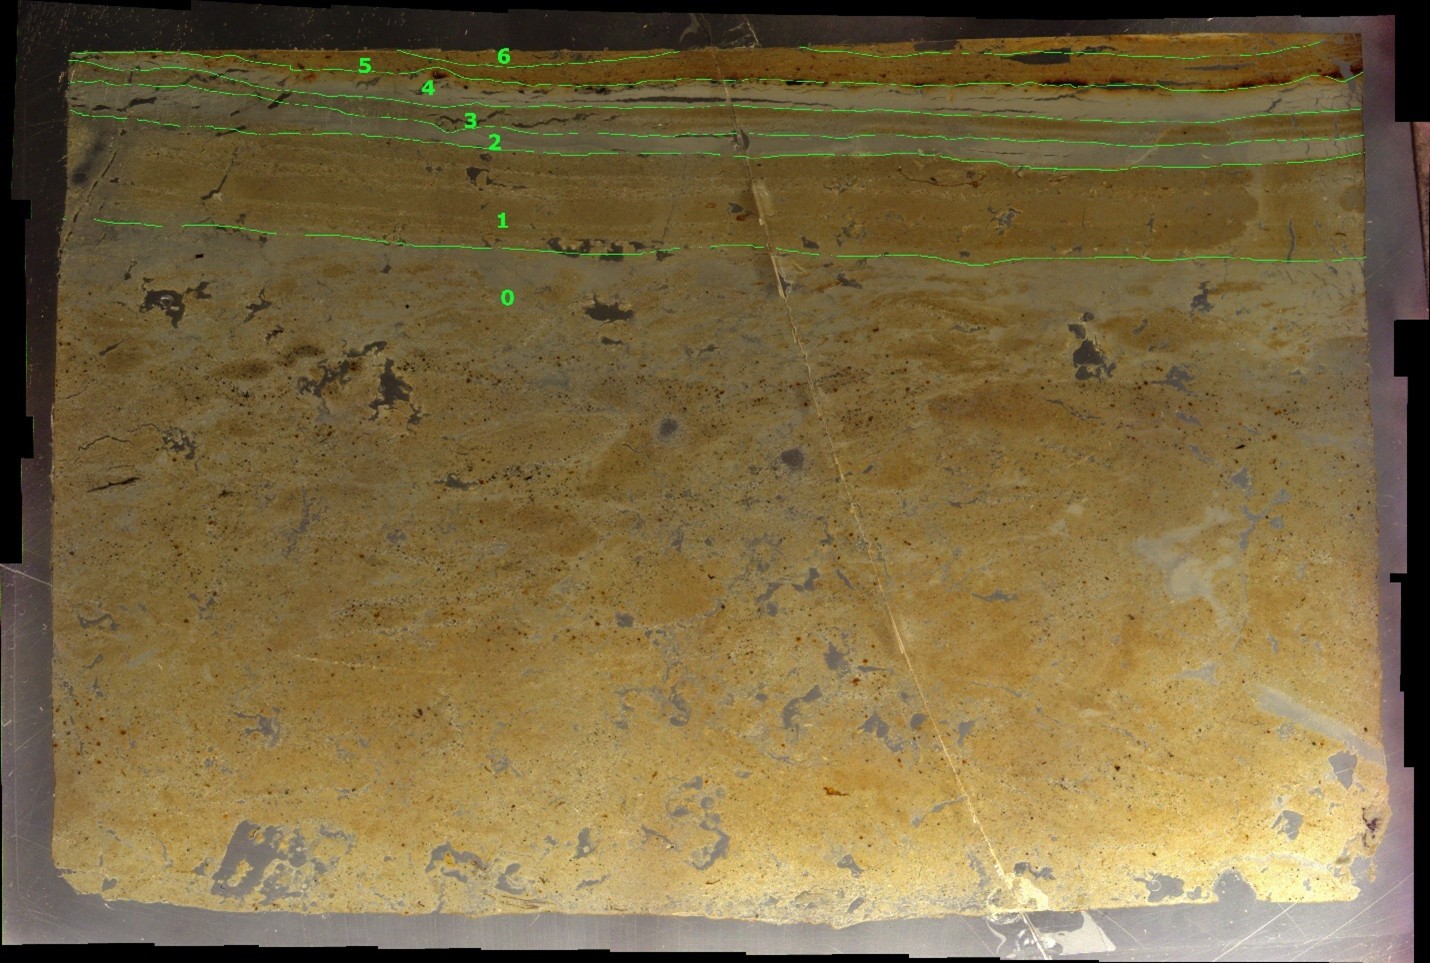 Thin Section Slide of NZ415C
Click on Image to open high resolution version in a new tab
Photo by JW
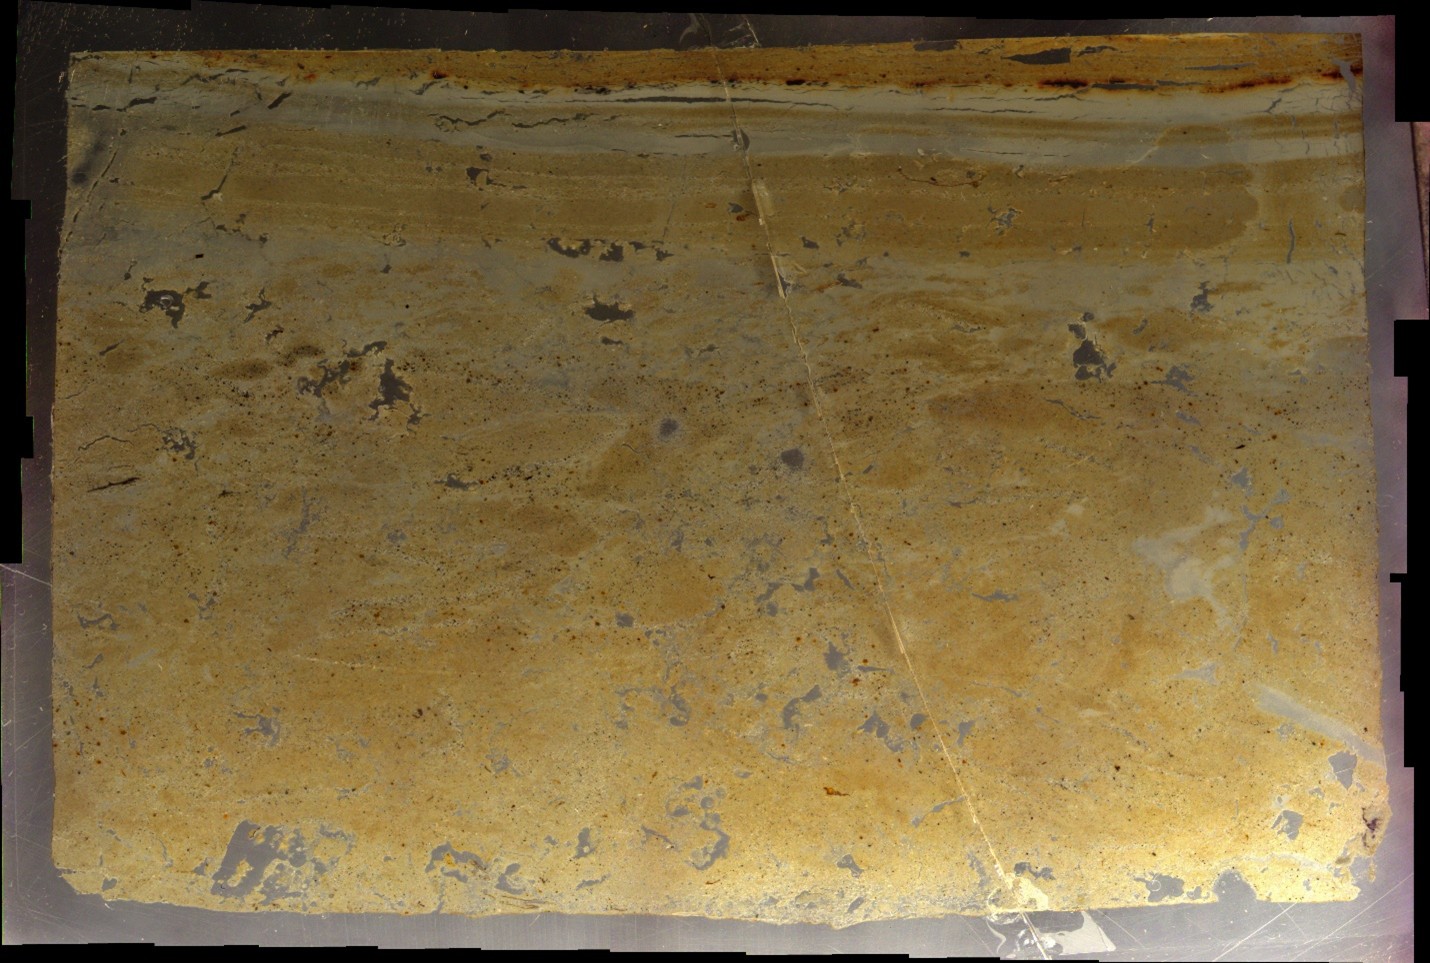 Thin Section Slide of NZ415C
Click on Image to open high resolution version in a new tab
Photo by JW
 NZ15C and NZ15D in the Field
Click on Image to open high resolution version in a new tab
Photo by JW
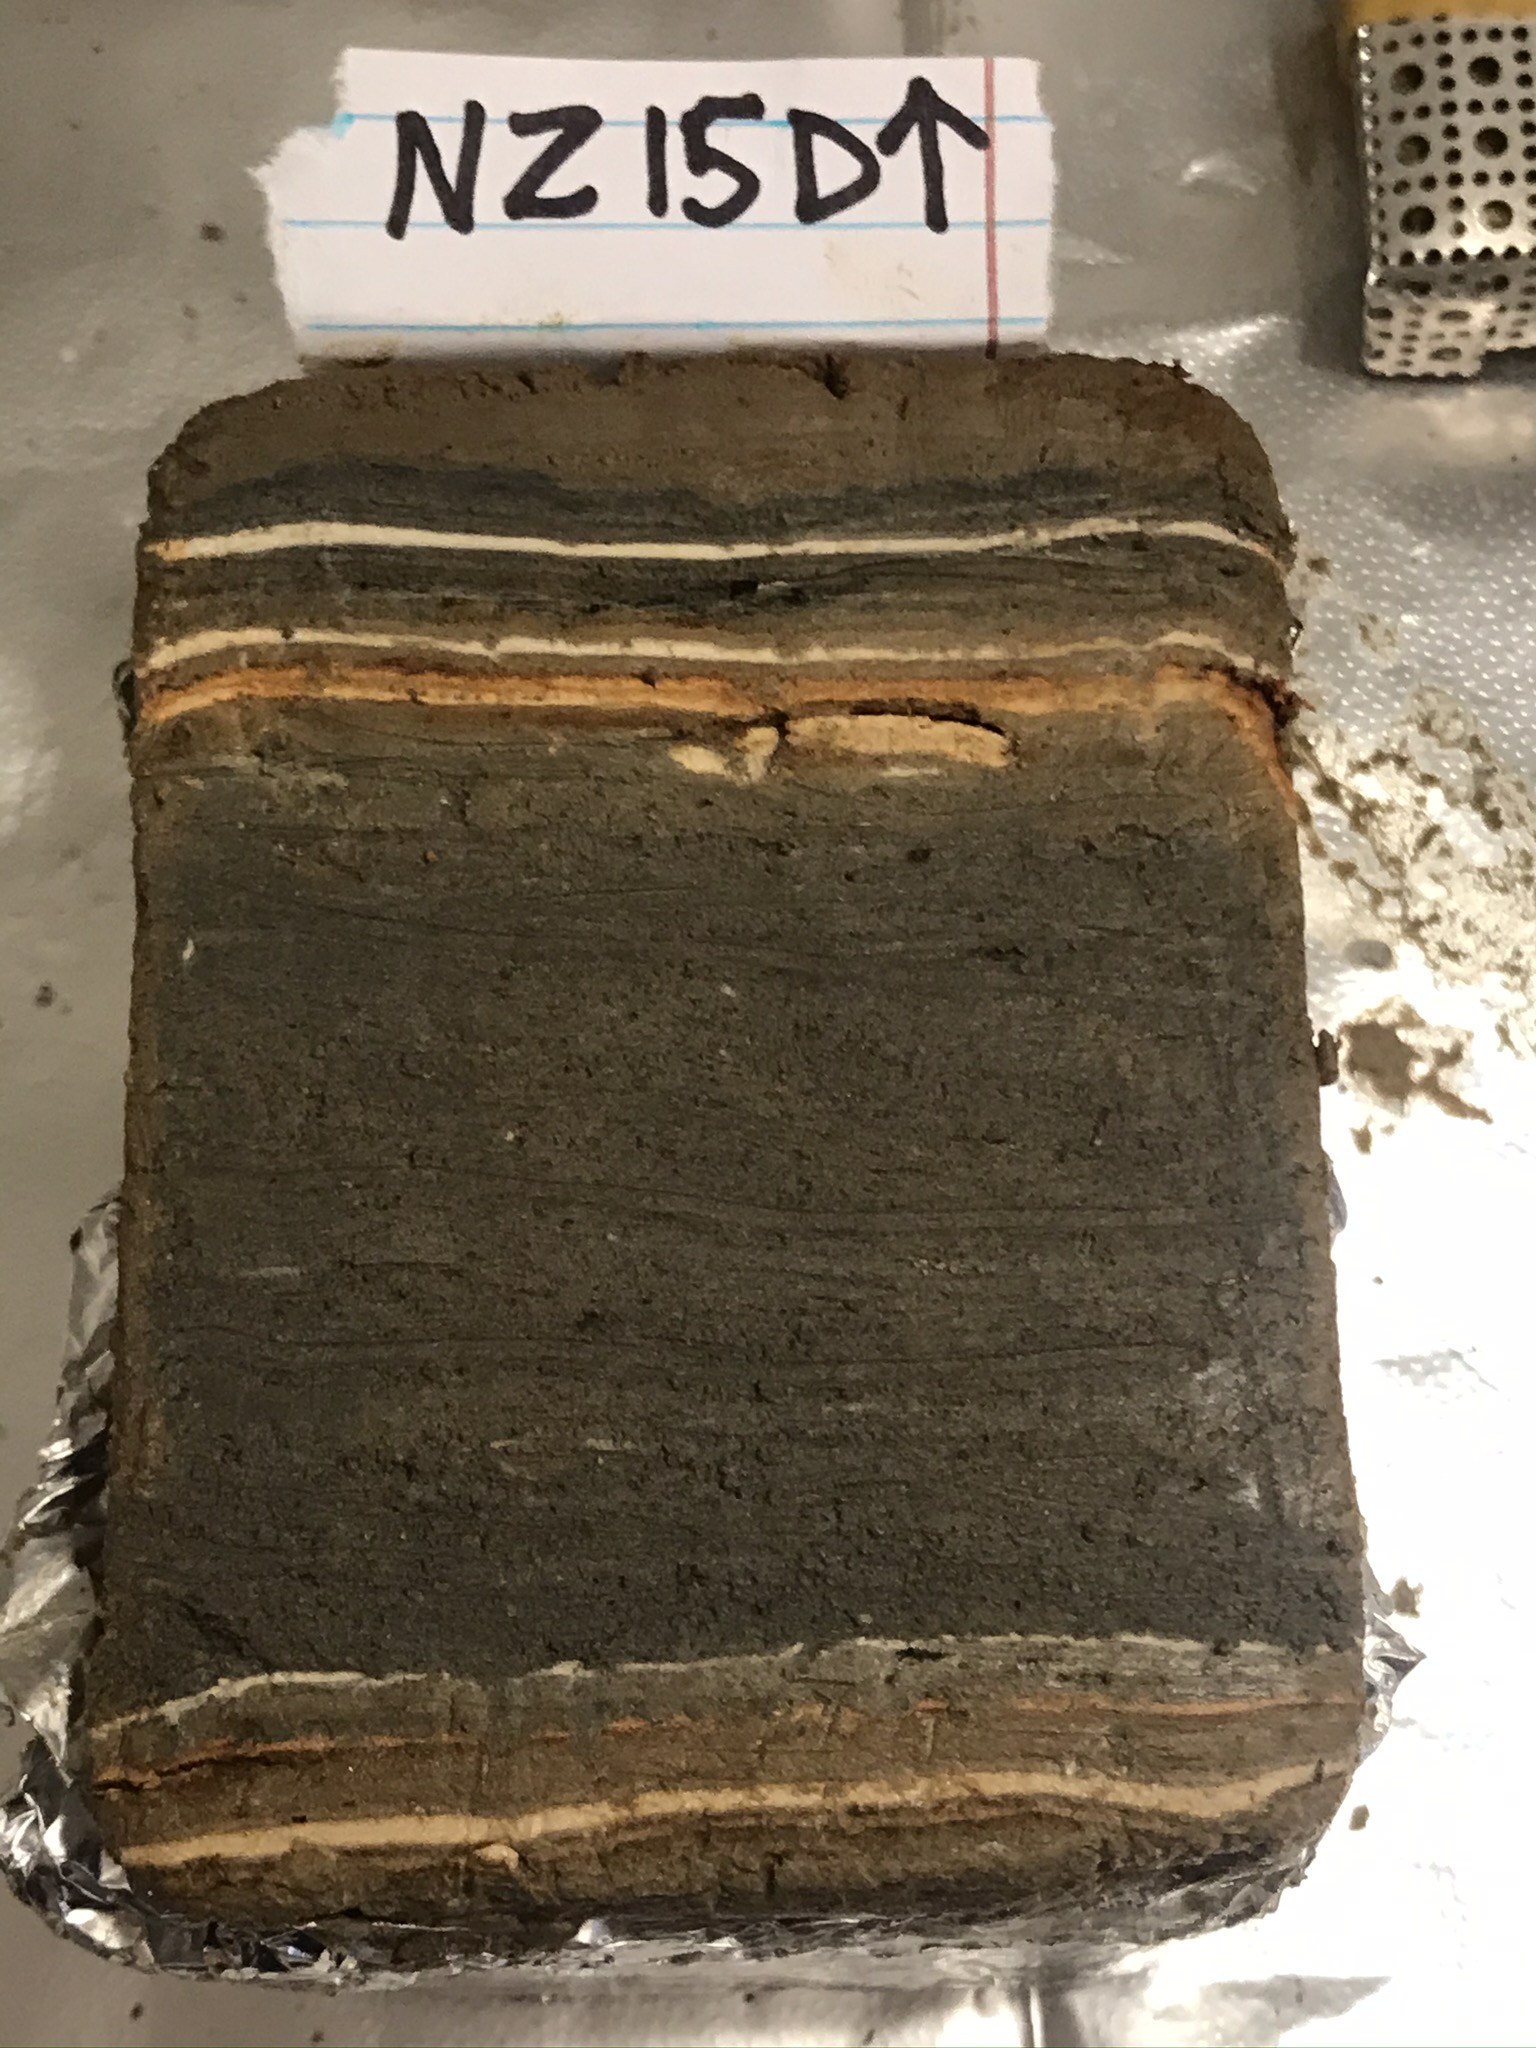 NZ15D in the Lab
Click on Image to open high resolution version in a new tab
Photo by JW
 NZ15D in the Lab
Click on Image to open high resolution version in a new tab
Photo by JW
 NZ15D in the Lab - Annotated
Click on Image to open high resolution version in a new tab
Photo by JW
 NZ15D in the Lab - Annotated with Pollen - Spring is Green
Click on Image to open high resolution version in a new tab
Photo by JW
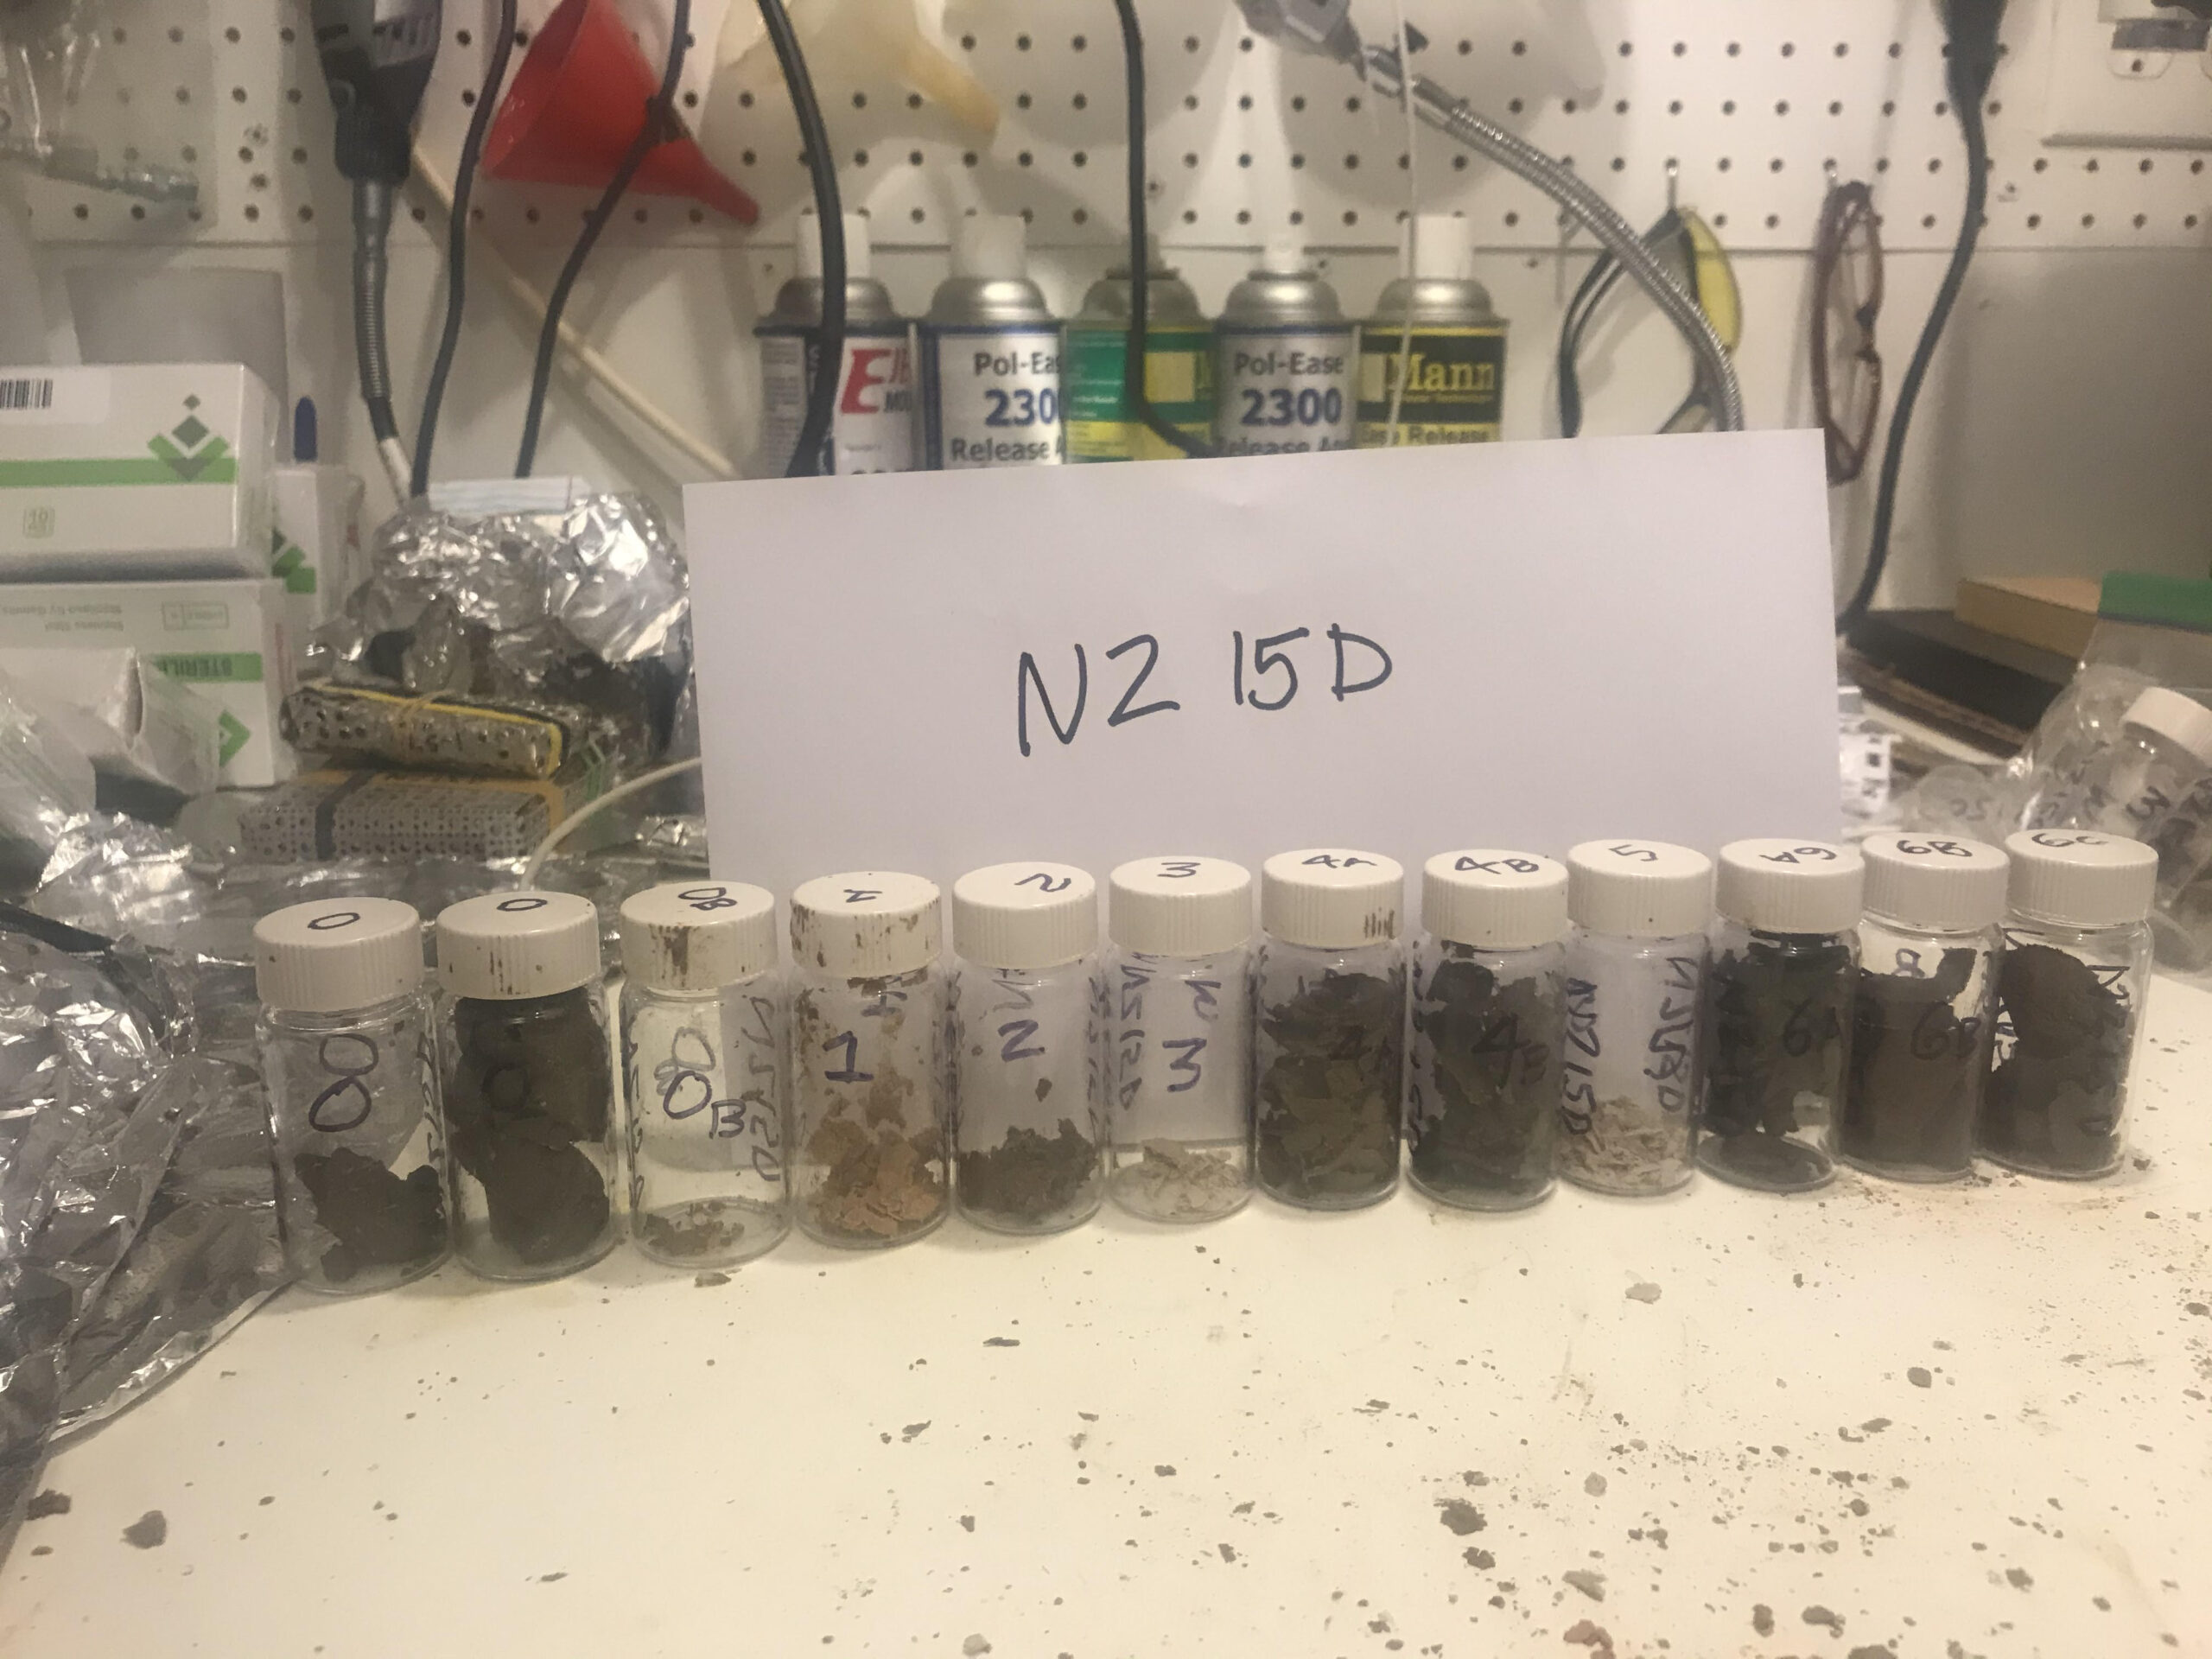 NZ15D Sample Bottles
Click on Image to open high resolution version in a new tab
Photo by JW
Thin Section Slide of NZ415DClick on Image to open high resolution version in a new tab
Photo by JW
 Thin Section Slide of NZ415D
Click on Image to open high resolution version in a new tab
Photo by JW
 Thin Section Slide of NZ415D
Click on Image to open high resolution version in a new tab
Photo by JW
NZ15C and NZ15D in the FieldClick on Image to open high resolution version in a new tab
Photo by JW
 NZ15G in the Lab
Click on Image to open high resolution version in a new tab
Photo by JW
 NZ15G in the Lab
Click on Image to open high resolution version in a new tab
Photo by JW
 NZ15G in the Lab - Annotated
Click on Image to open high resolution version in a new tab
Photo by JW
 NZ15G in the Lab - Annotated with Pollen - Spring is Green
Click on Image to open high resolution version in a new tab
Photo by JW
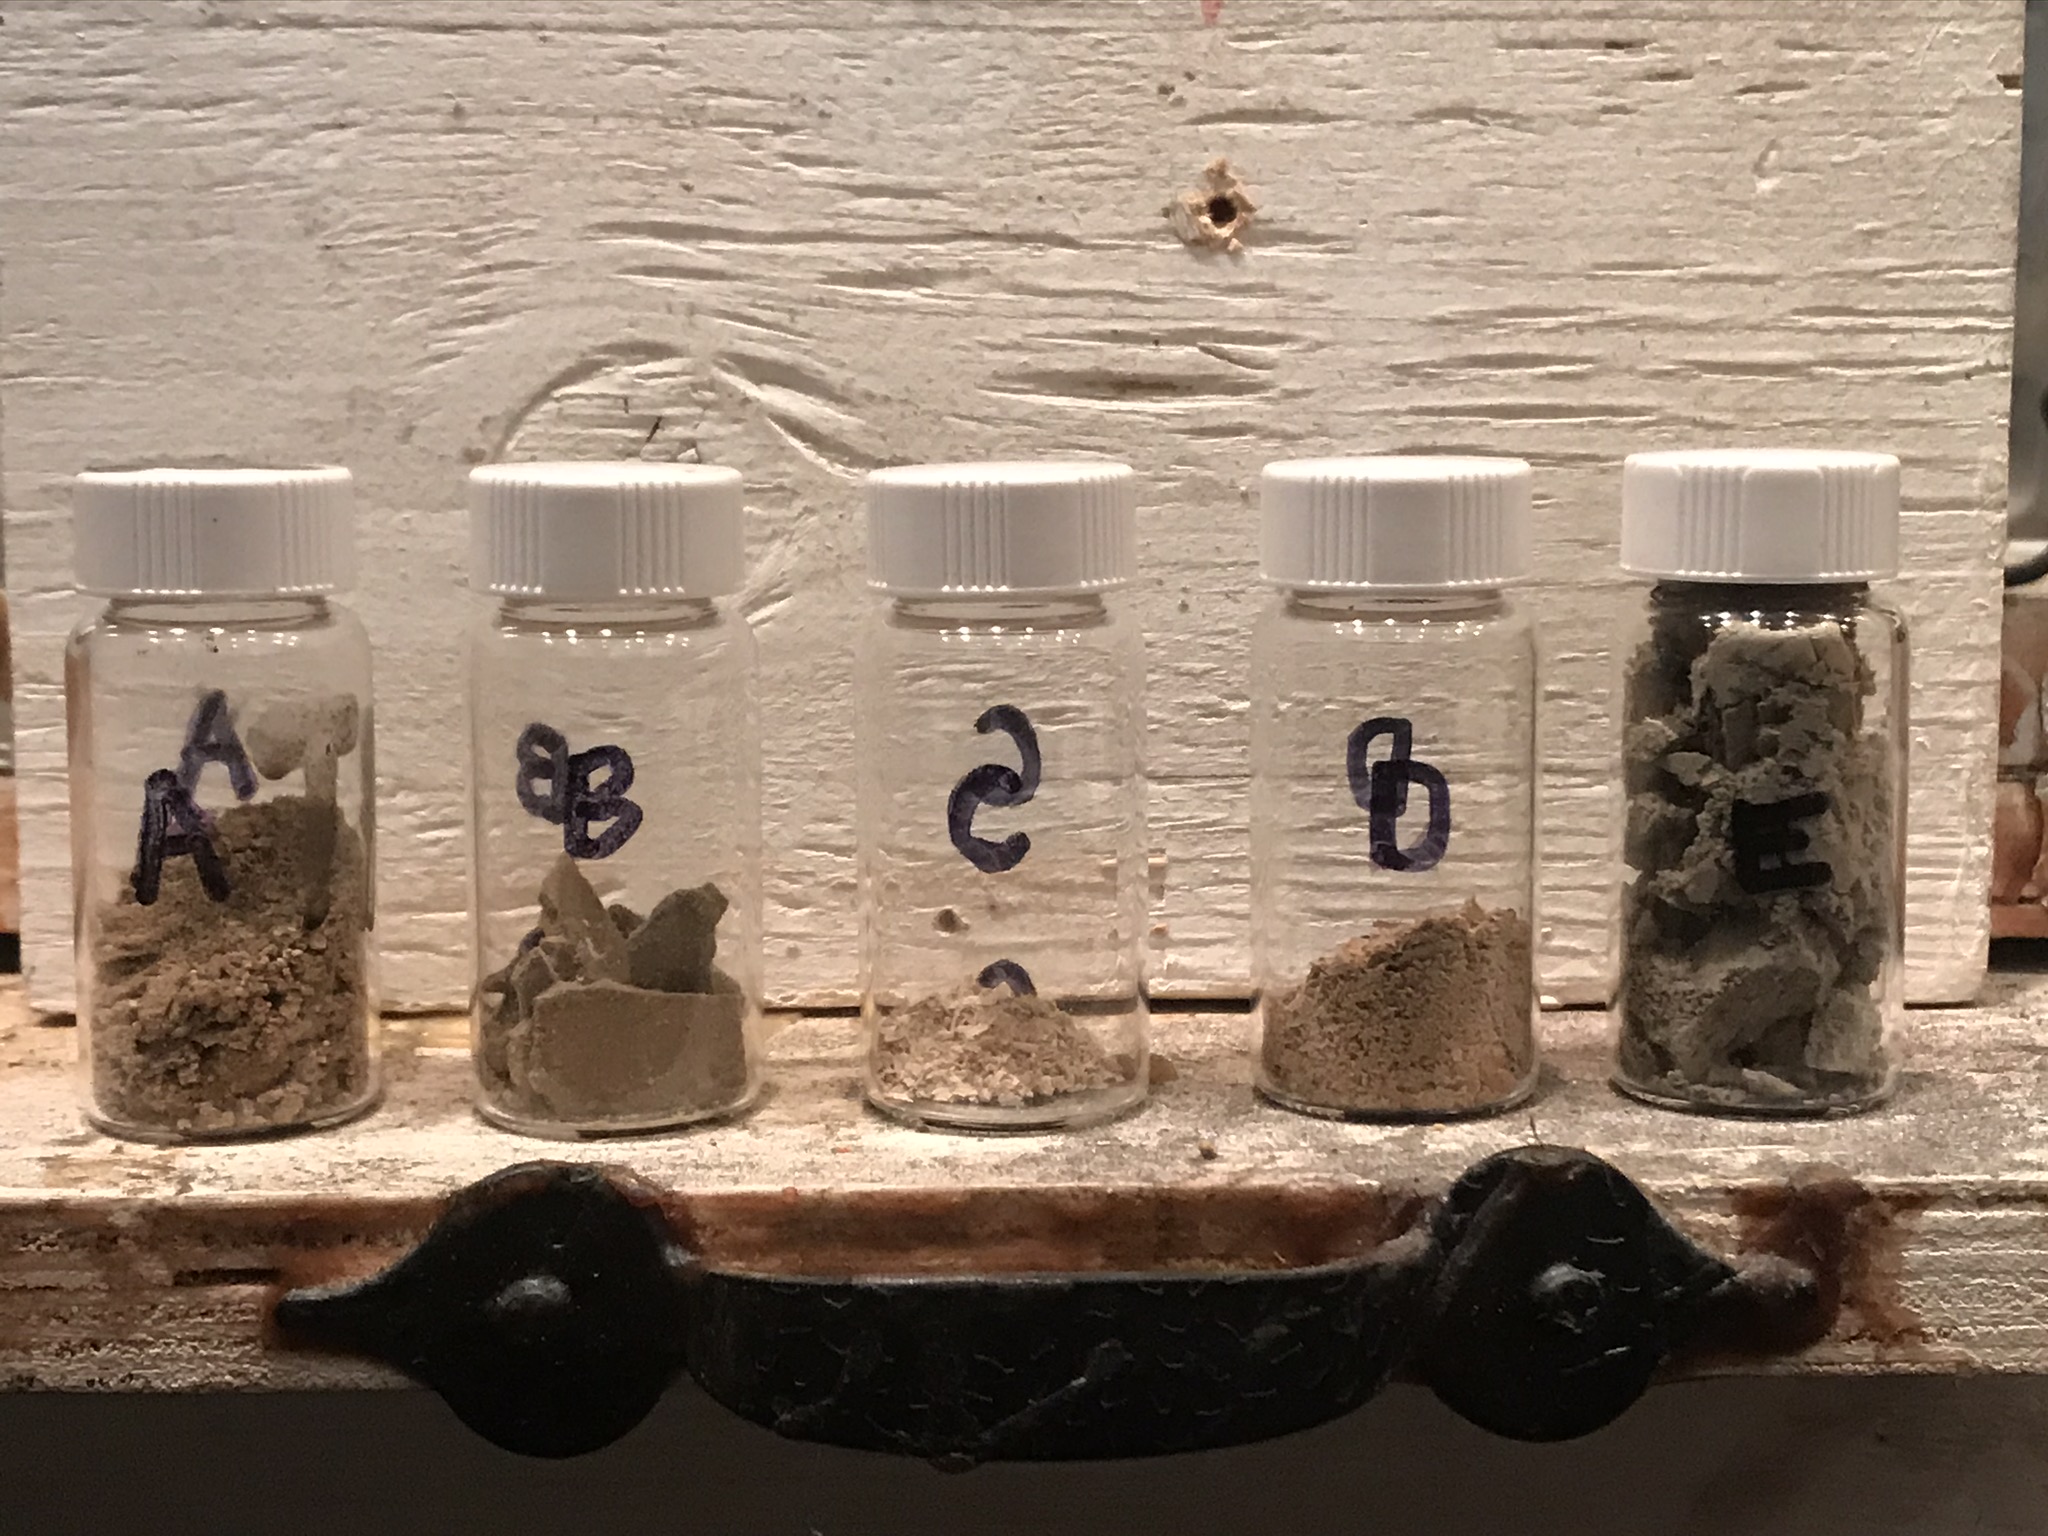 NZ15G Sample Bottles
Click on Image to open high resolution version in a new tab
Photo by JW
 Billet of NZ415G
Click on Image to open high resolution version in a new tab
Photo by JW
Thin Section Slide of NZ415GClick on Image to open high resolution version in a new tab
Photo by JW
 Thin Section Slide of NZ415G
Click on Image to open high resolution version in a new tab
Photo by JW
 Thin Section Slide of NZ415G
Click on Image to open high resolution version in a new tab
Photo by JW
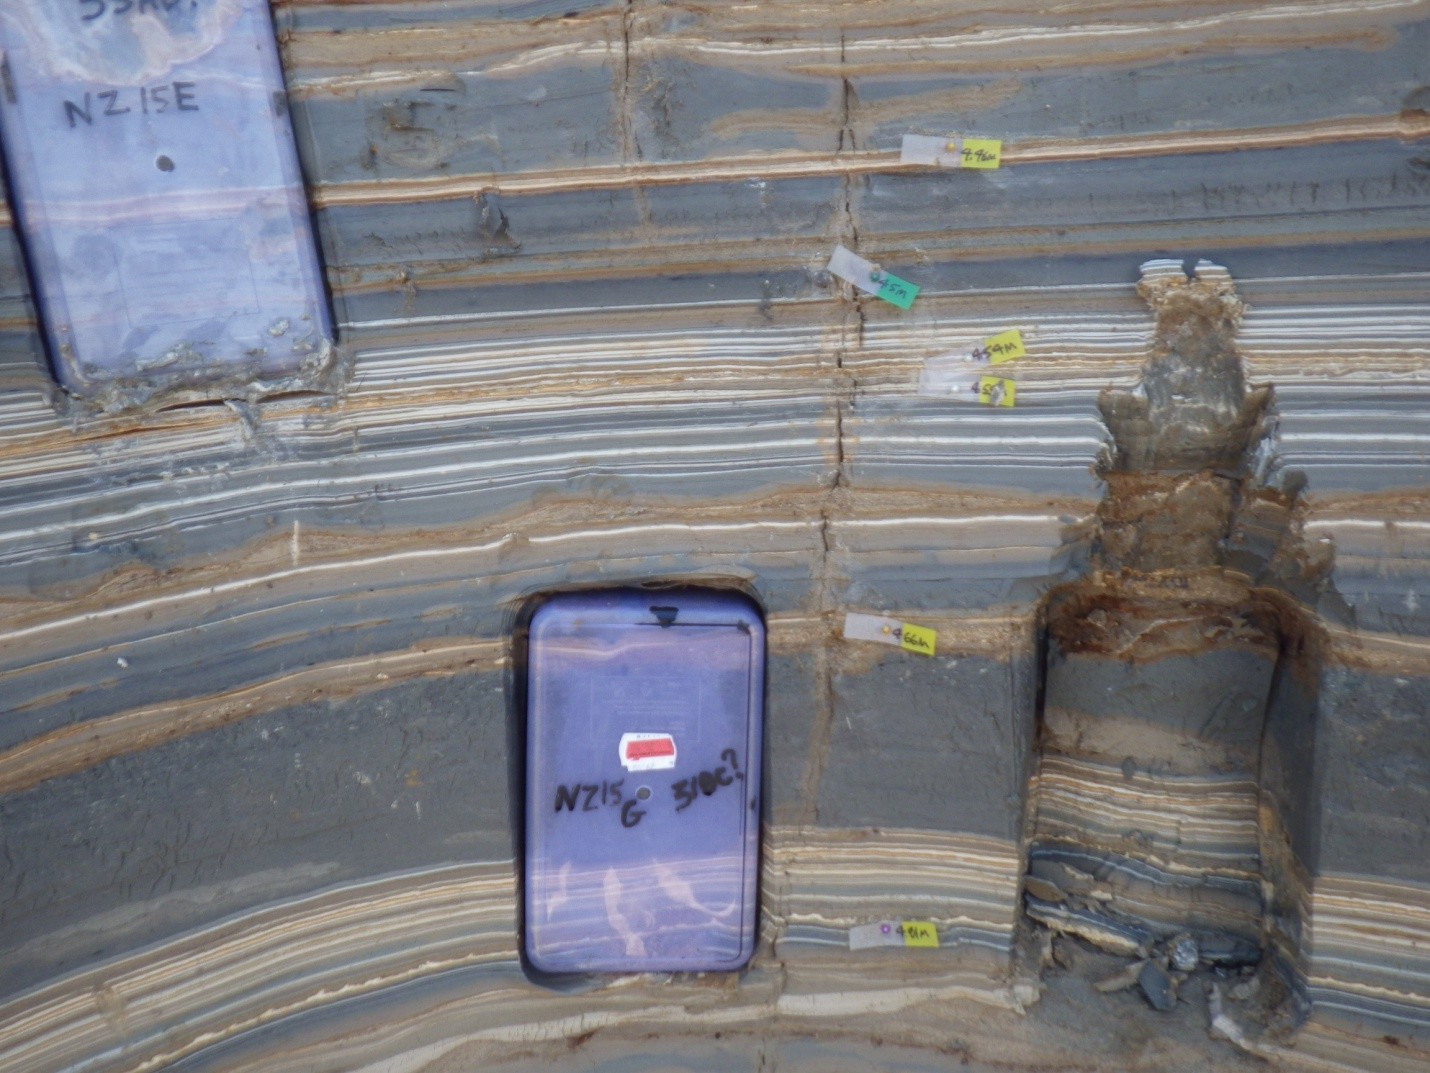 NZ15G in the Field
Click on Image to open high resolution version in a new tab
Photo by JW
NZ15G and others in the FieldClick on Image to open high resolution version in a new tab
Photo by JW
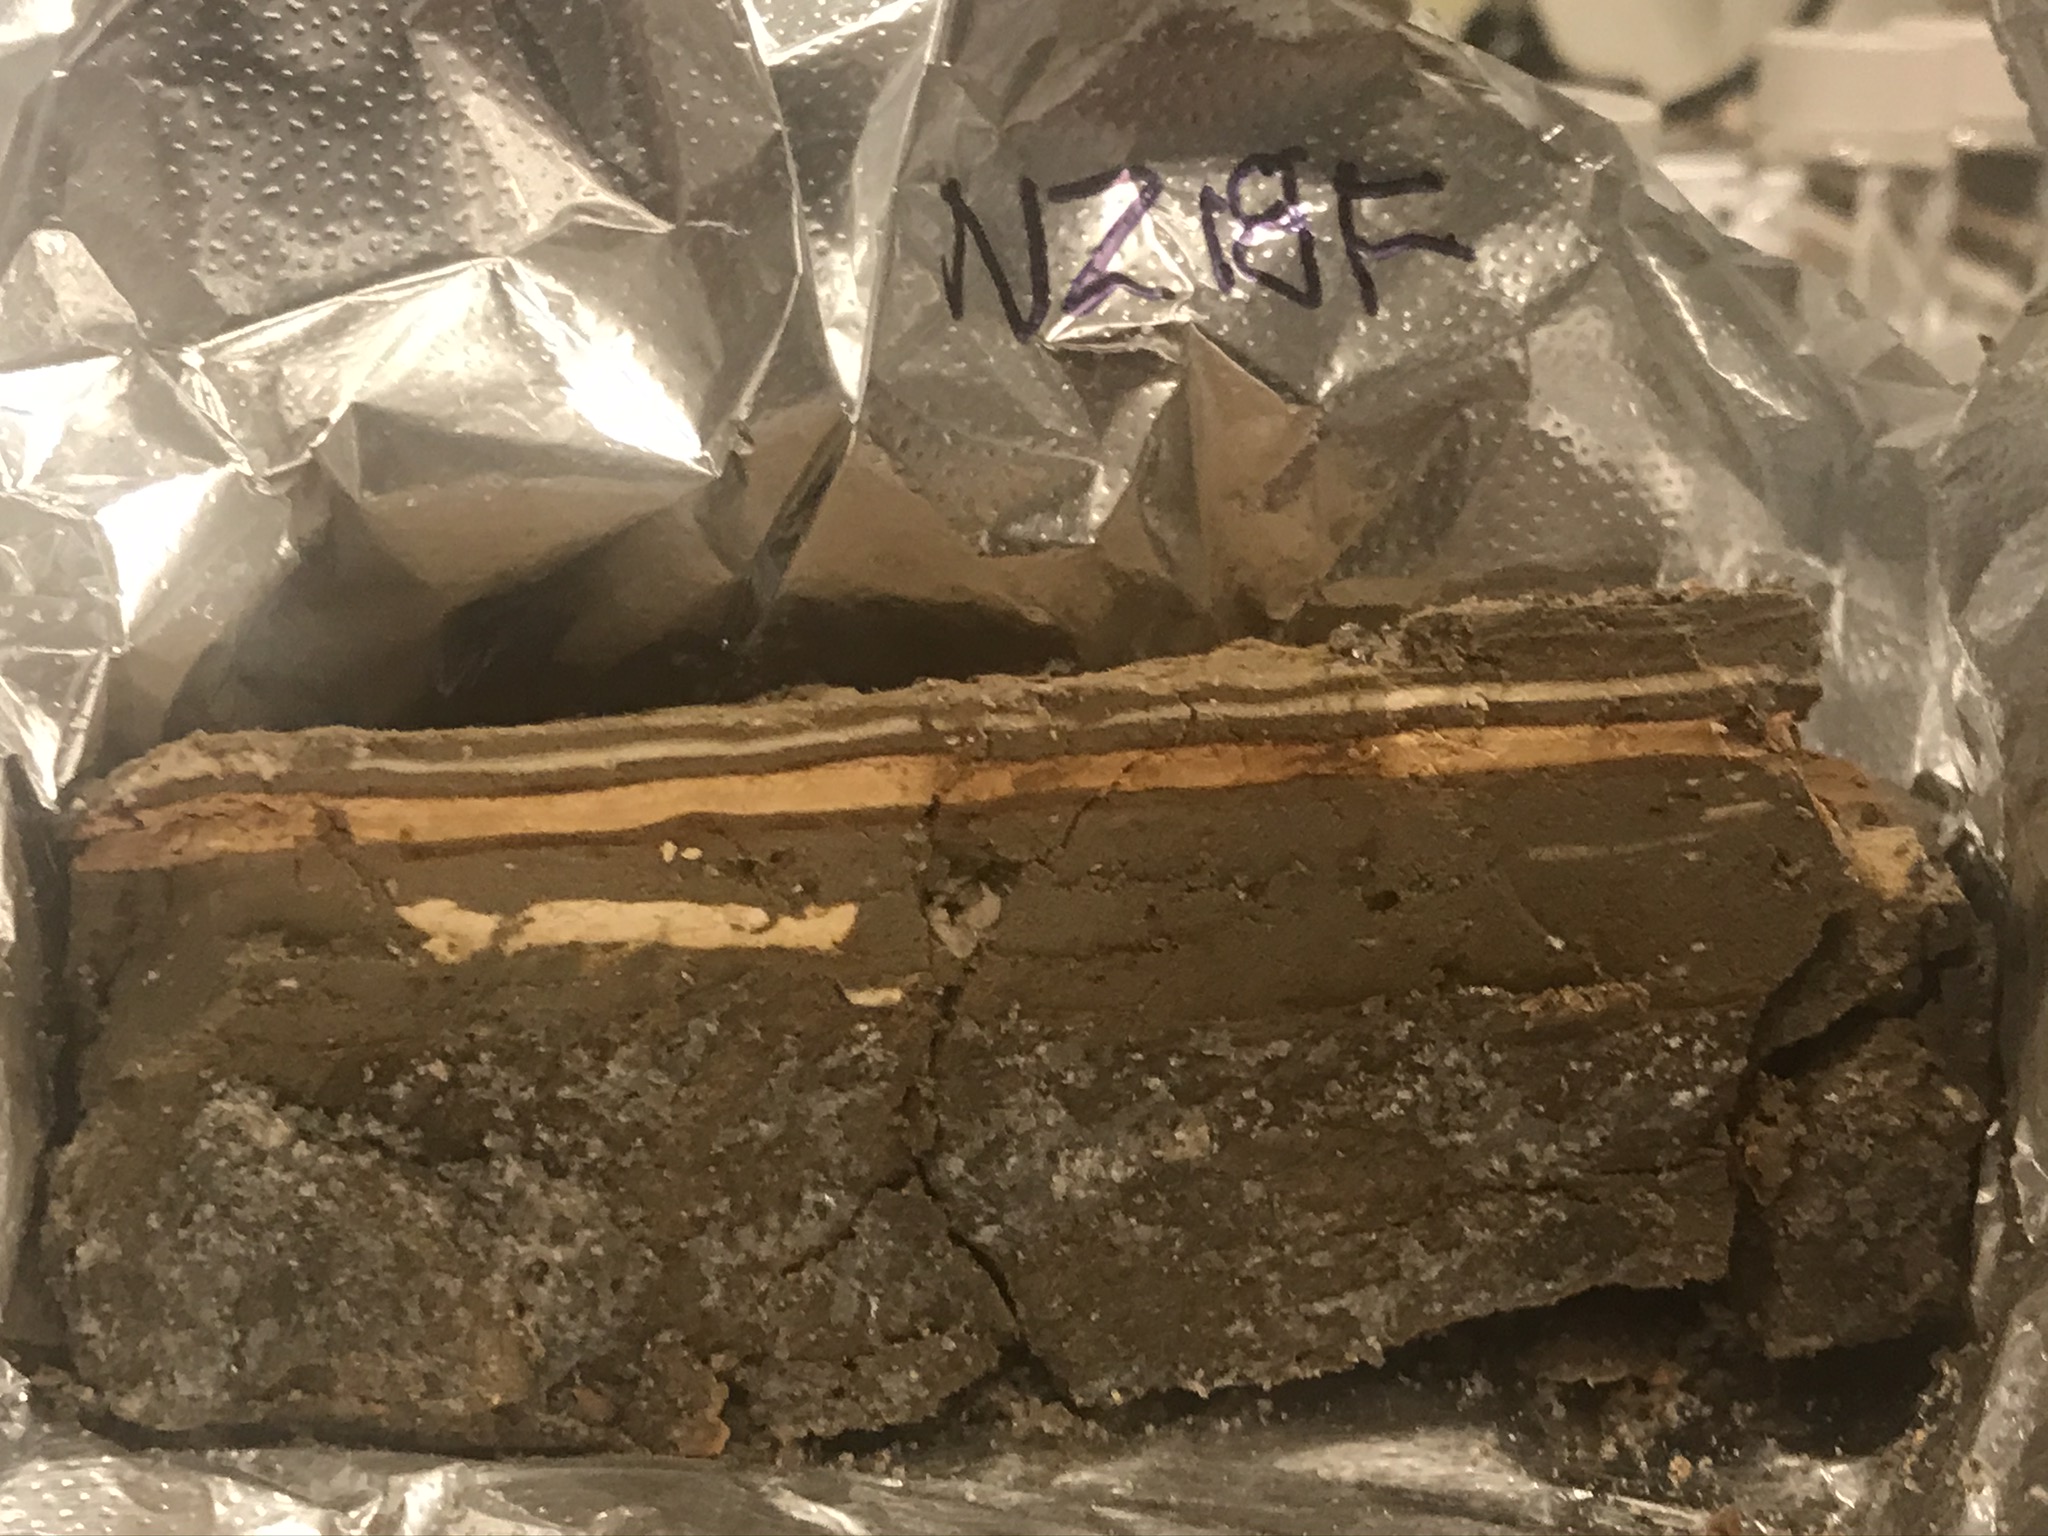 NZ18F in the Lab
Click on Image to open high resolution version in a new tab
Photo by JW
 NZ18F in the Lab
Click on Image to open high resolution version in a new tab
Photo by JW
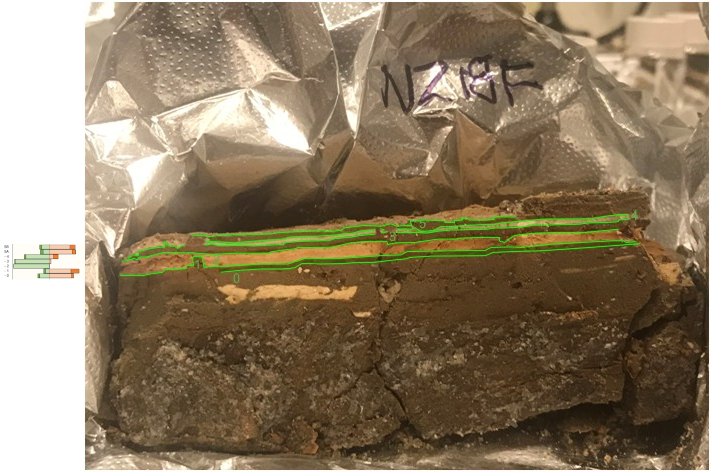 NZ18F in the Lab Annotated with POllen - Green is Spring
Click on Image to open high resolution version in a new tab
Photo by JW
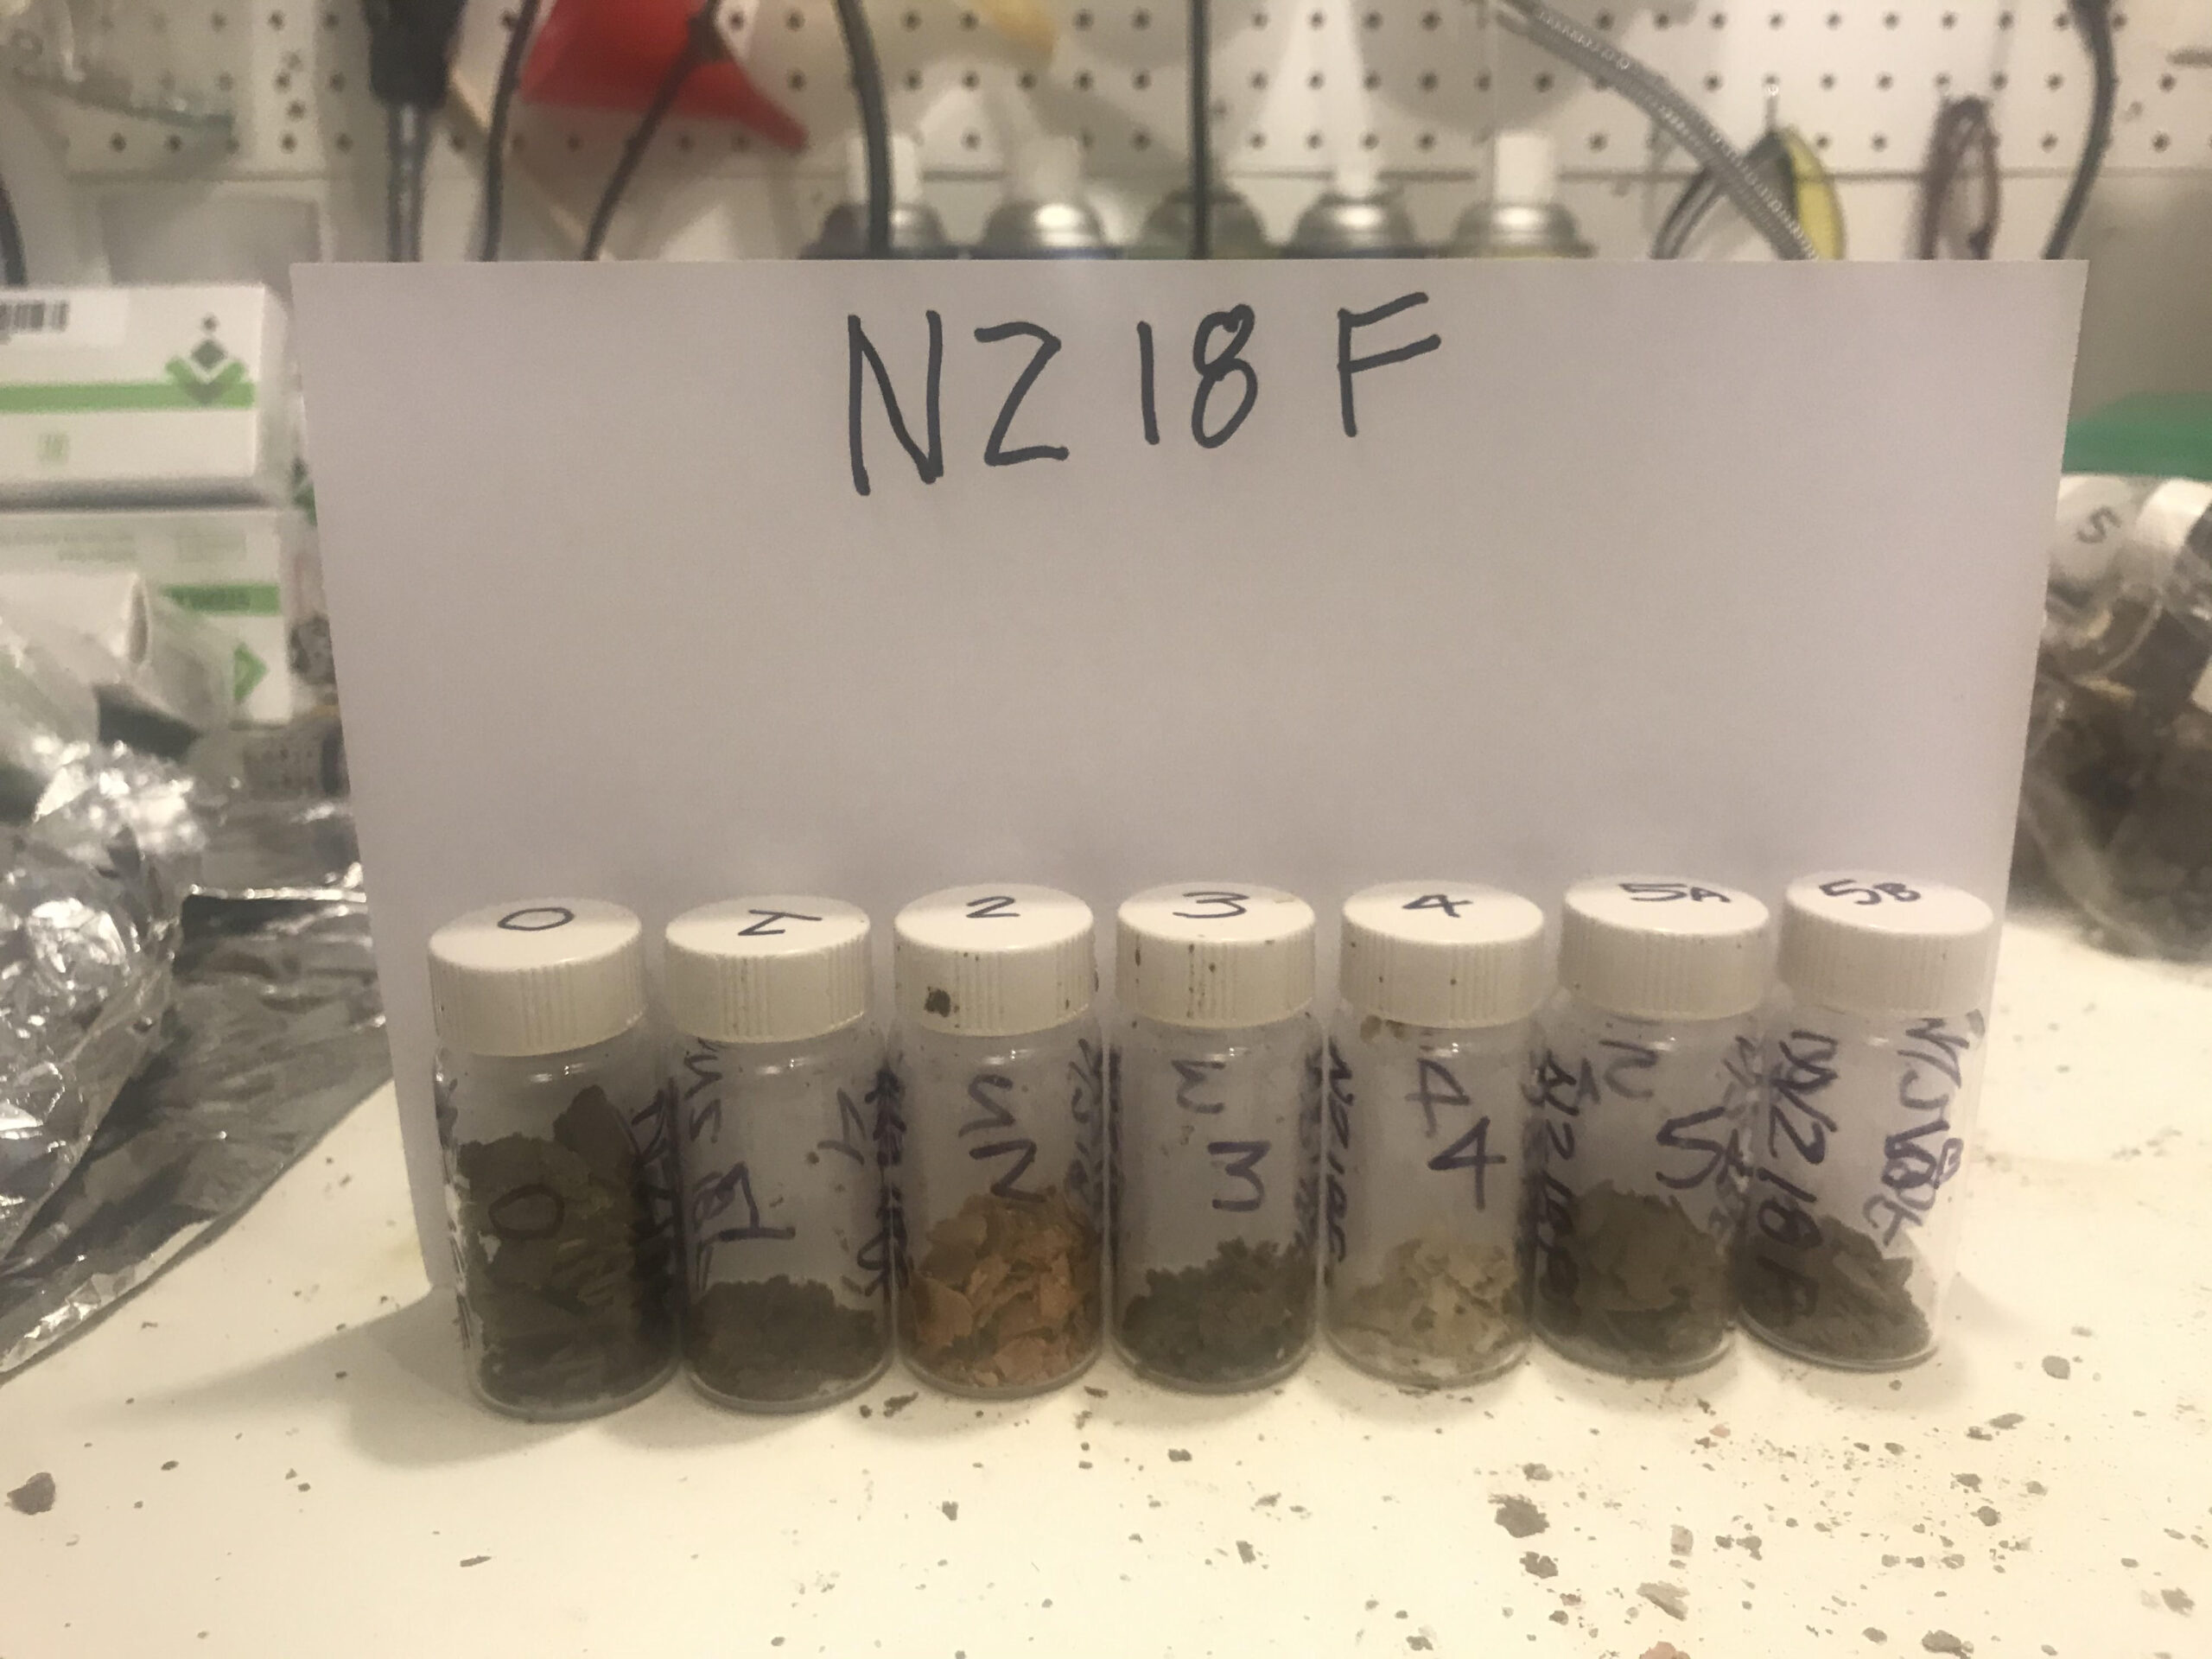 NZ18F Sample Bottles
Click on Image to open high resolution version in a new tab
Photo by JW
Thin Section Slide of NZ418FClick on Image to open high resolution version in a new tab
Photo by JW
 Thin Section Slide of NZ418F
Click on Image to open high resolution version in a new tab
Photo by JW
 Thin Section Slide of NZ418F
Click on Image to open high resolution version in a new tab
Photo by JW
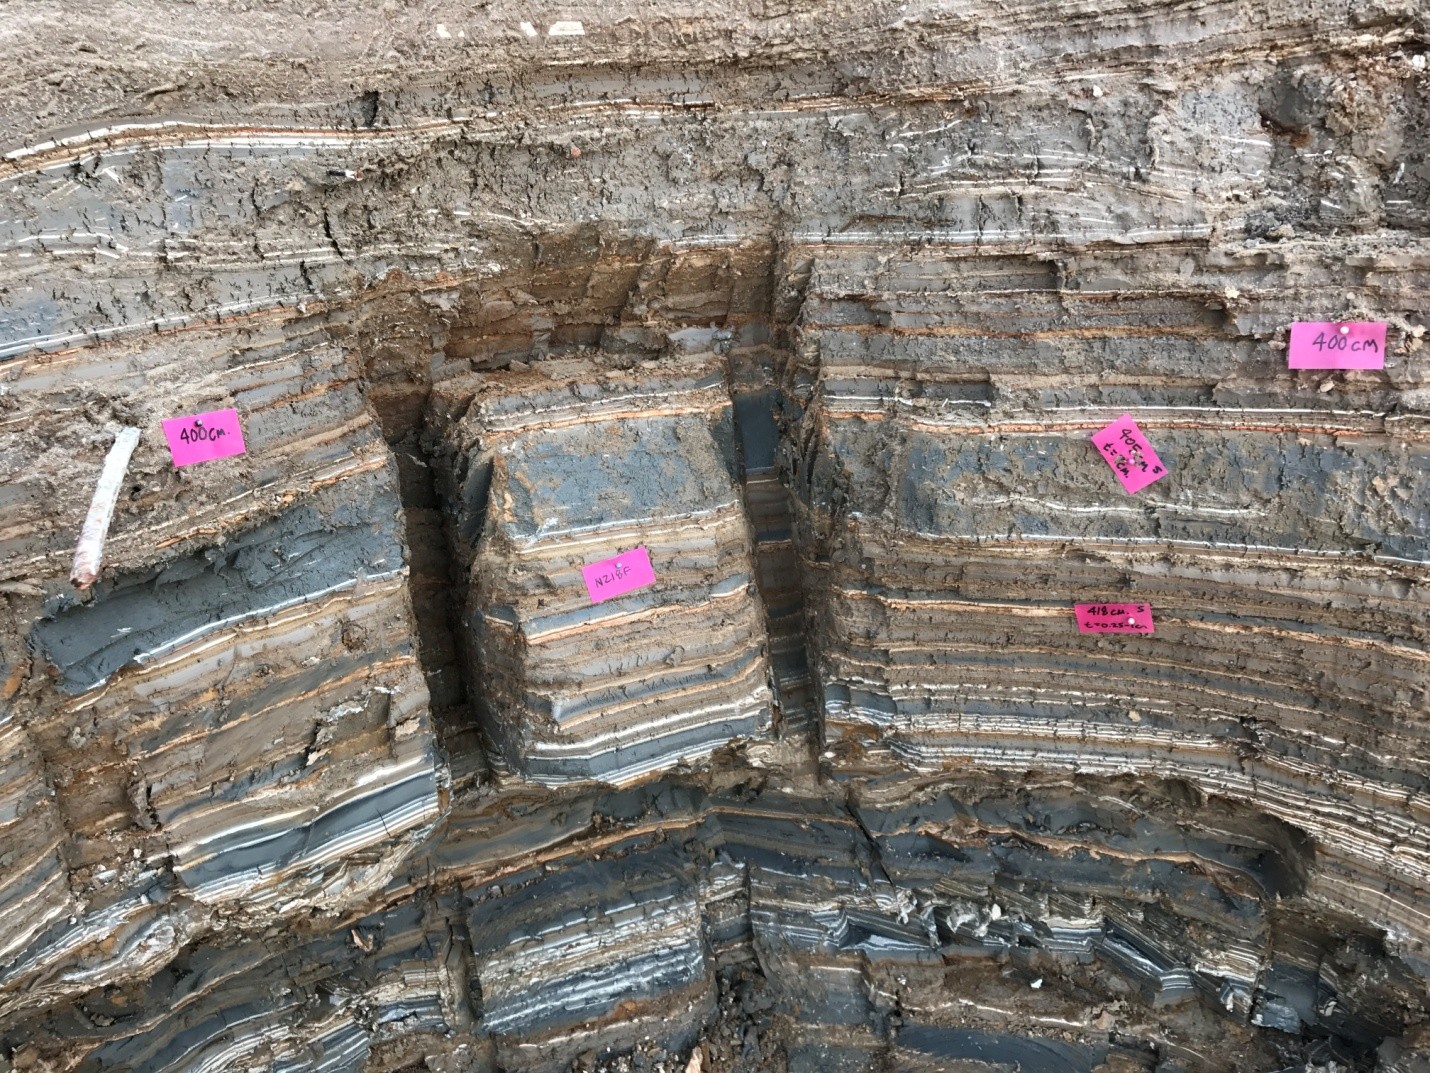 NZ18F in the Field
Click on Image to open high resolution version in a new tab
Photo by JW
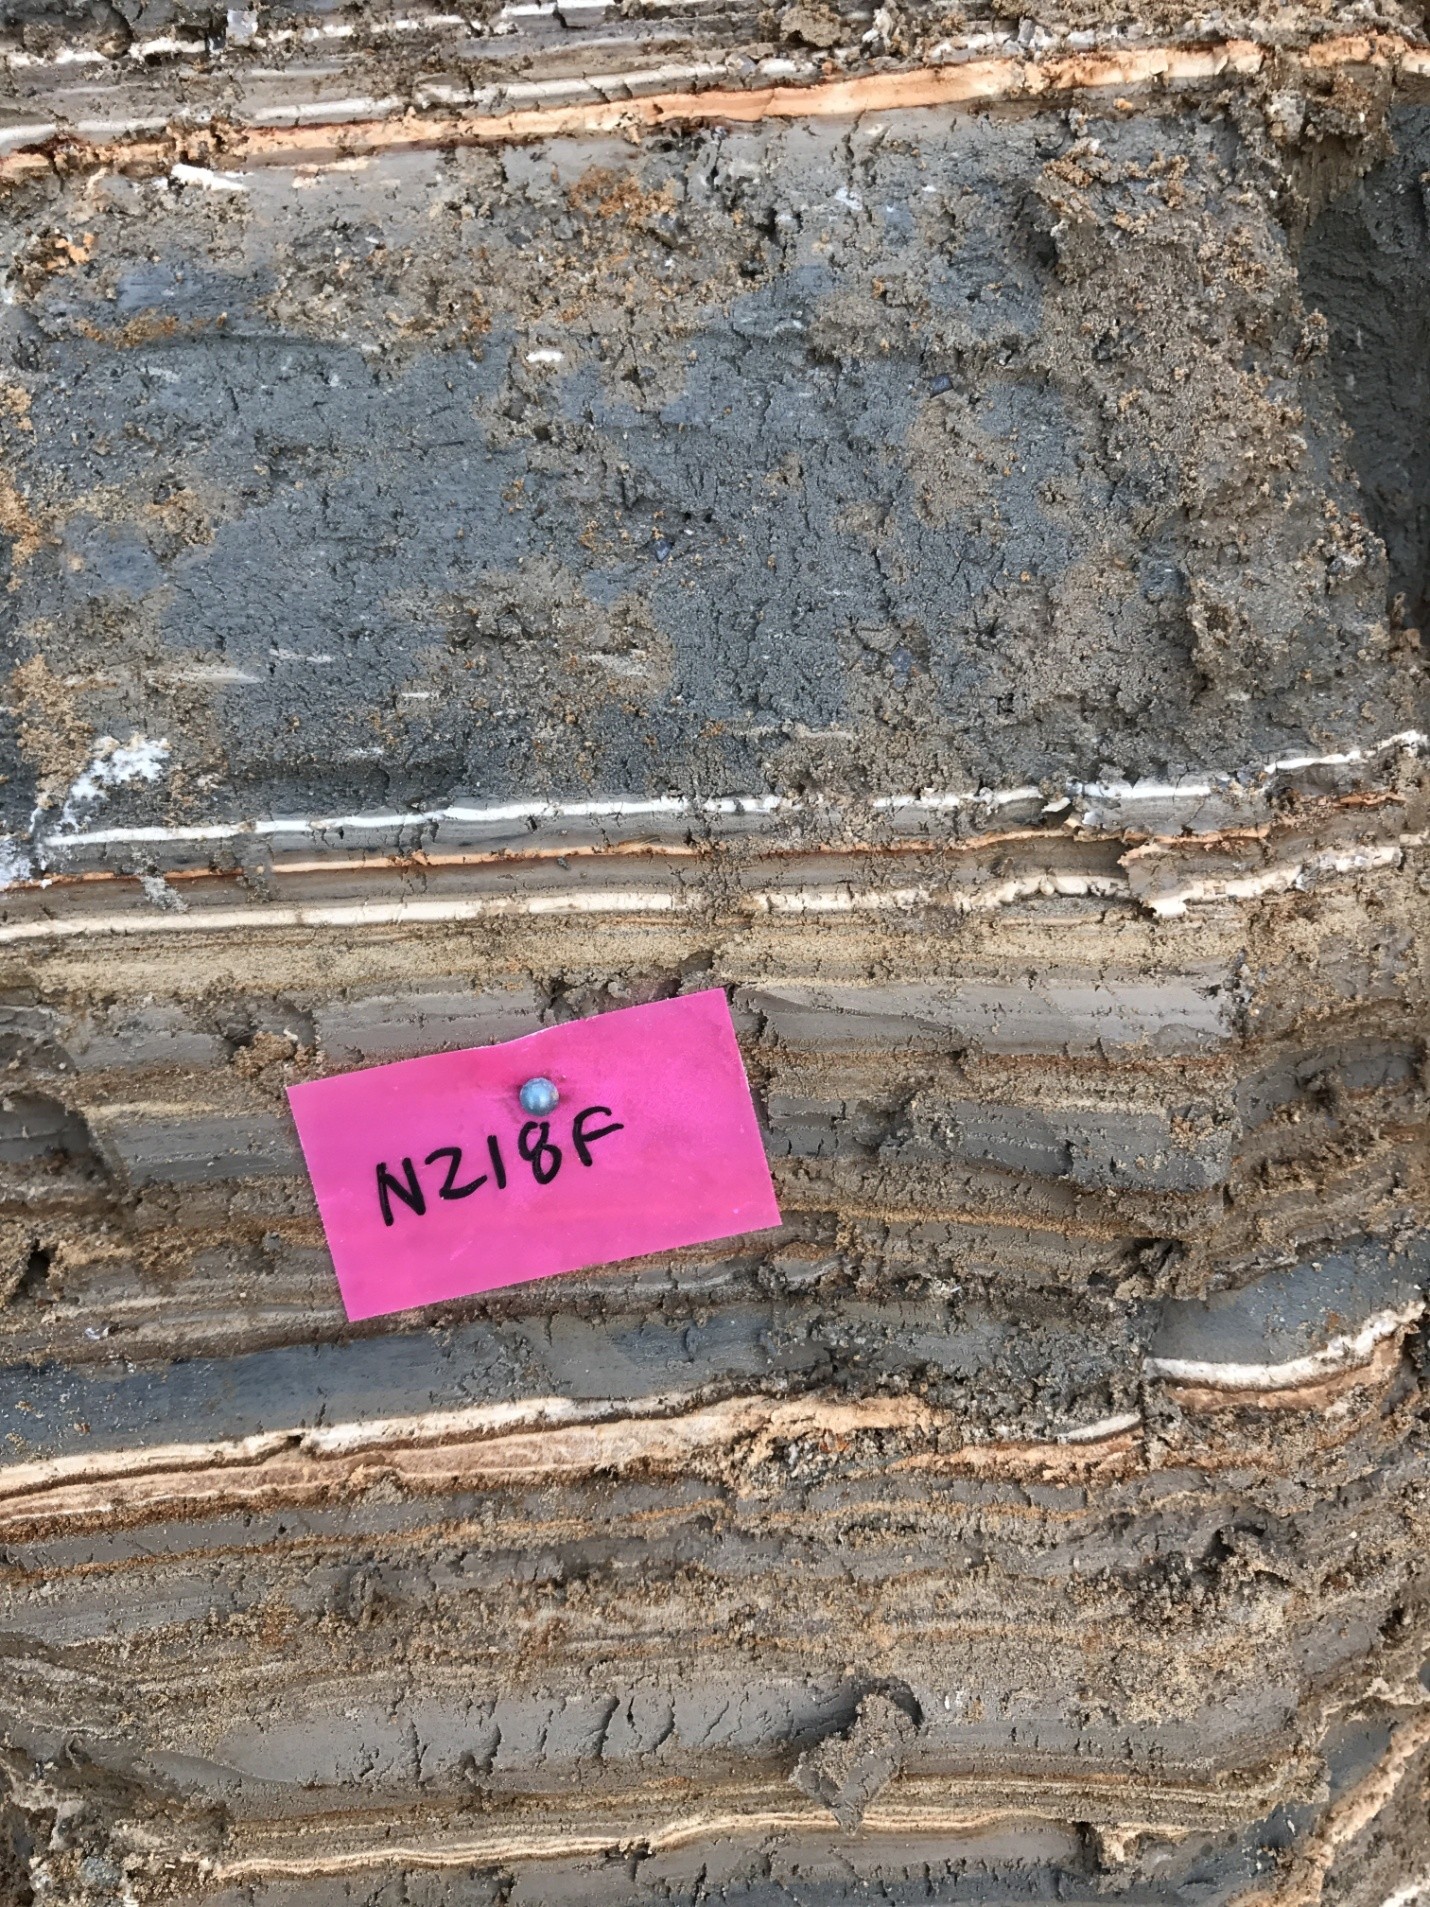 NZ18F in the Field
Click on Image to open high resolution version in a new tab
Photo by JW
| Sample | In Situ Photo |
Sample Photo |
Sample Description |
Depth (cm) |
Age (yrs BP) |
Uncertainty (± yrs BP) |
|---|---|---|---|---|---|---|
| RCNZ18109 |
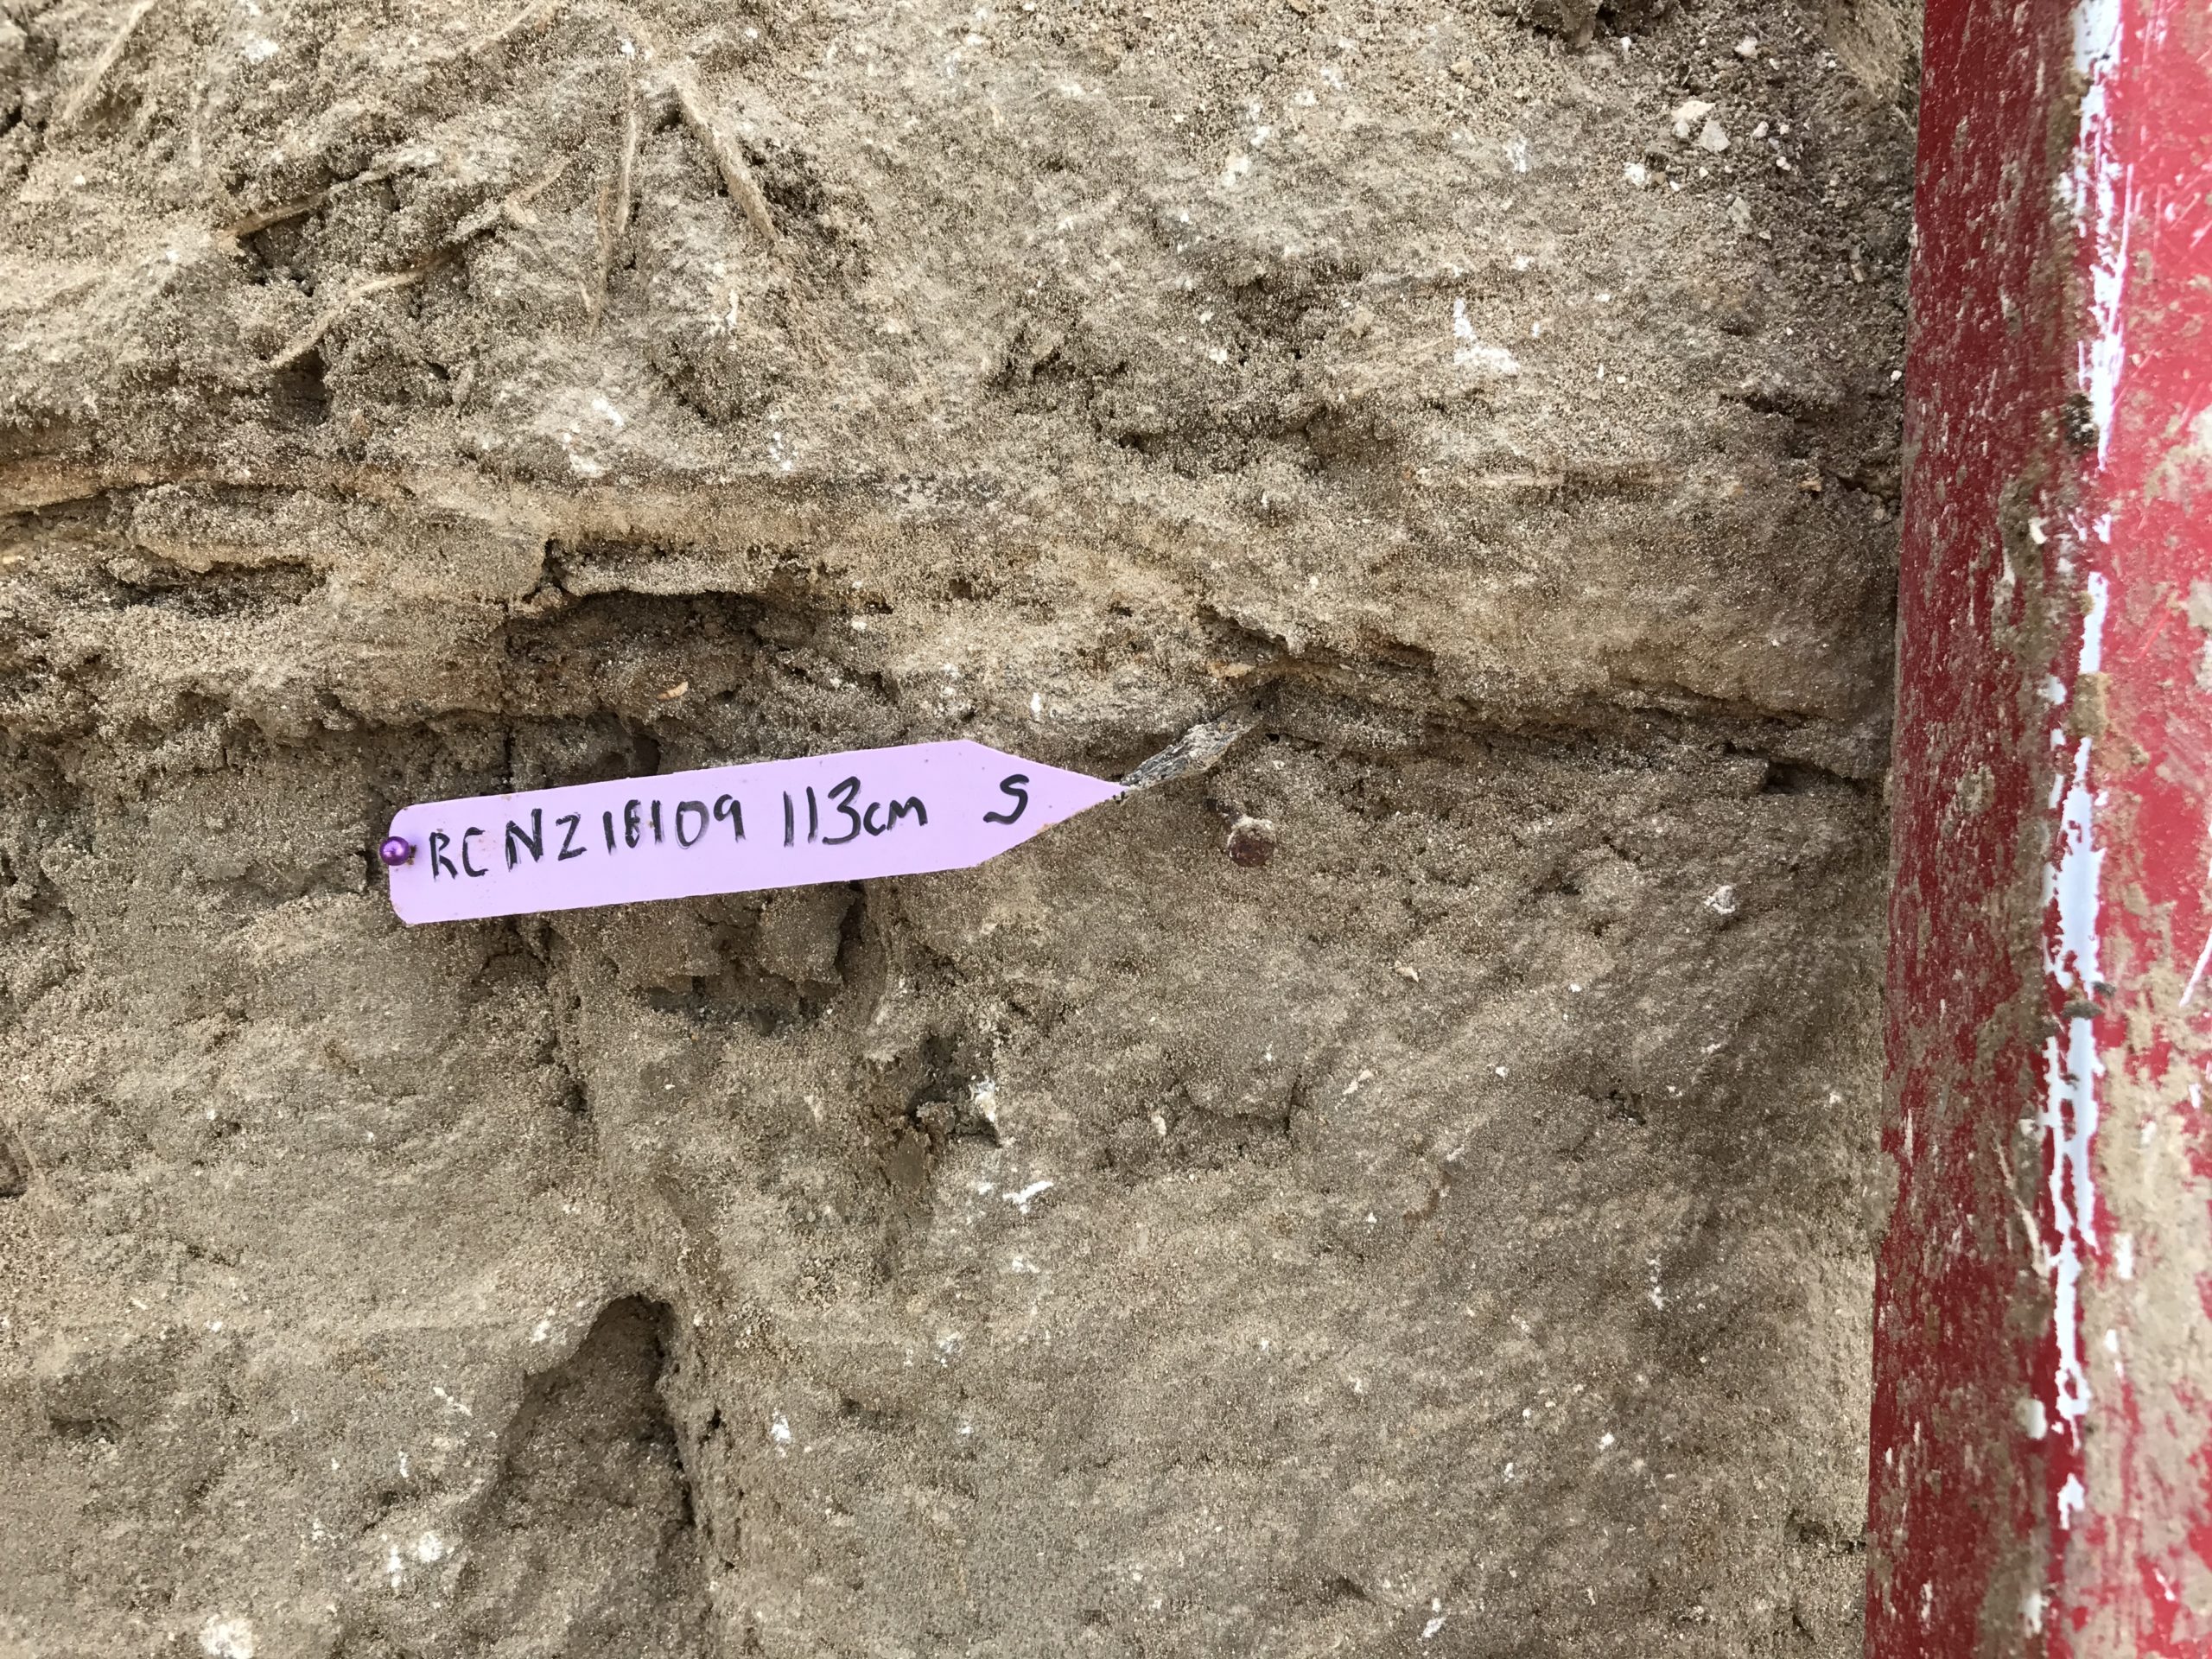 Radiocarbon Sample RCNZ18109 in situ
Click on photo to open magnifiable image in a new tab Photo by Jefferson Williams 2018 |
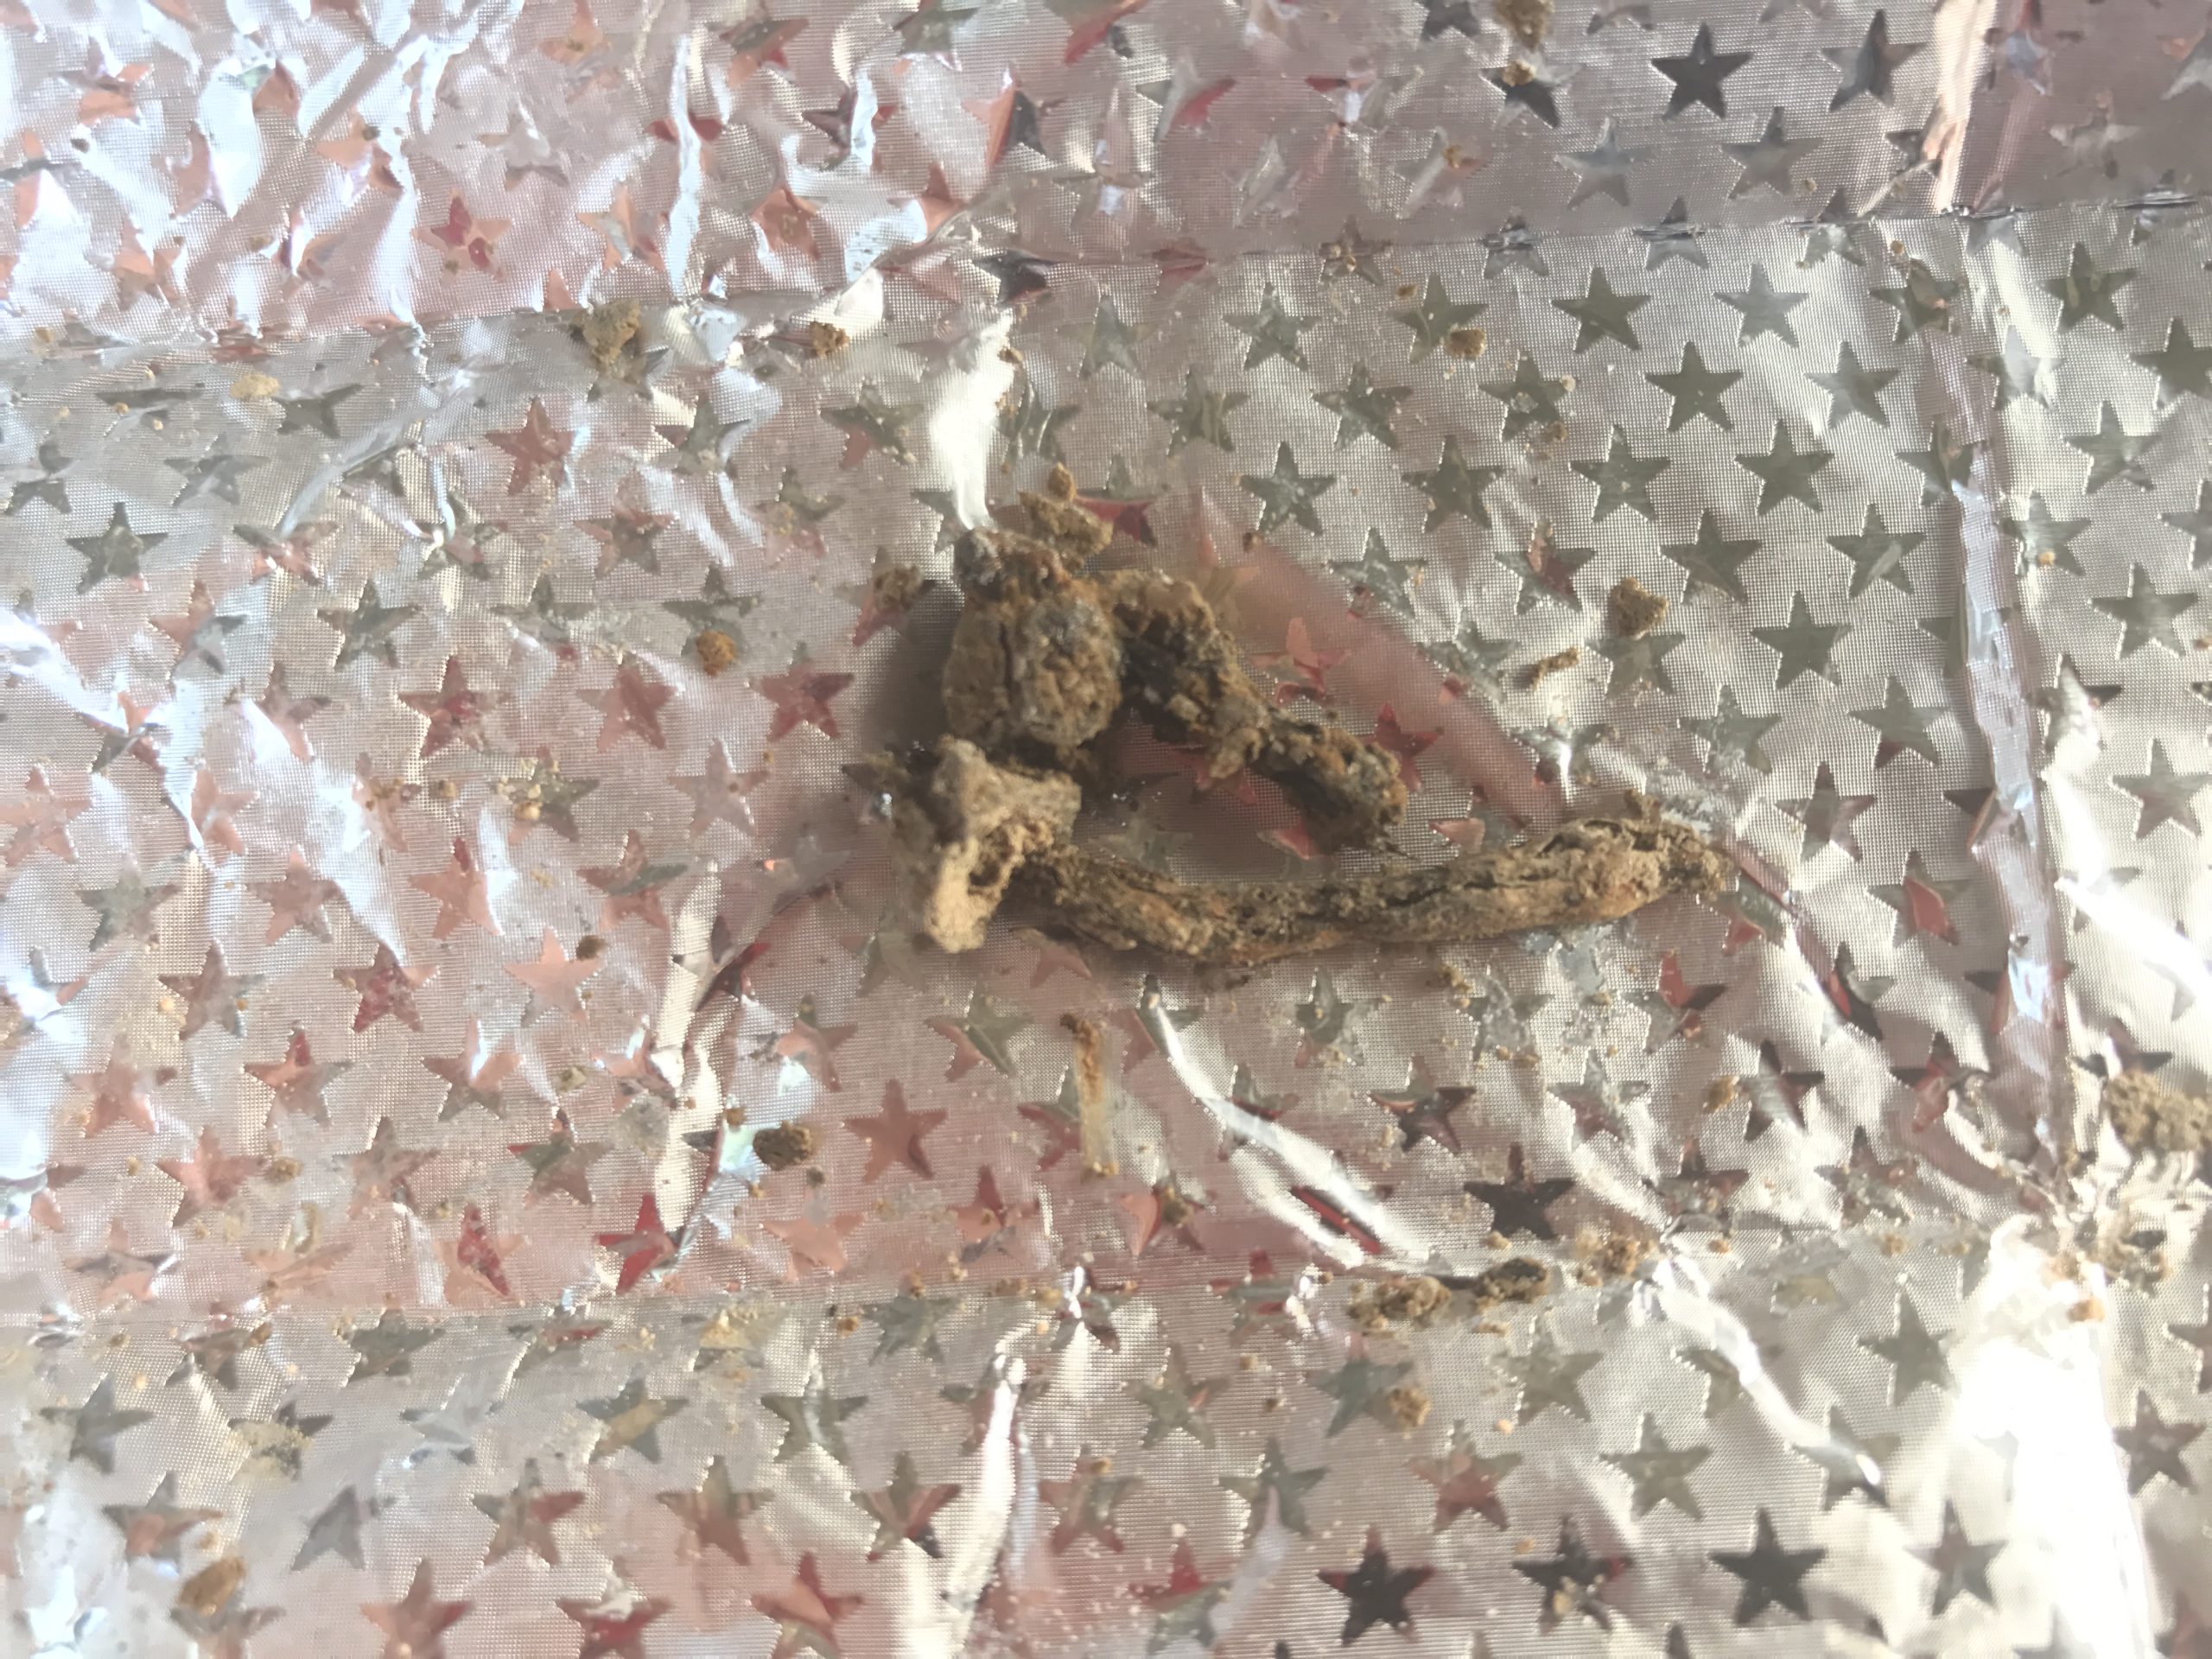
 Radiocarbon Sample RCNZ18109 before being sent to the lab
Click on photo to open magnifiable image in a new tab Photo by Jefferson Williams |
JW: Big Twig, Old, Lab: Wood - in seismite | 113 | 1419 | 24 |
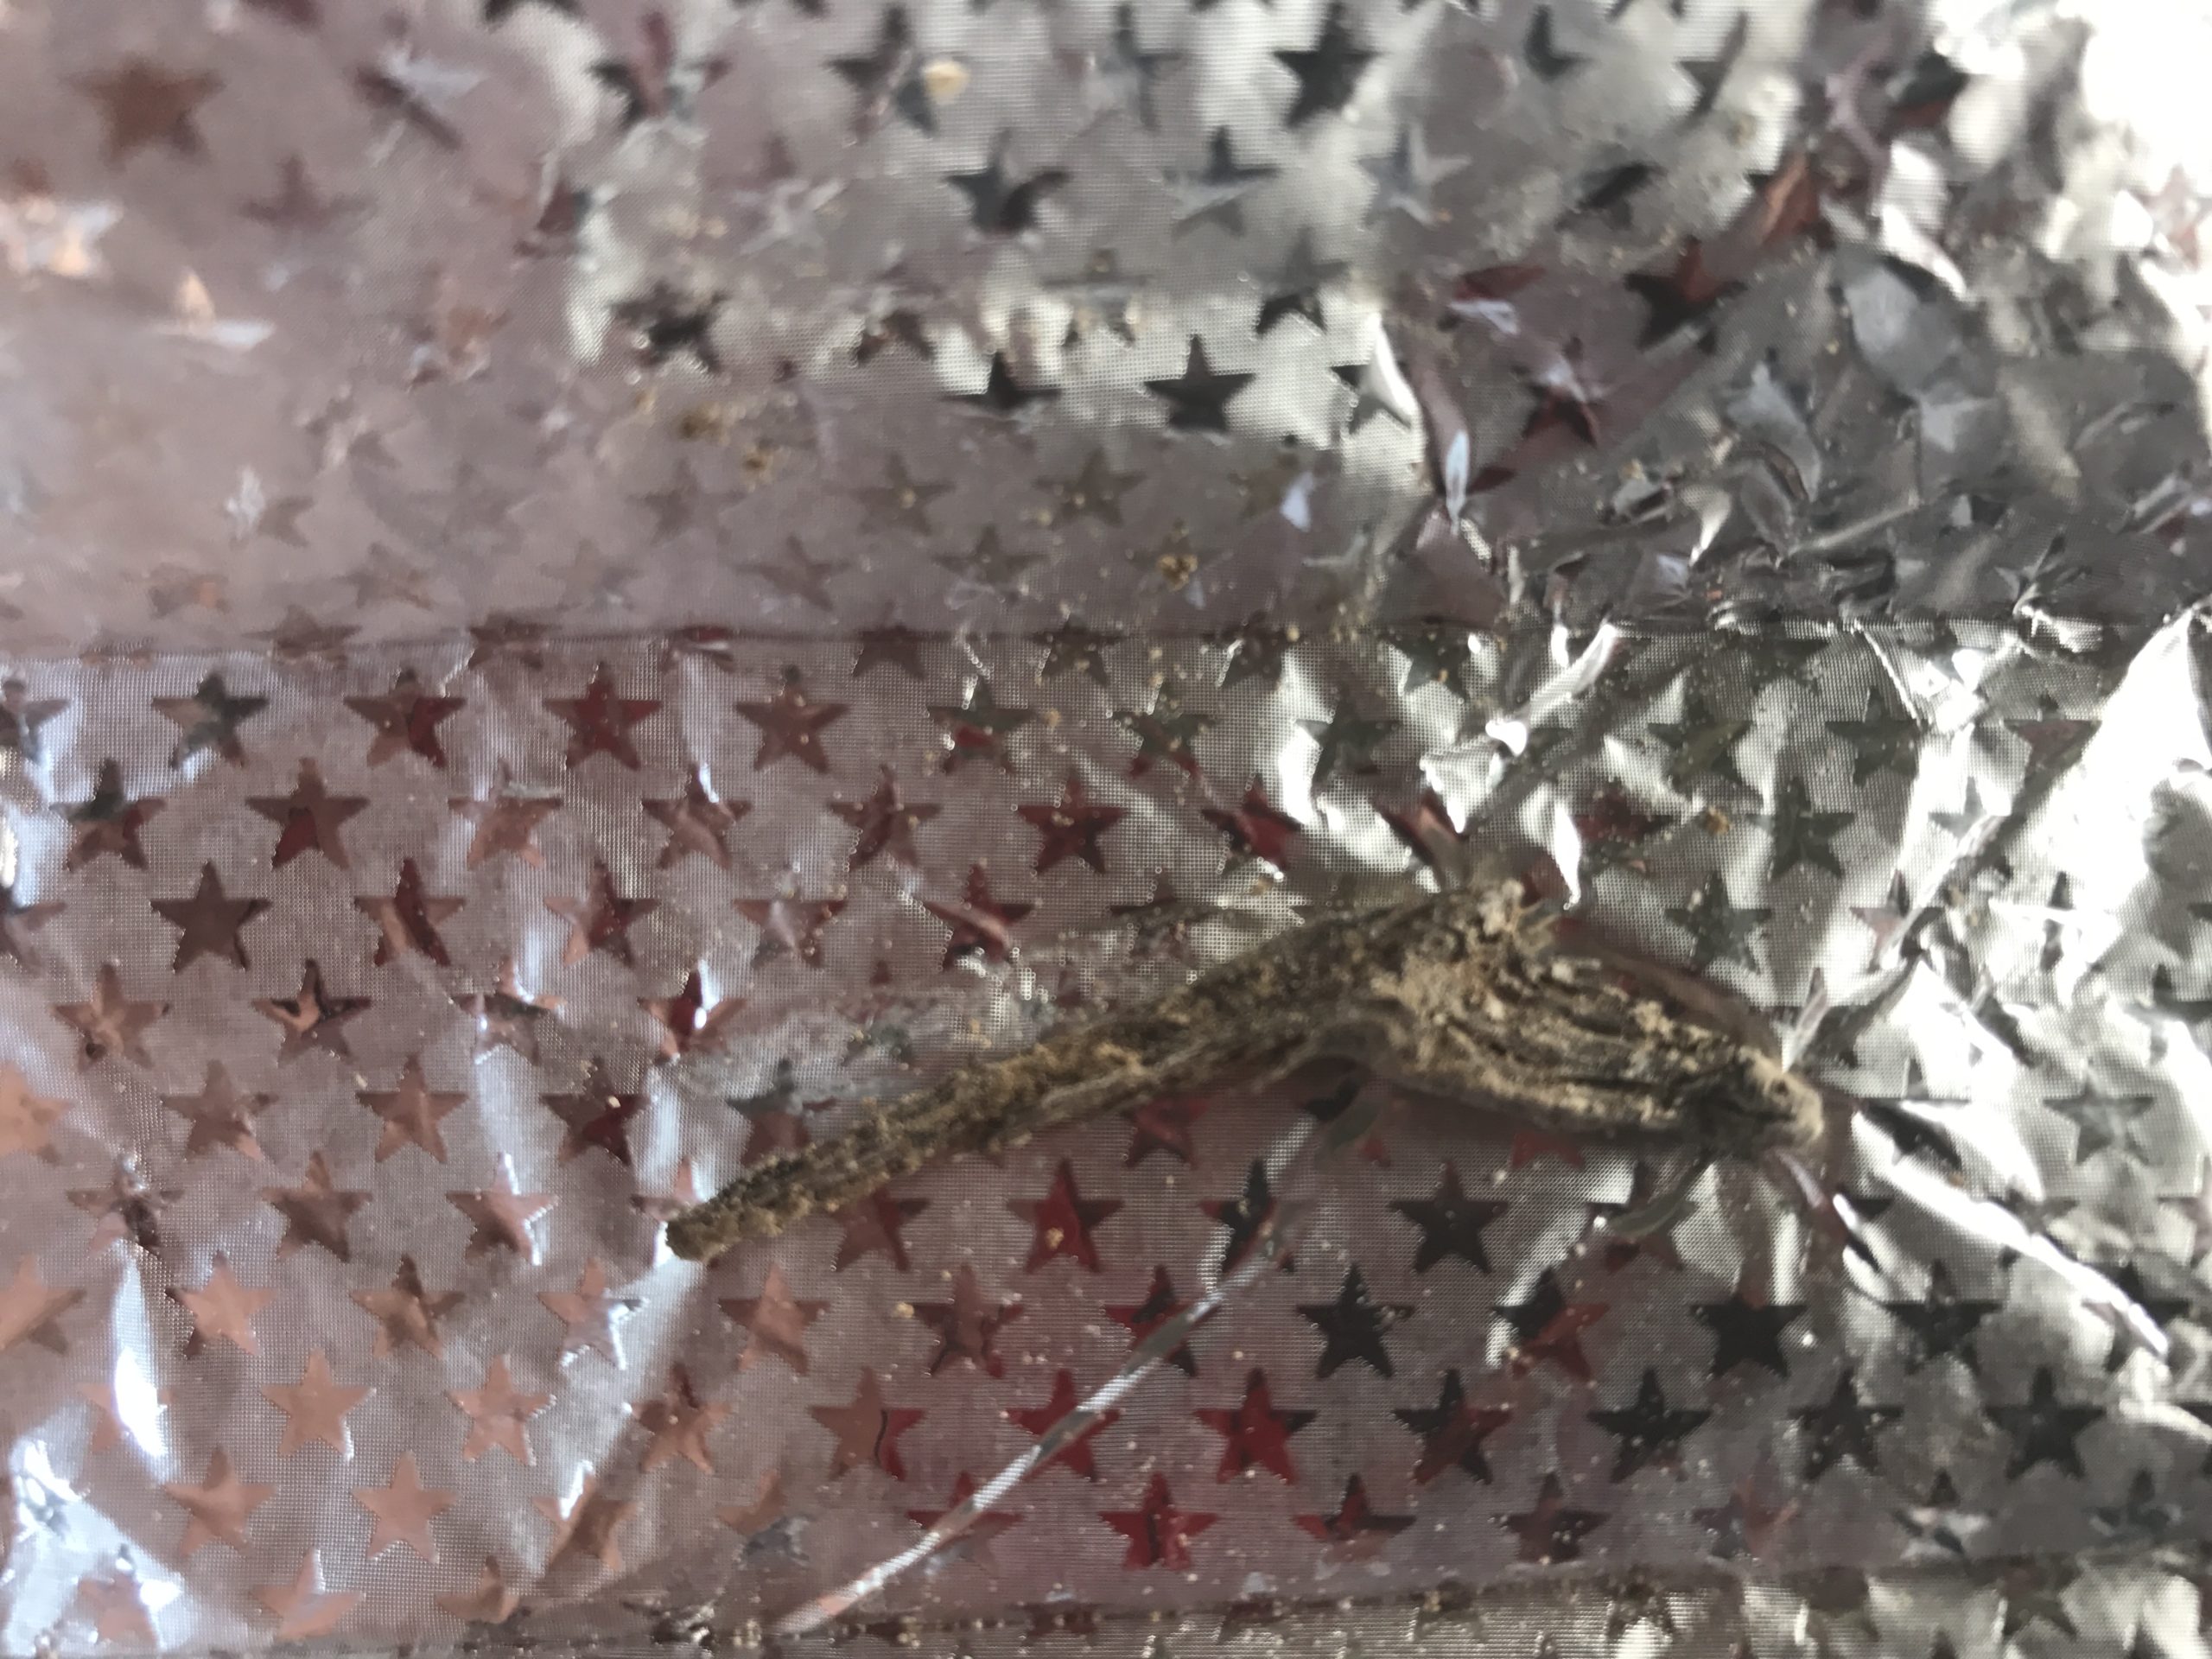
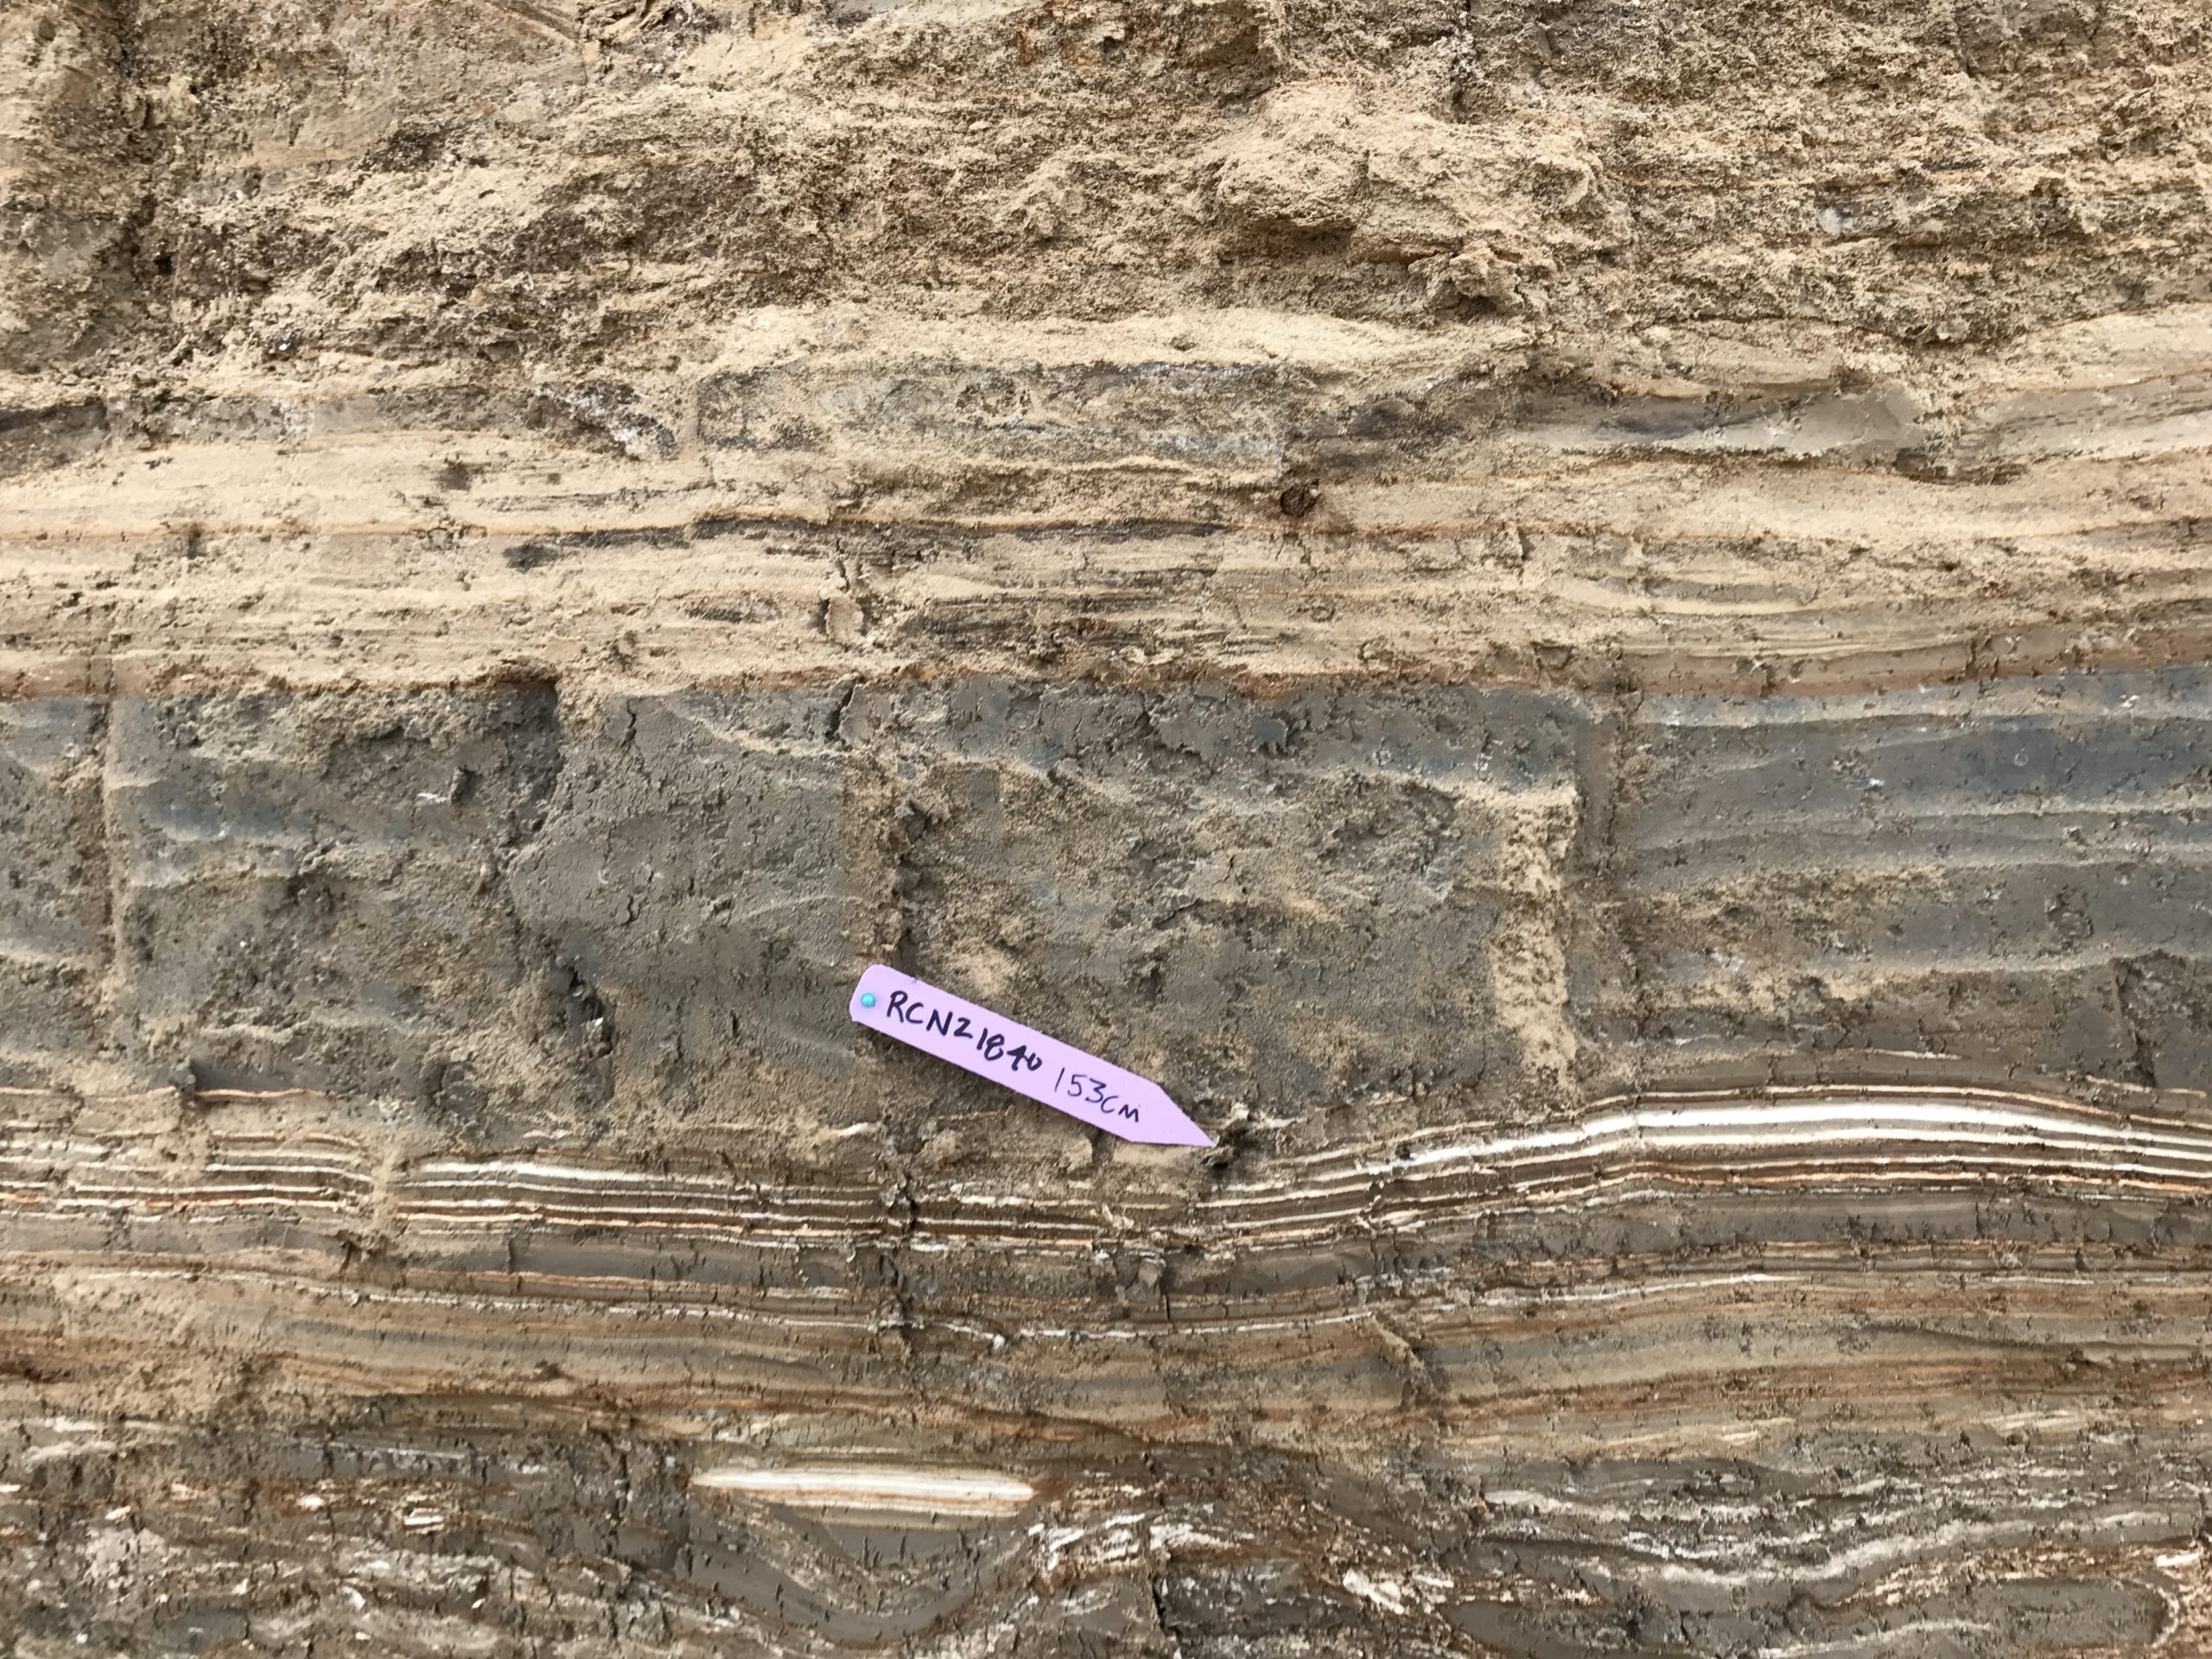
| RCNZ18040 |
 Radiocarbon Sample RCNZ1840 in situ
Click on photo to open magnifiable image in a new tab Photo by Jefferson Williams 2018 |
 Radiocarbon Sample RCNZ1840 before being sent to the lab
Click on photo to open magnifiable image in a new tab Photo by Jefferson Williams |
JW: Big twigs looks old, Lab: Wood - not in seismite | 153 | 1361 | 23 |
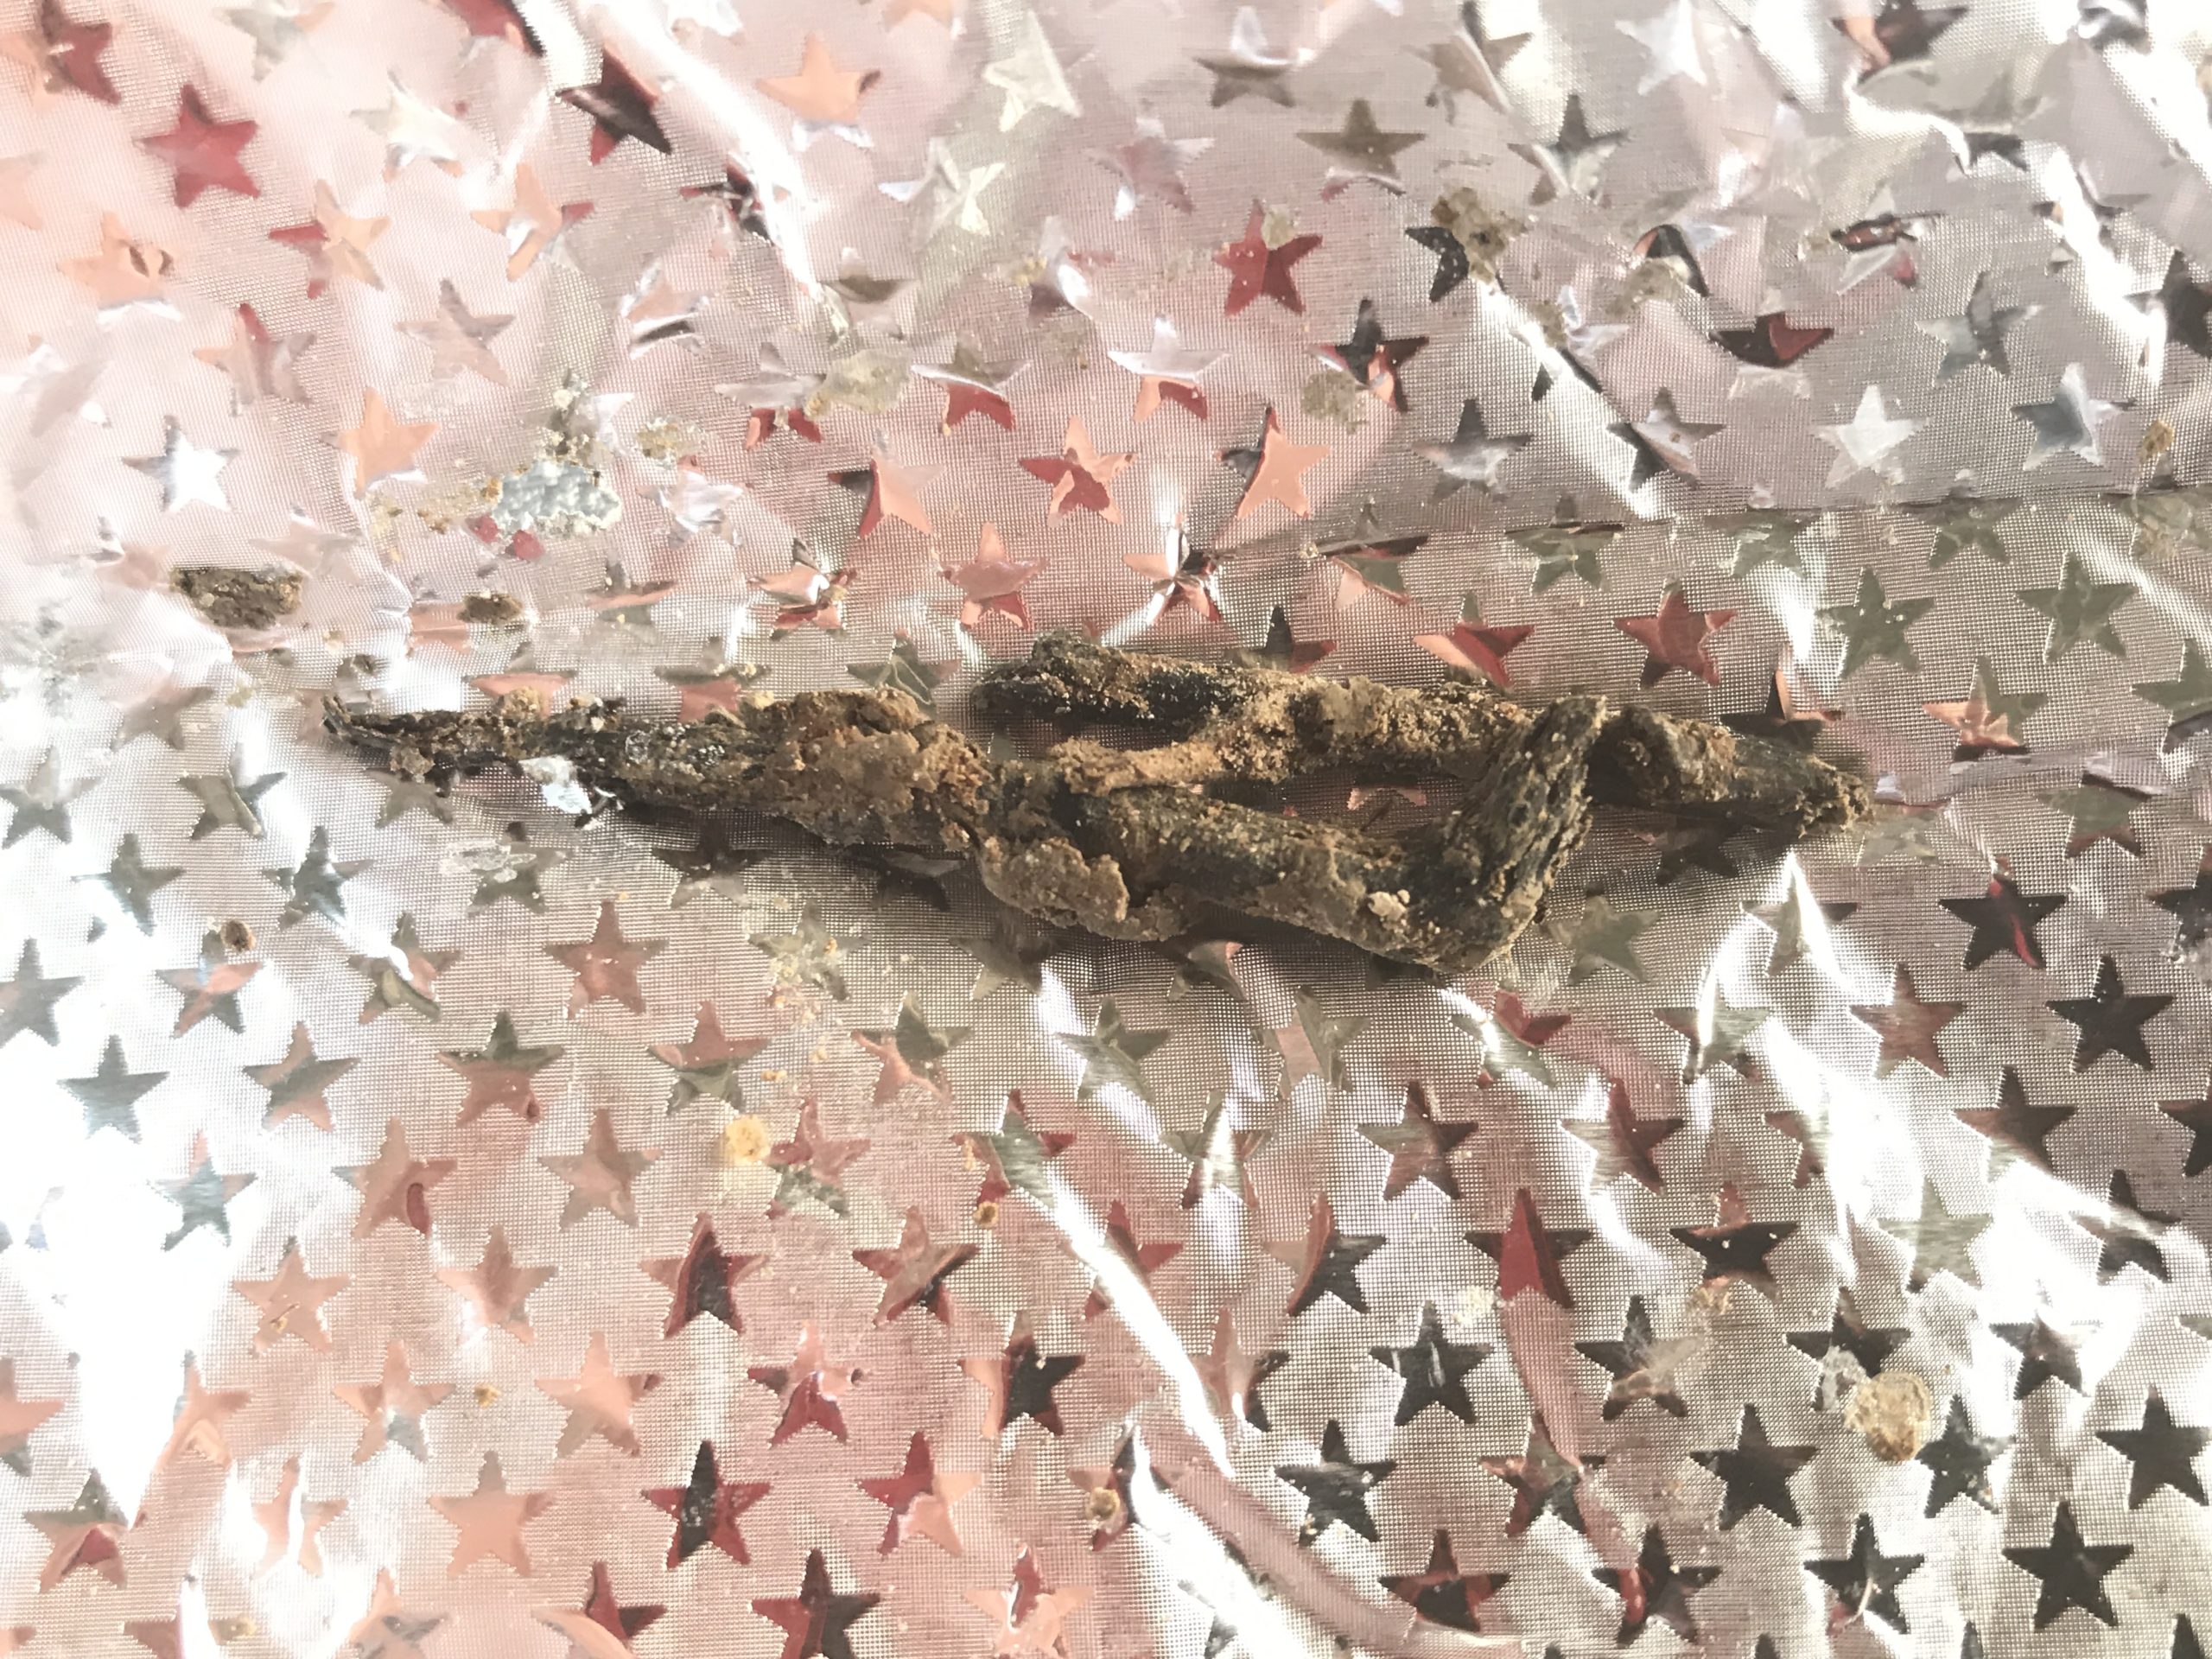
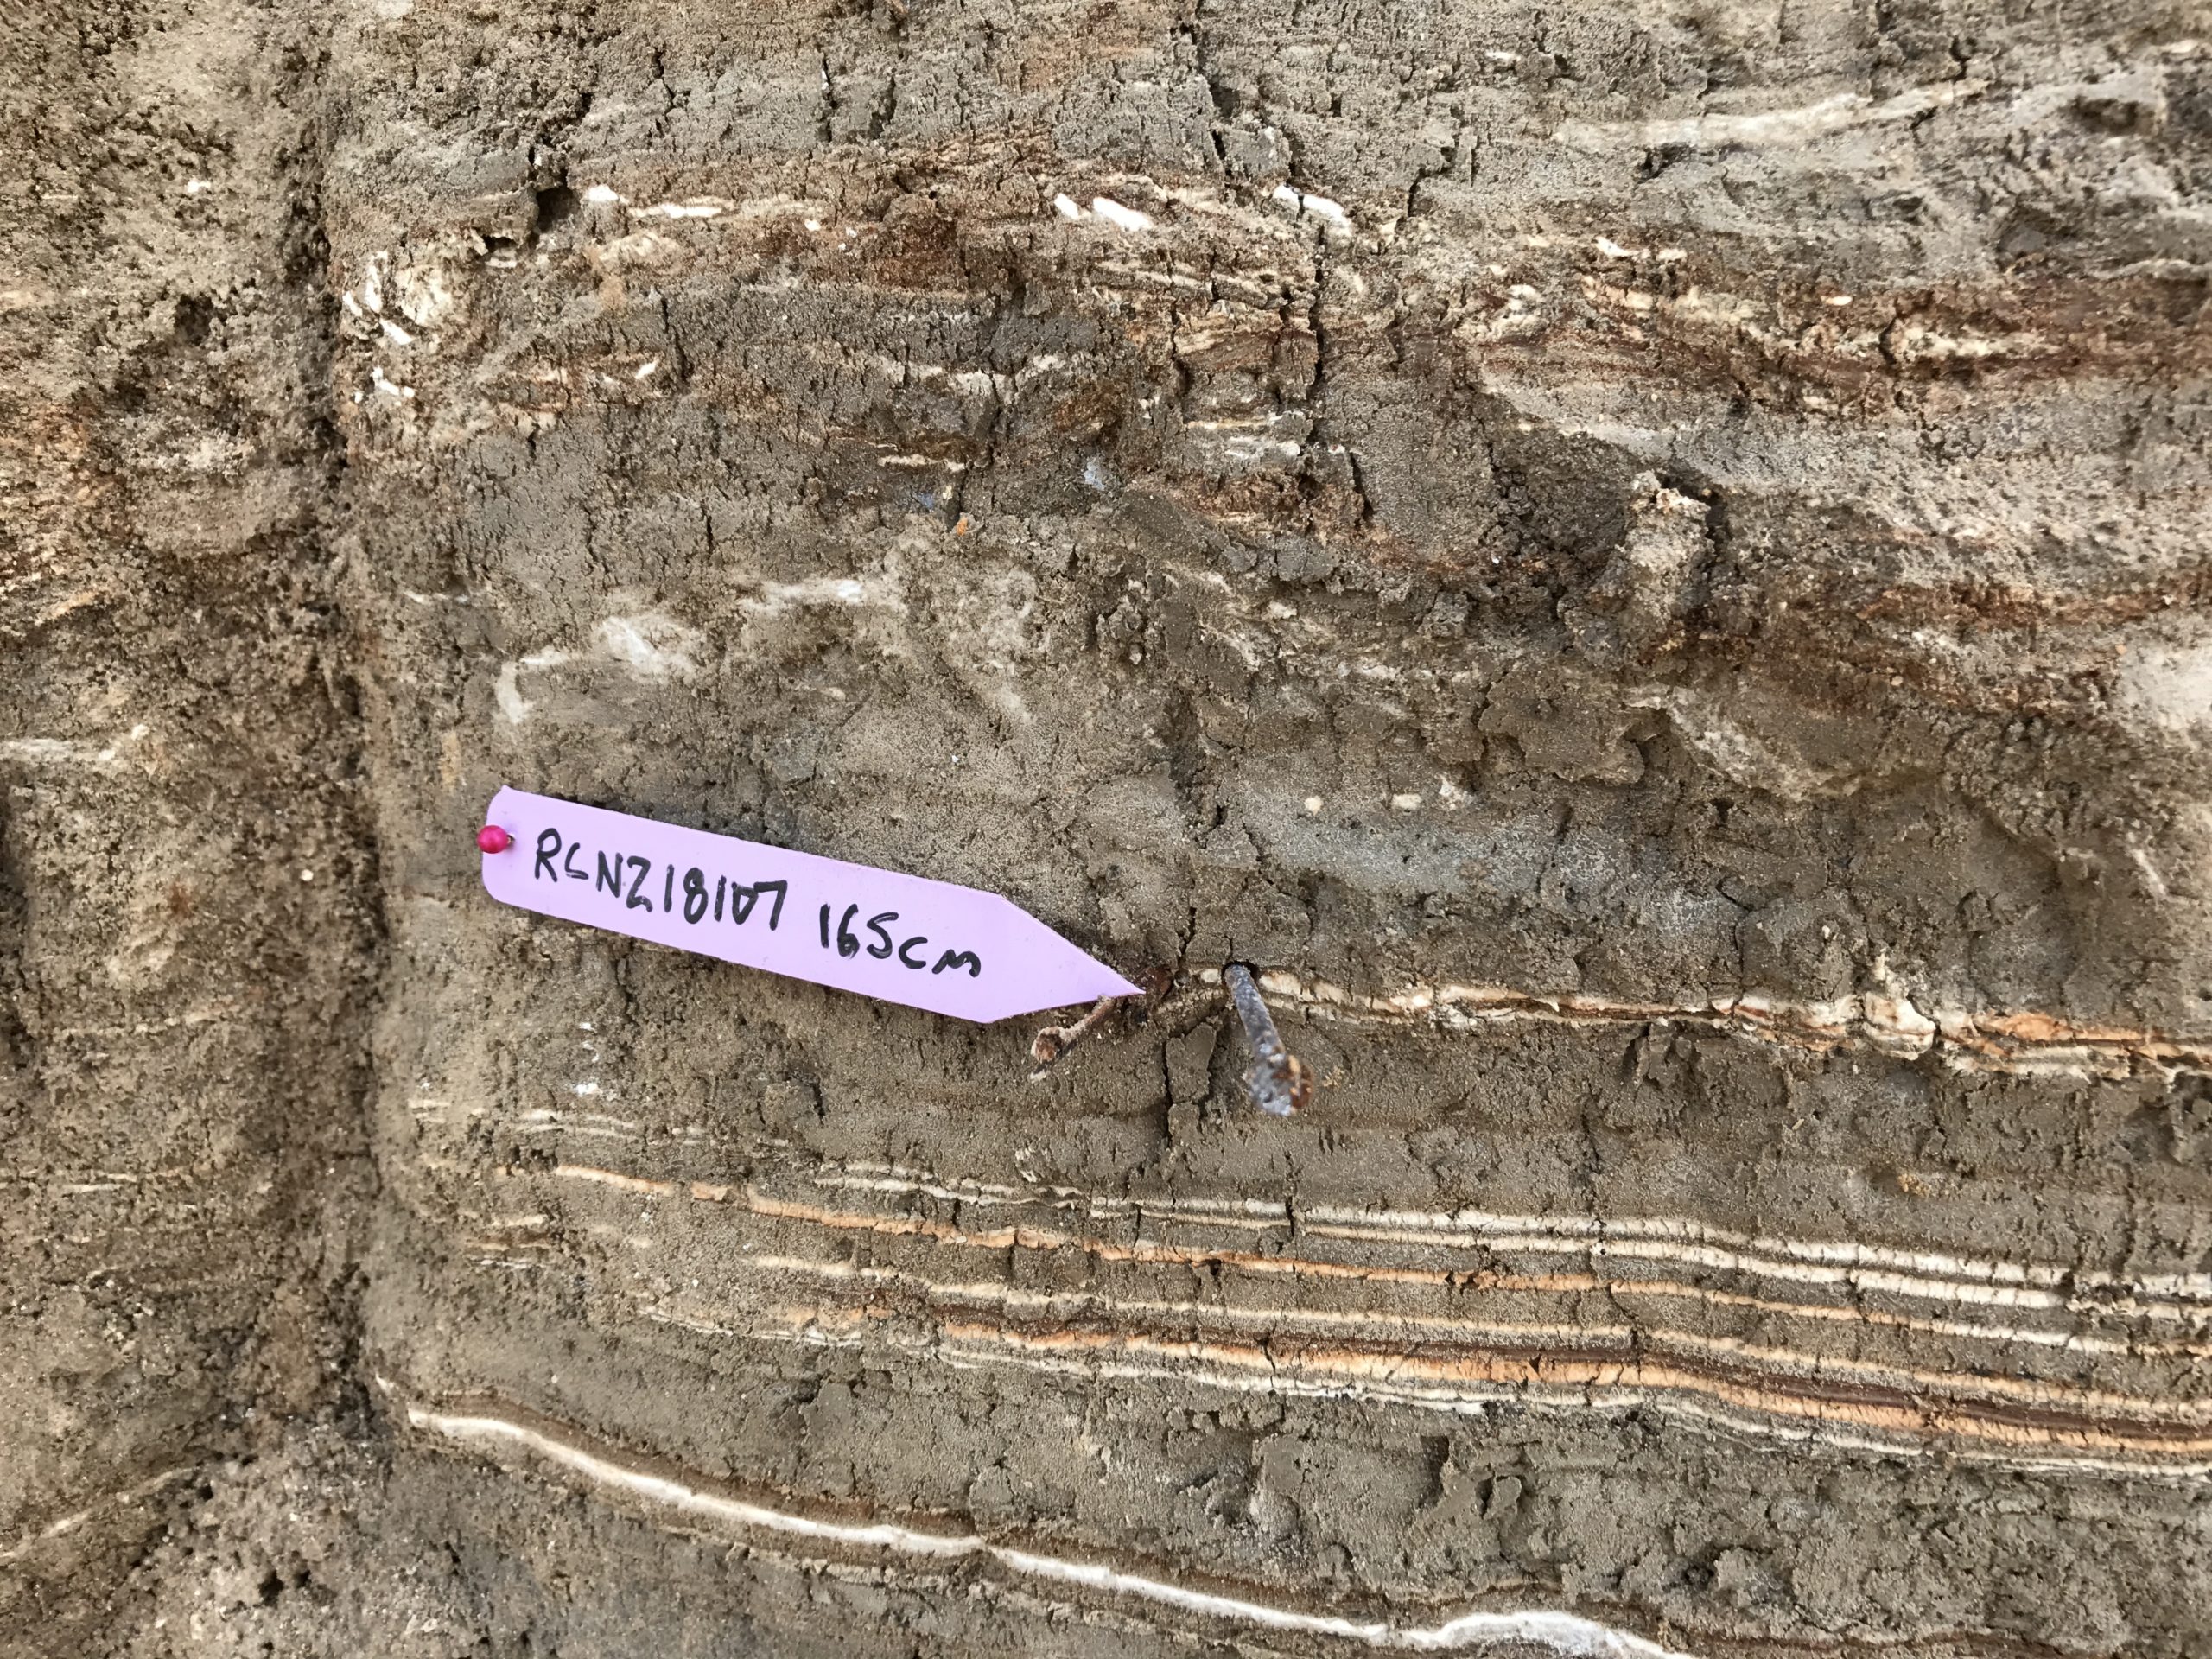
| RCNZ18107 |
 Radiocarbon Sample RCNZ18107 in situ
Click on photo to open magnifiable image in a new tab Photo by Jefferson Williams 2018 |
 Radiocarbon Sample RCNZ18107 before being sent to the lab
Click on photo to open magnifiable image in a new tab Photo by Jefferson Williams |
JW: Big Twig, some burning, Lab: Wood - in seismite | 165 | 1637 | 25 |
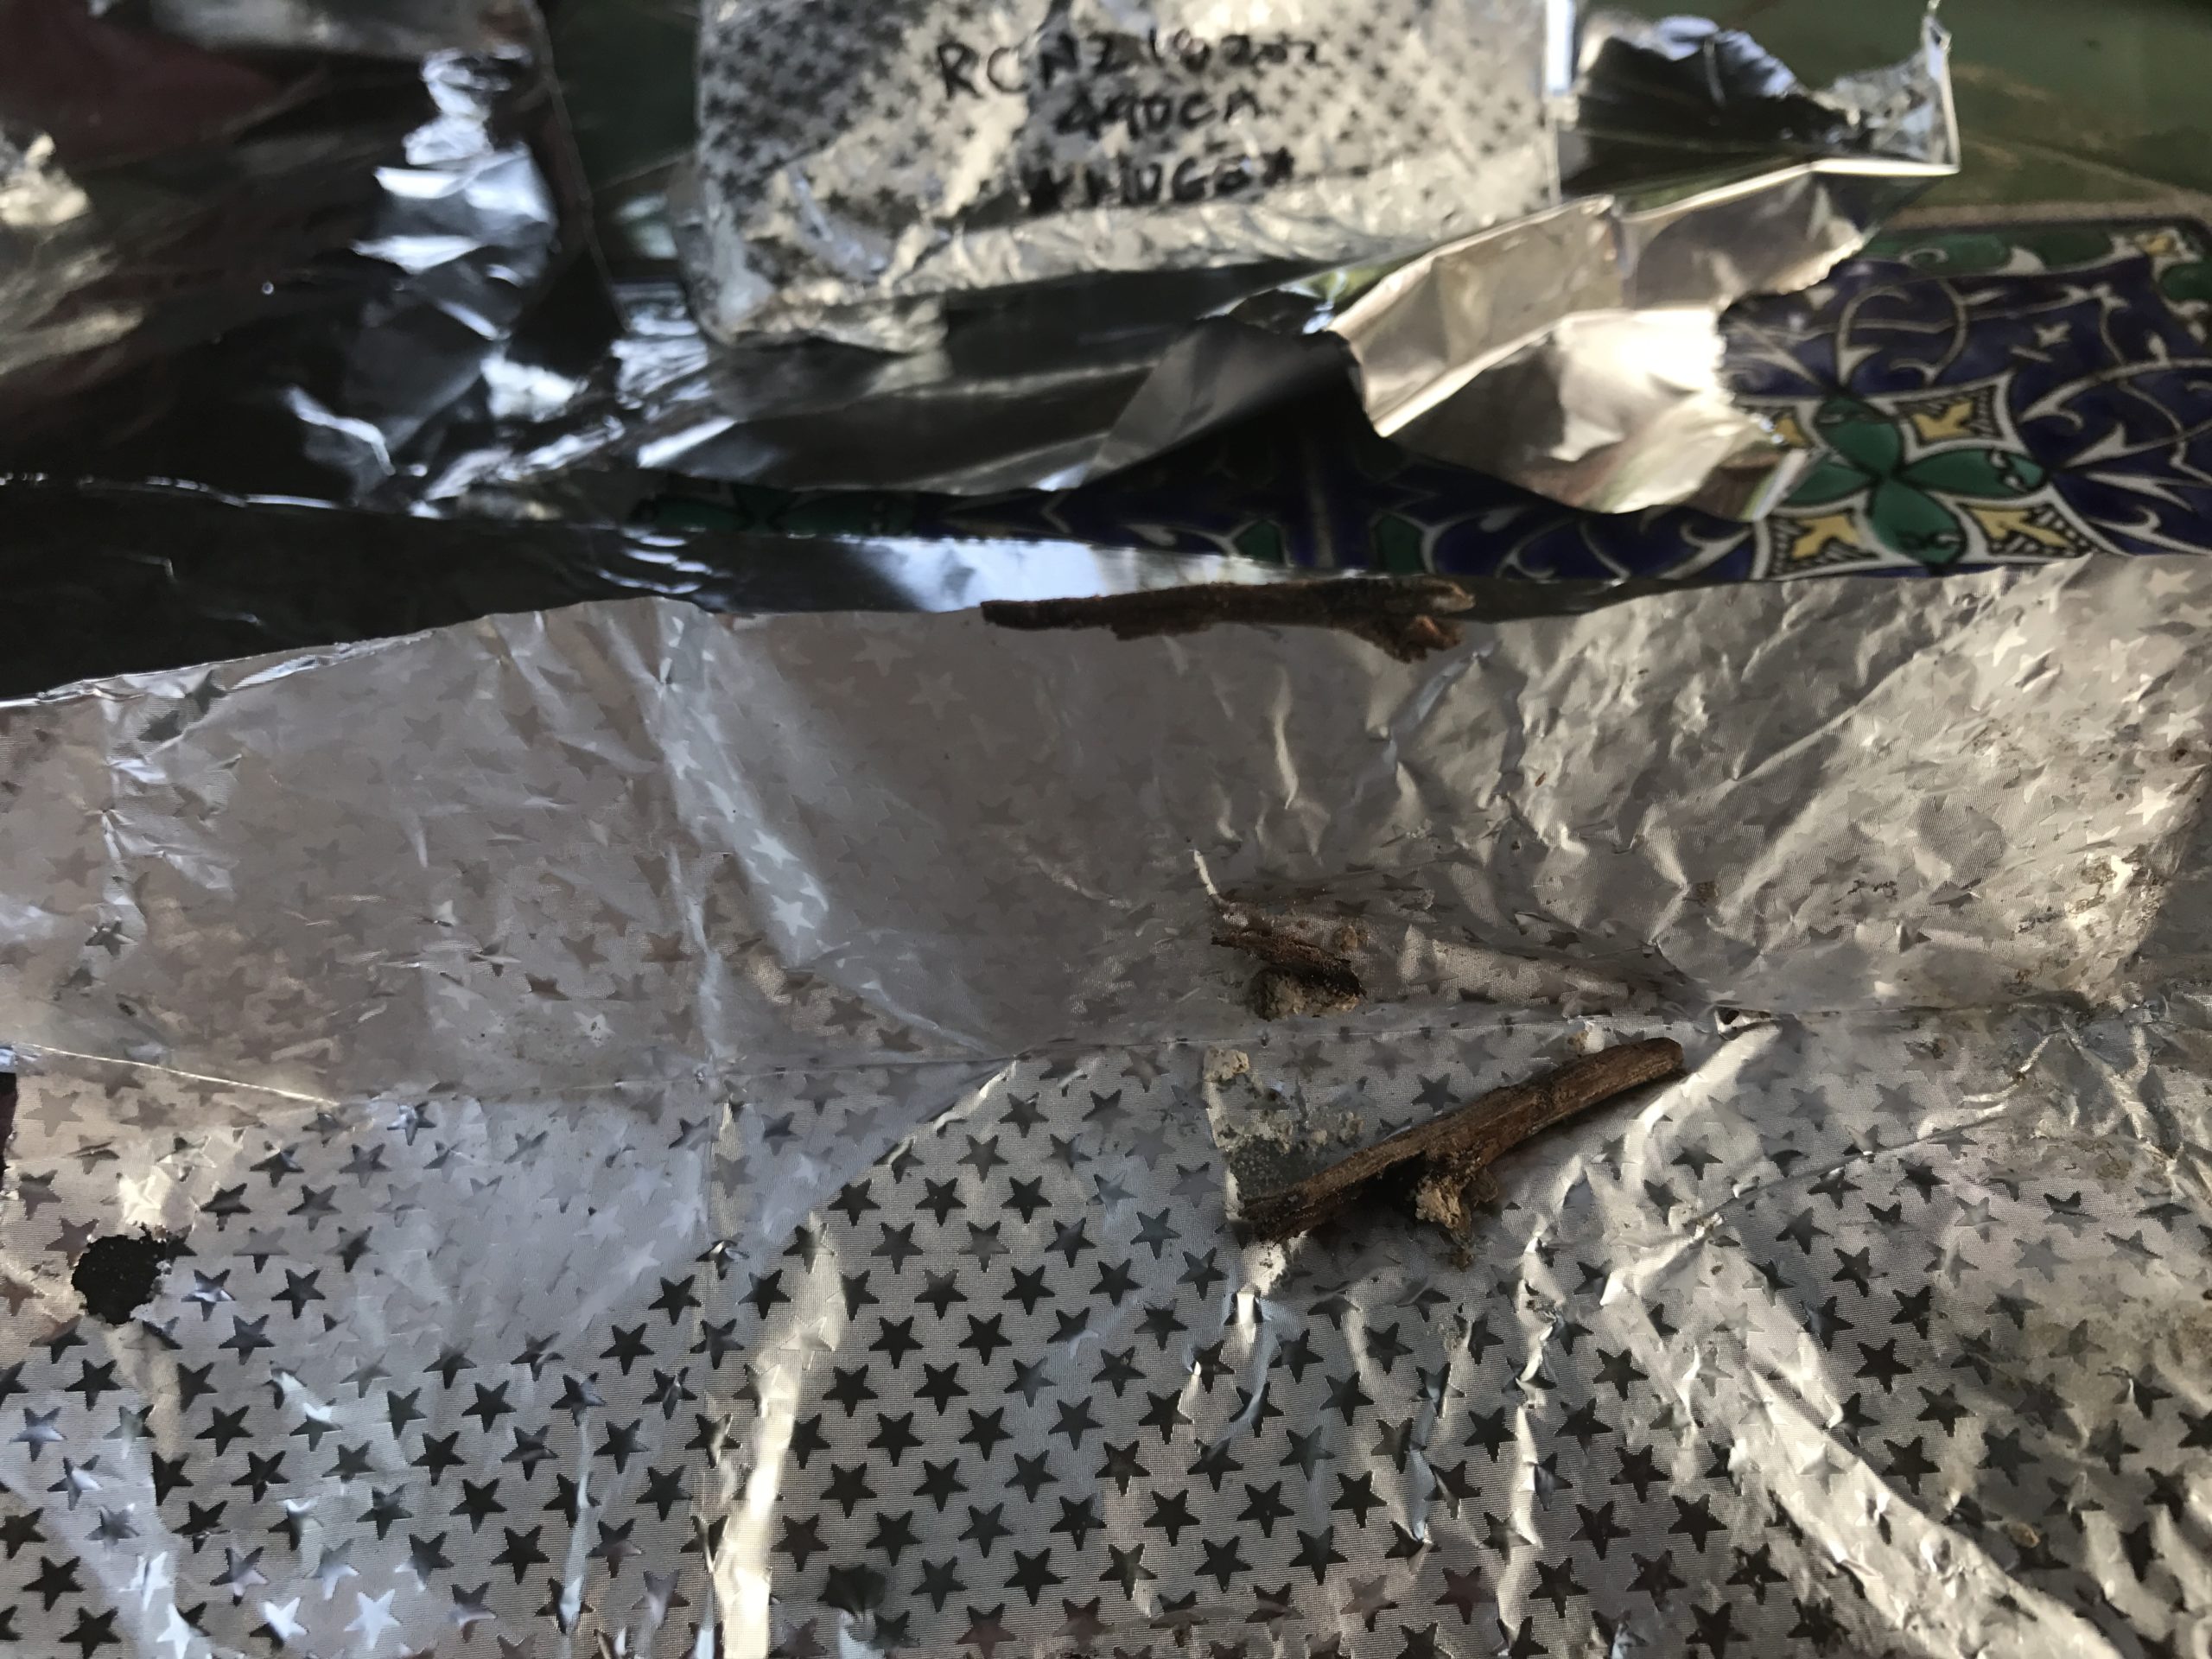
| RCNZ18200 |
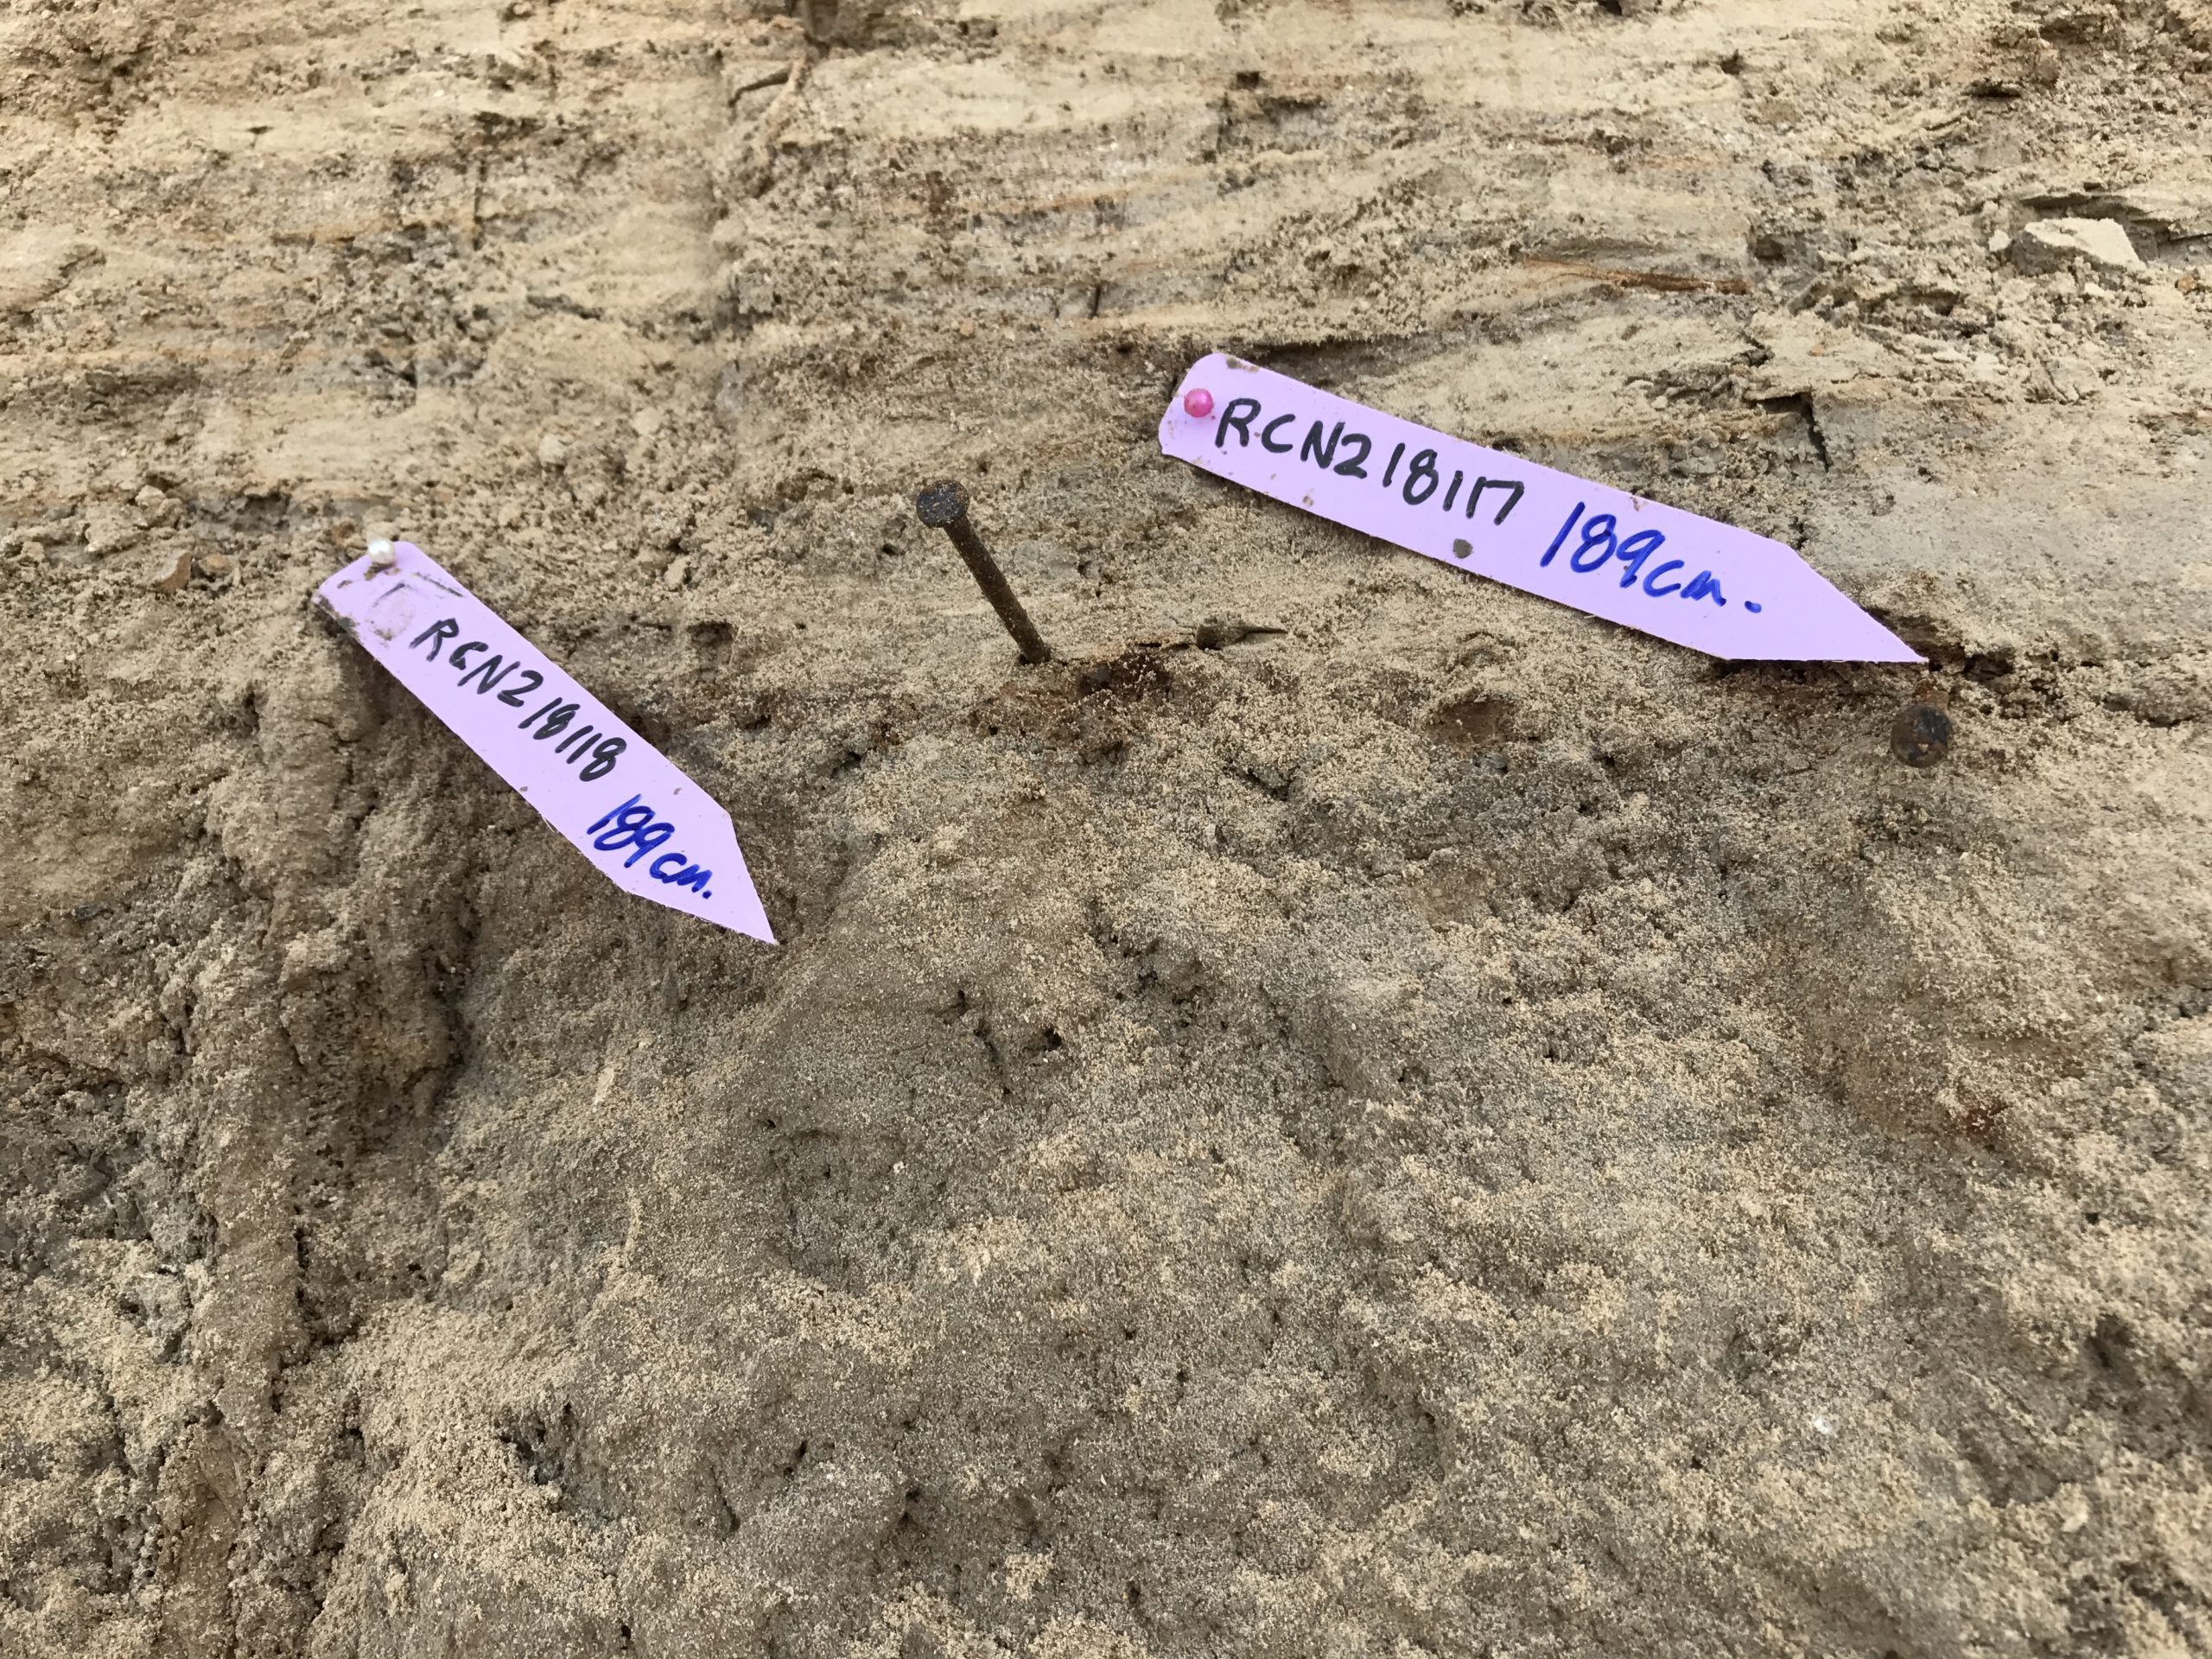 Radiocarbon Sample RCNZ18200 was not photographed in the field, but it is just above sample RCNZ18118 which is shown here in situ
Click on photo to open magnifiable image in a new tab Photo by Jefferson Williams 2018 |
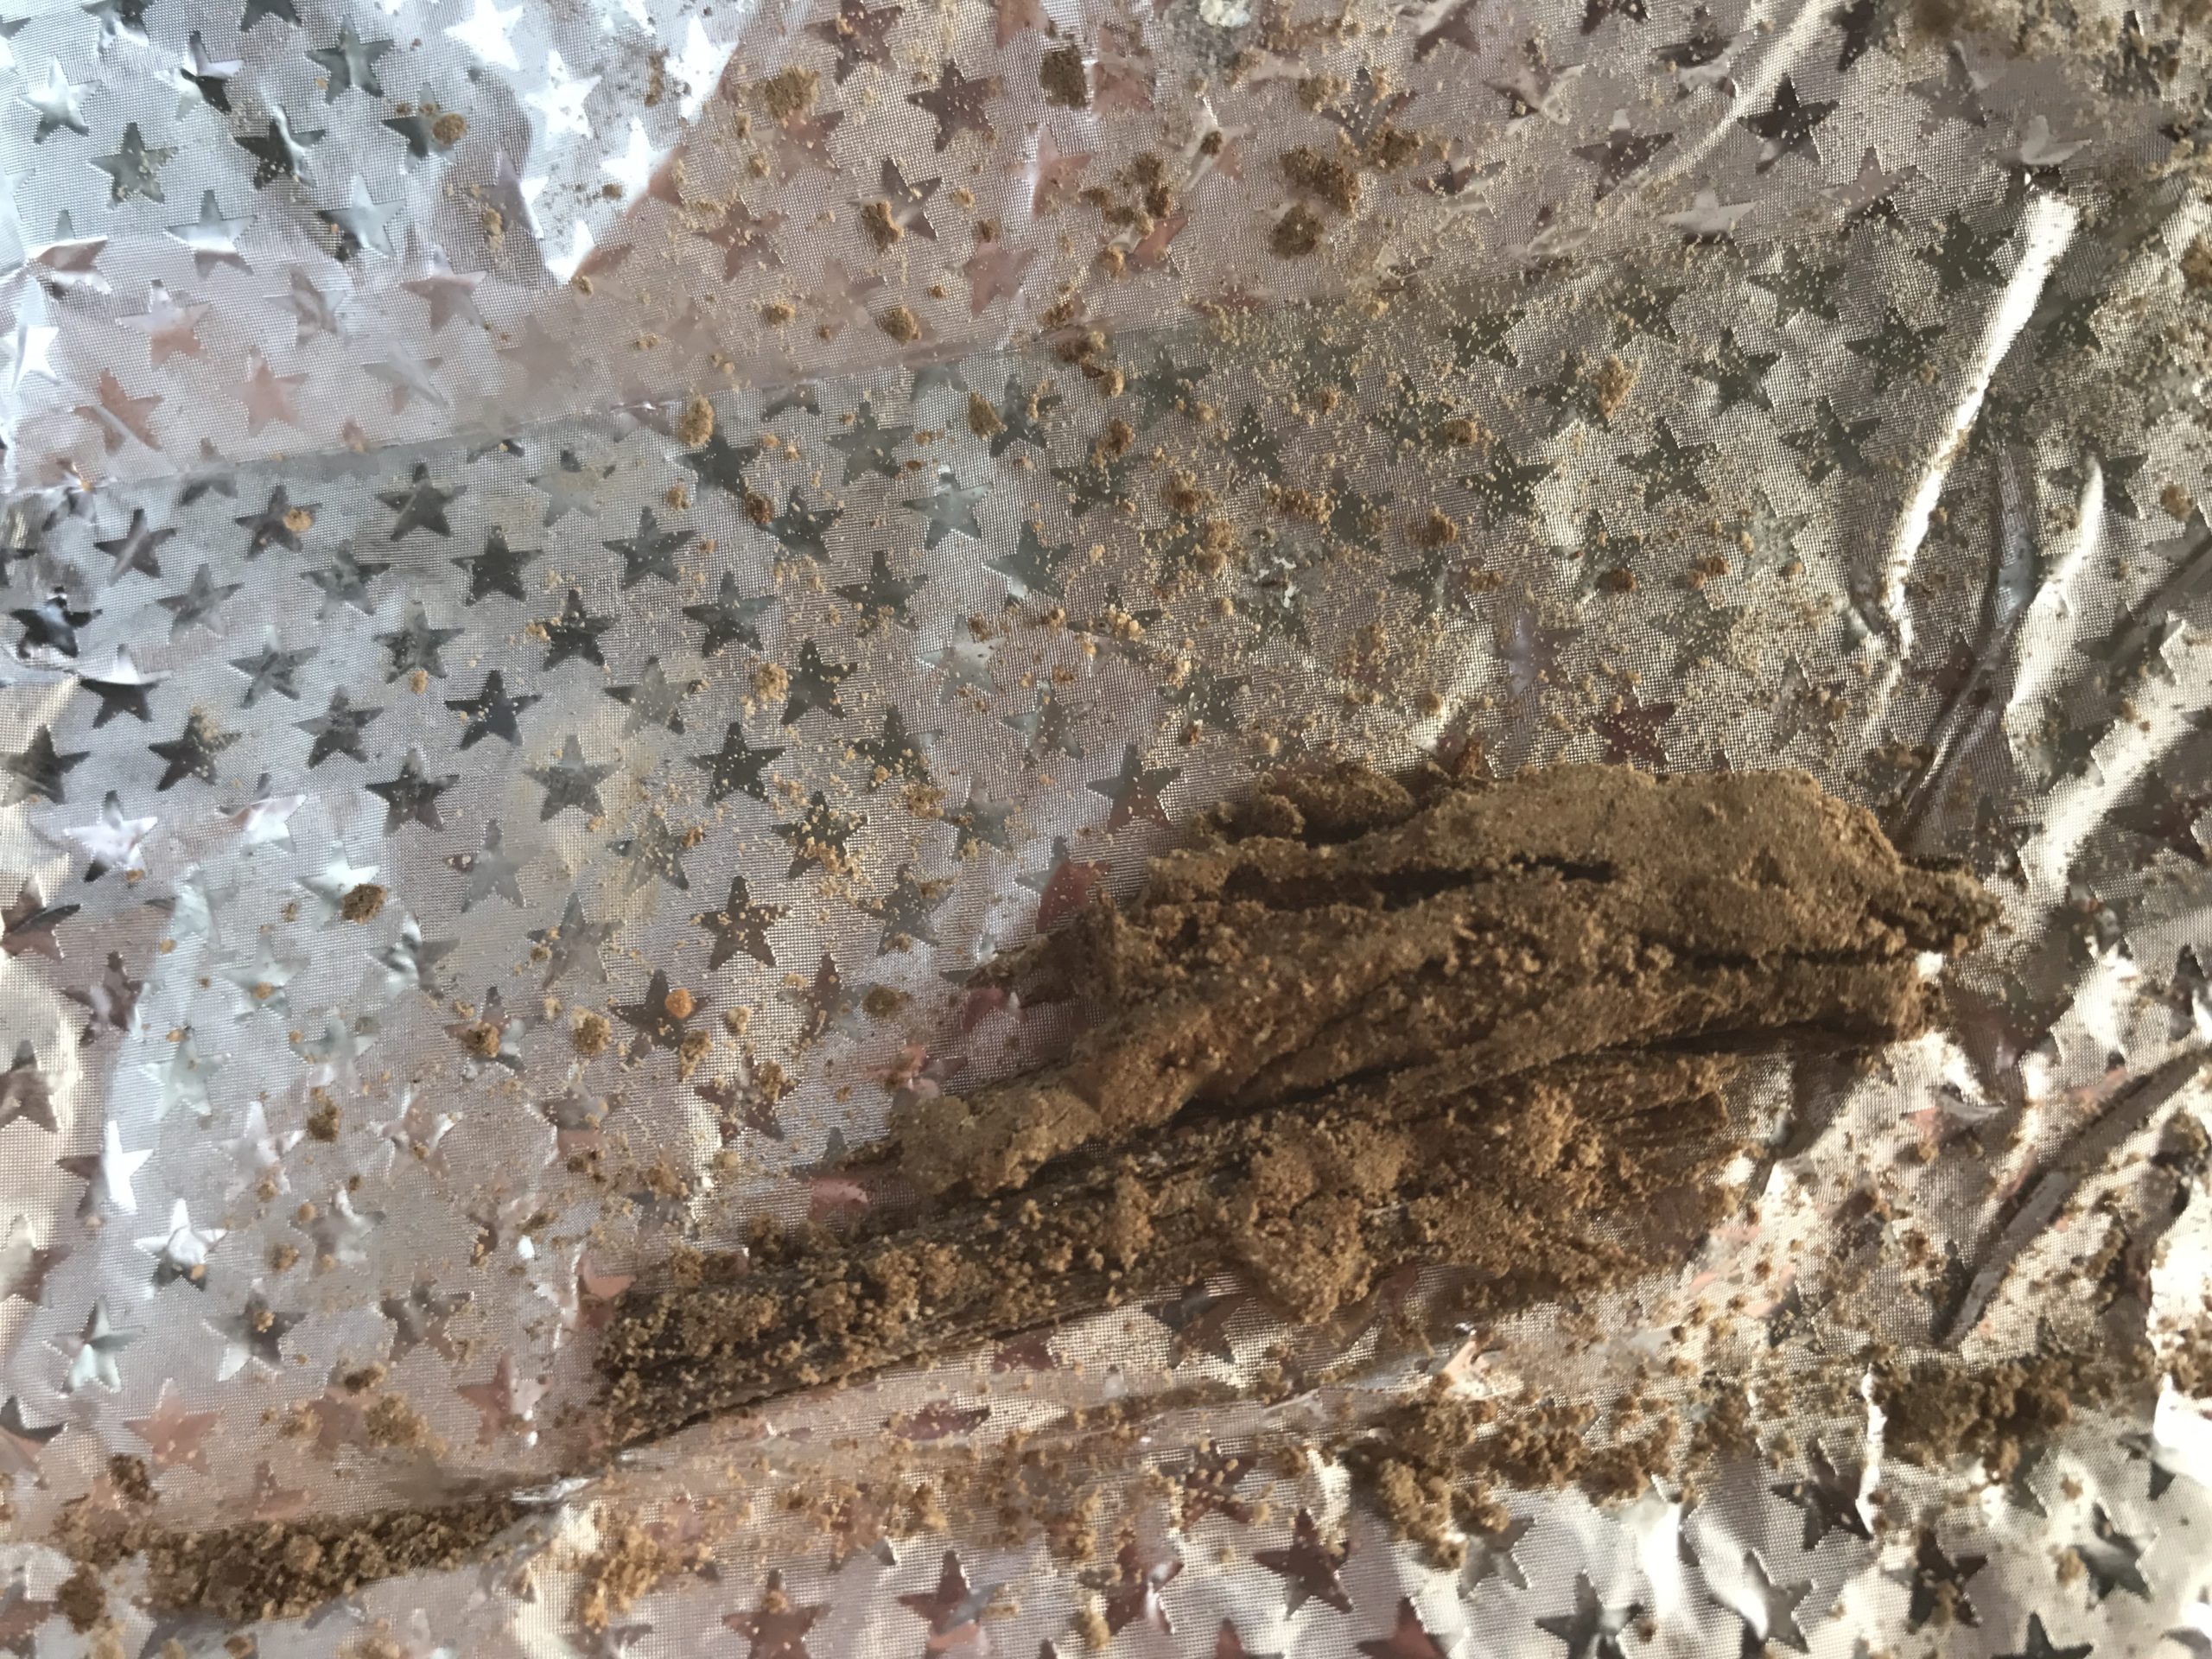 Radiocarbon Sample RCNZ18200 before being sent to the lab
Click on photo to open magnifiable image in a new tab Photo by Jefferson Williams |
JW: 3 big twigs no field photo just above RCNZ18118, Lab: Wood - in seismite | 179 | 1664 | 30 |
| RCNZ18106 |
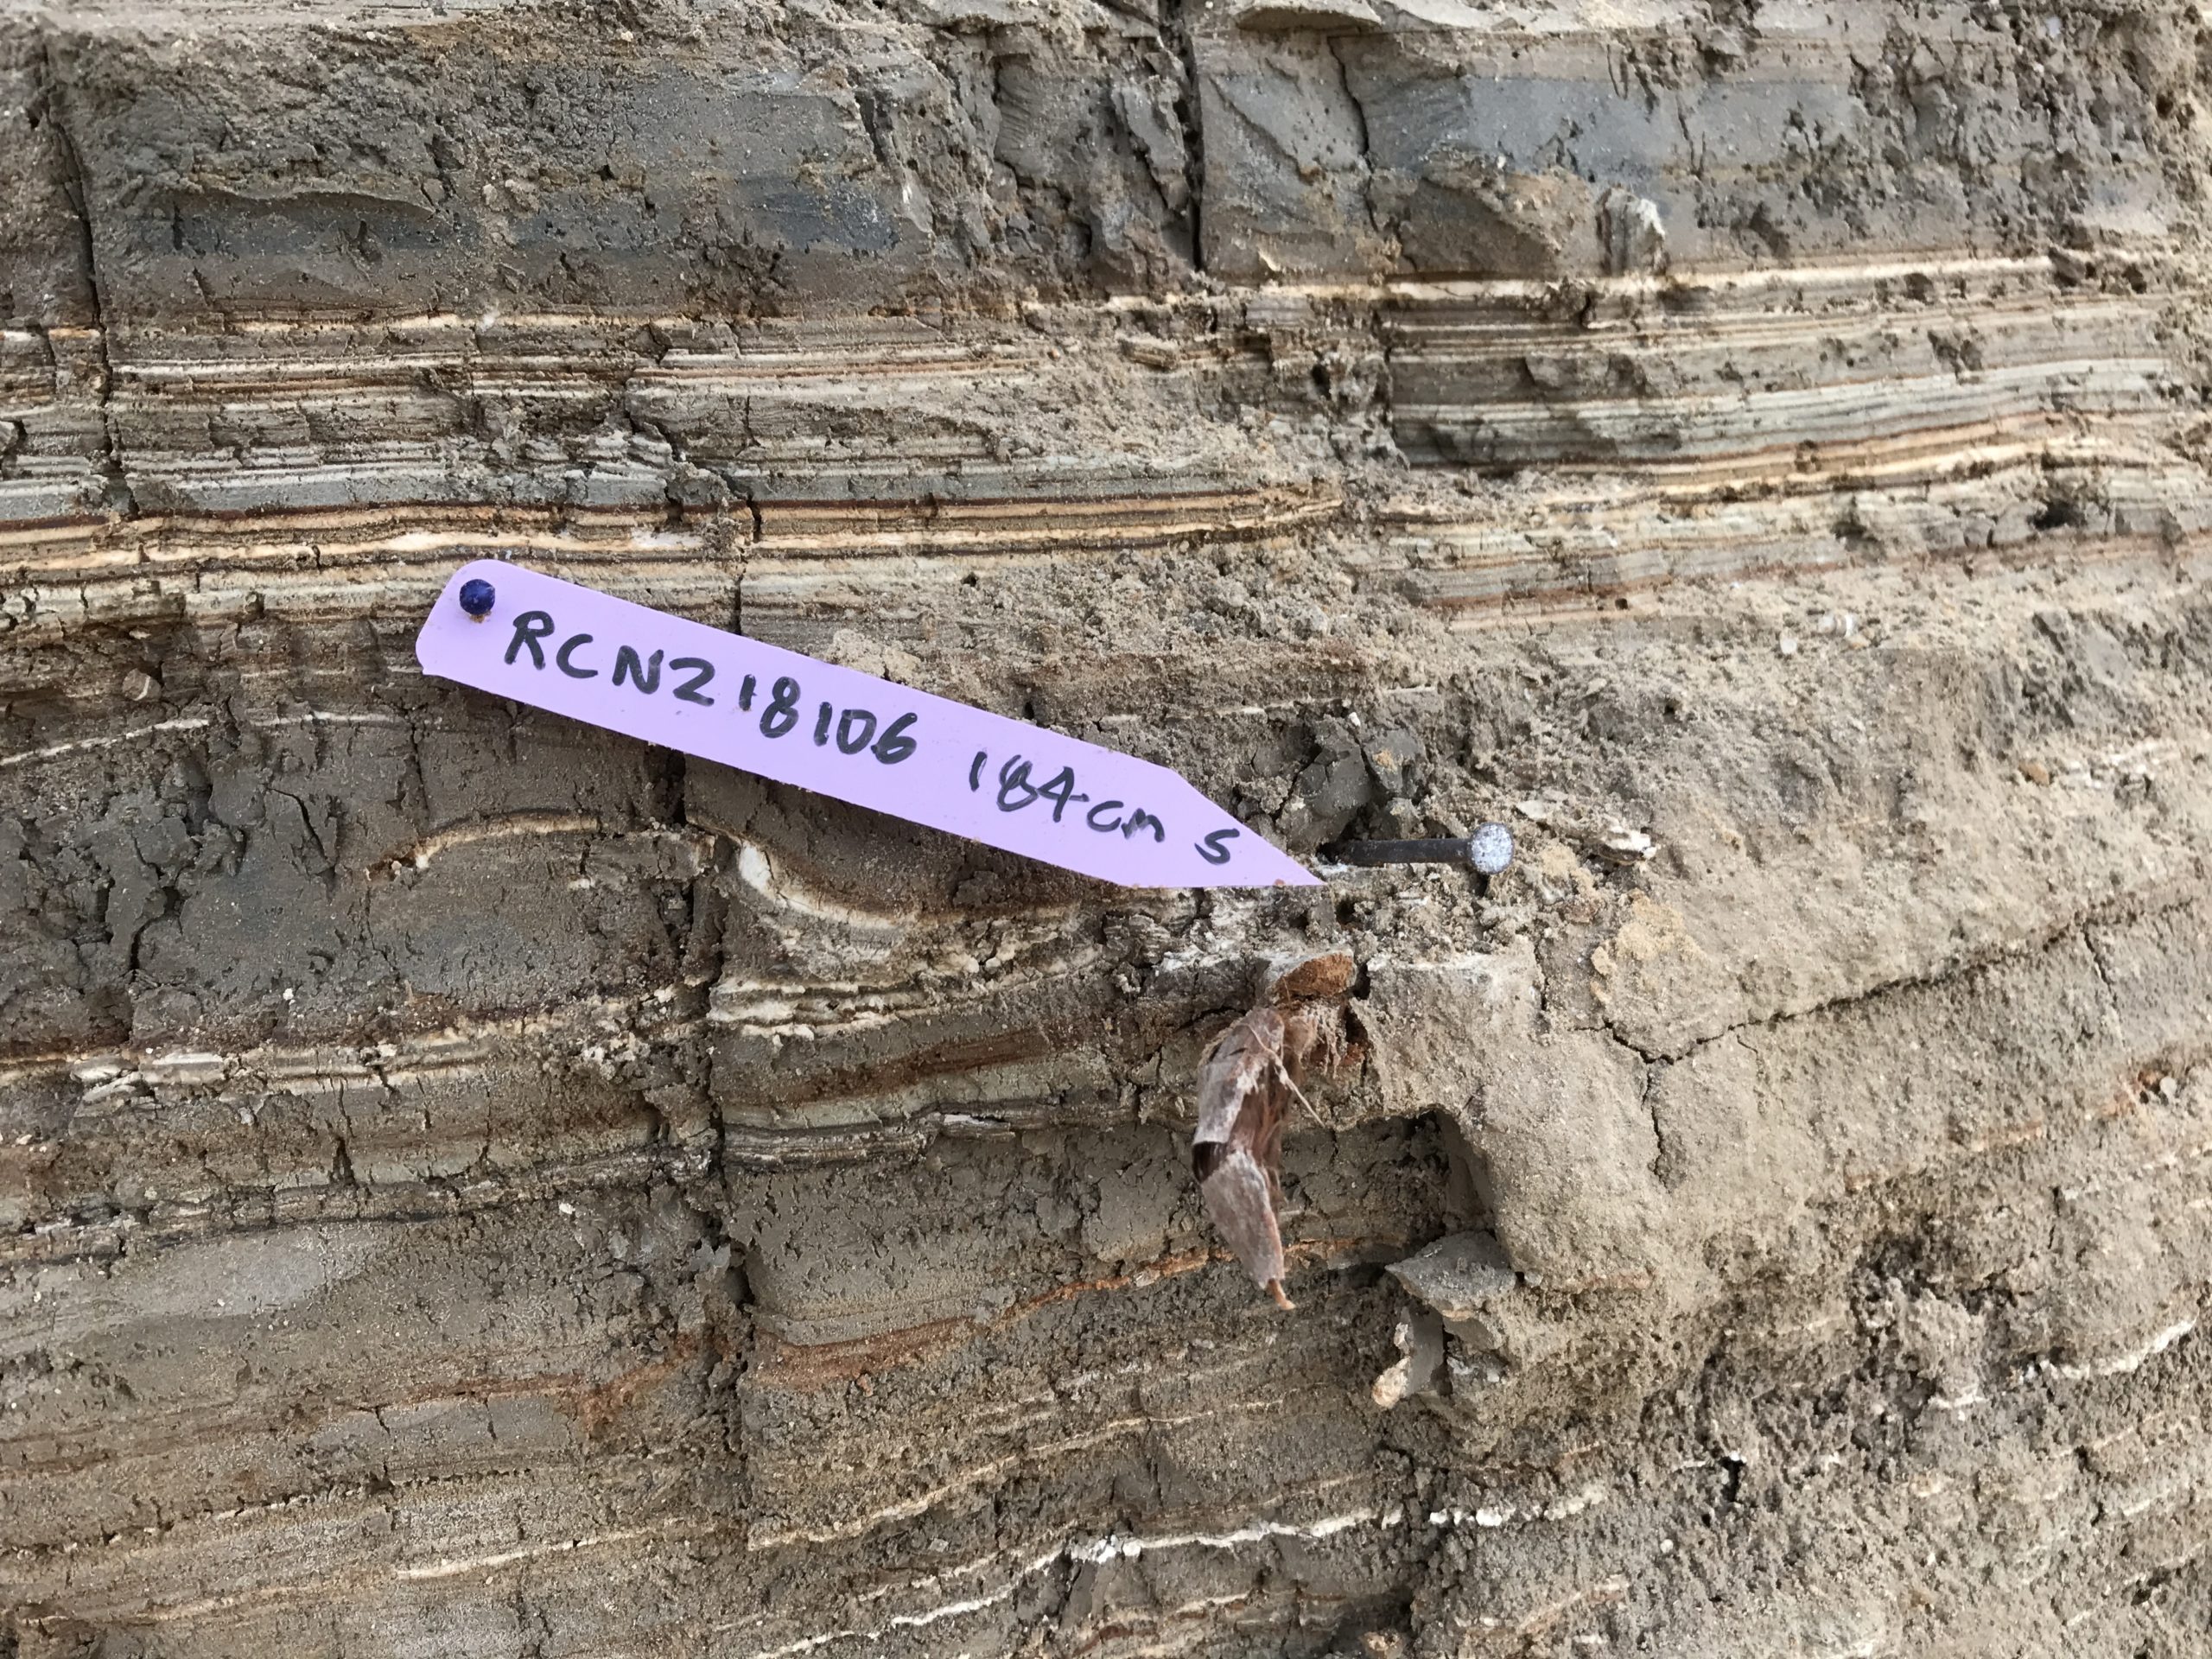 Radiocarbon Sample RCNZ18106 in situ
Click on photo to open magnifiable image in a new tab Photo by Jefferson Williams 2018 |
 Radiocarbon Sample RCNZ18106 before being sent to the lab
Click on photo to open magnifiable image in a new tab Photo by Jefferson Williams |
JW: Huge looks recent some burning, Lab: Wood - in seismite | 184 | 1666 | 28 |
| RCNZ18119 |
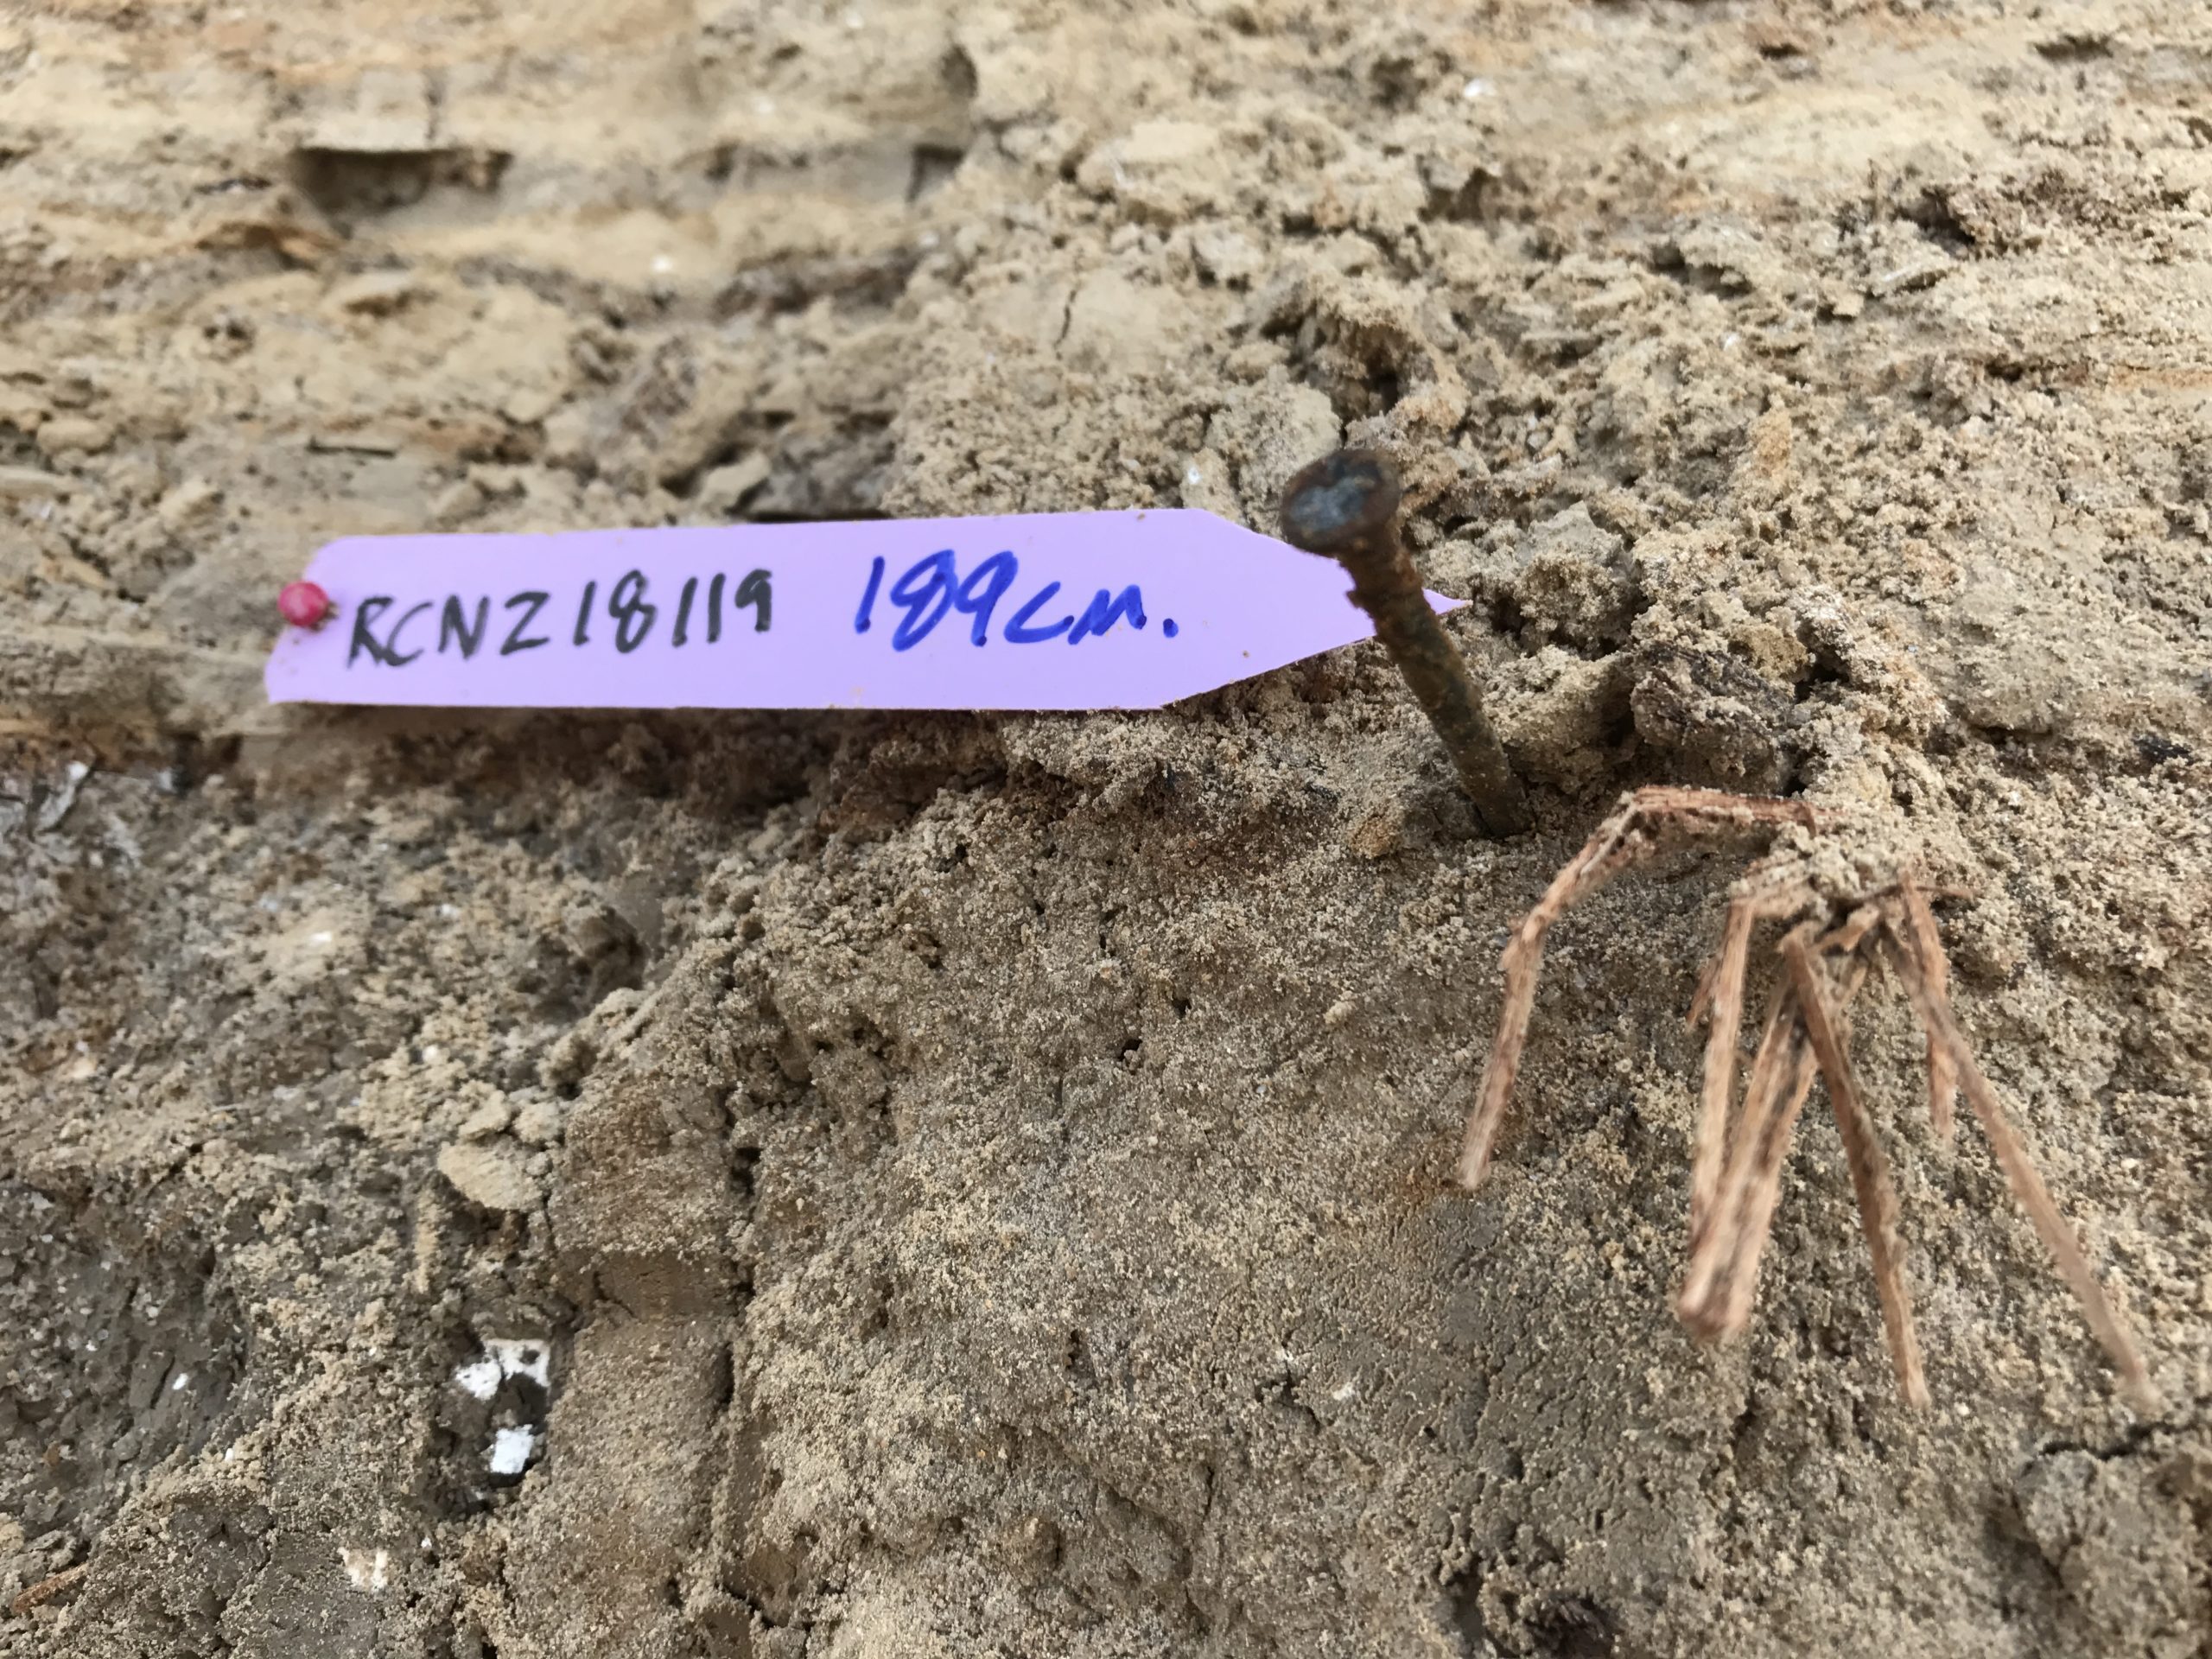 Radiocarbon Sample RCNZ18119 in situ
Click on photo to open magnifiable image in a new tab Photo by Jefferson Williams 2018 |
Sample RCNZ18119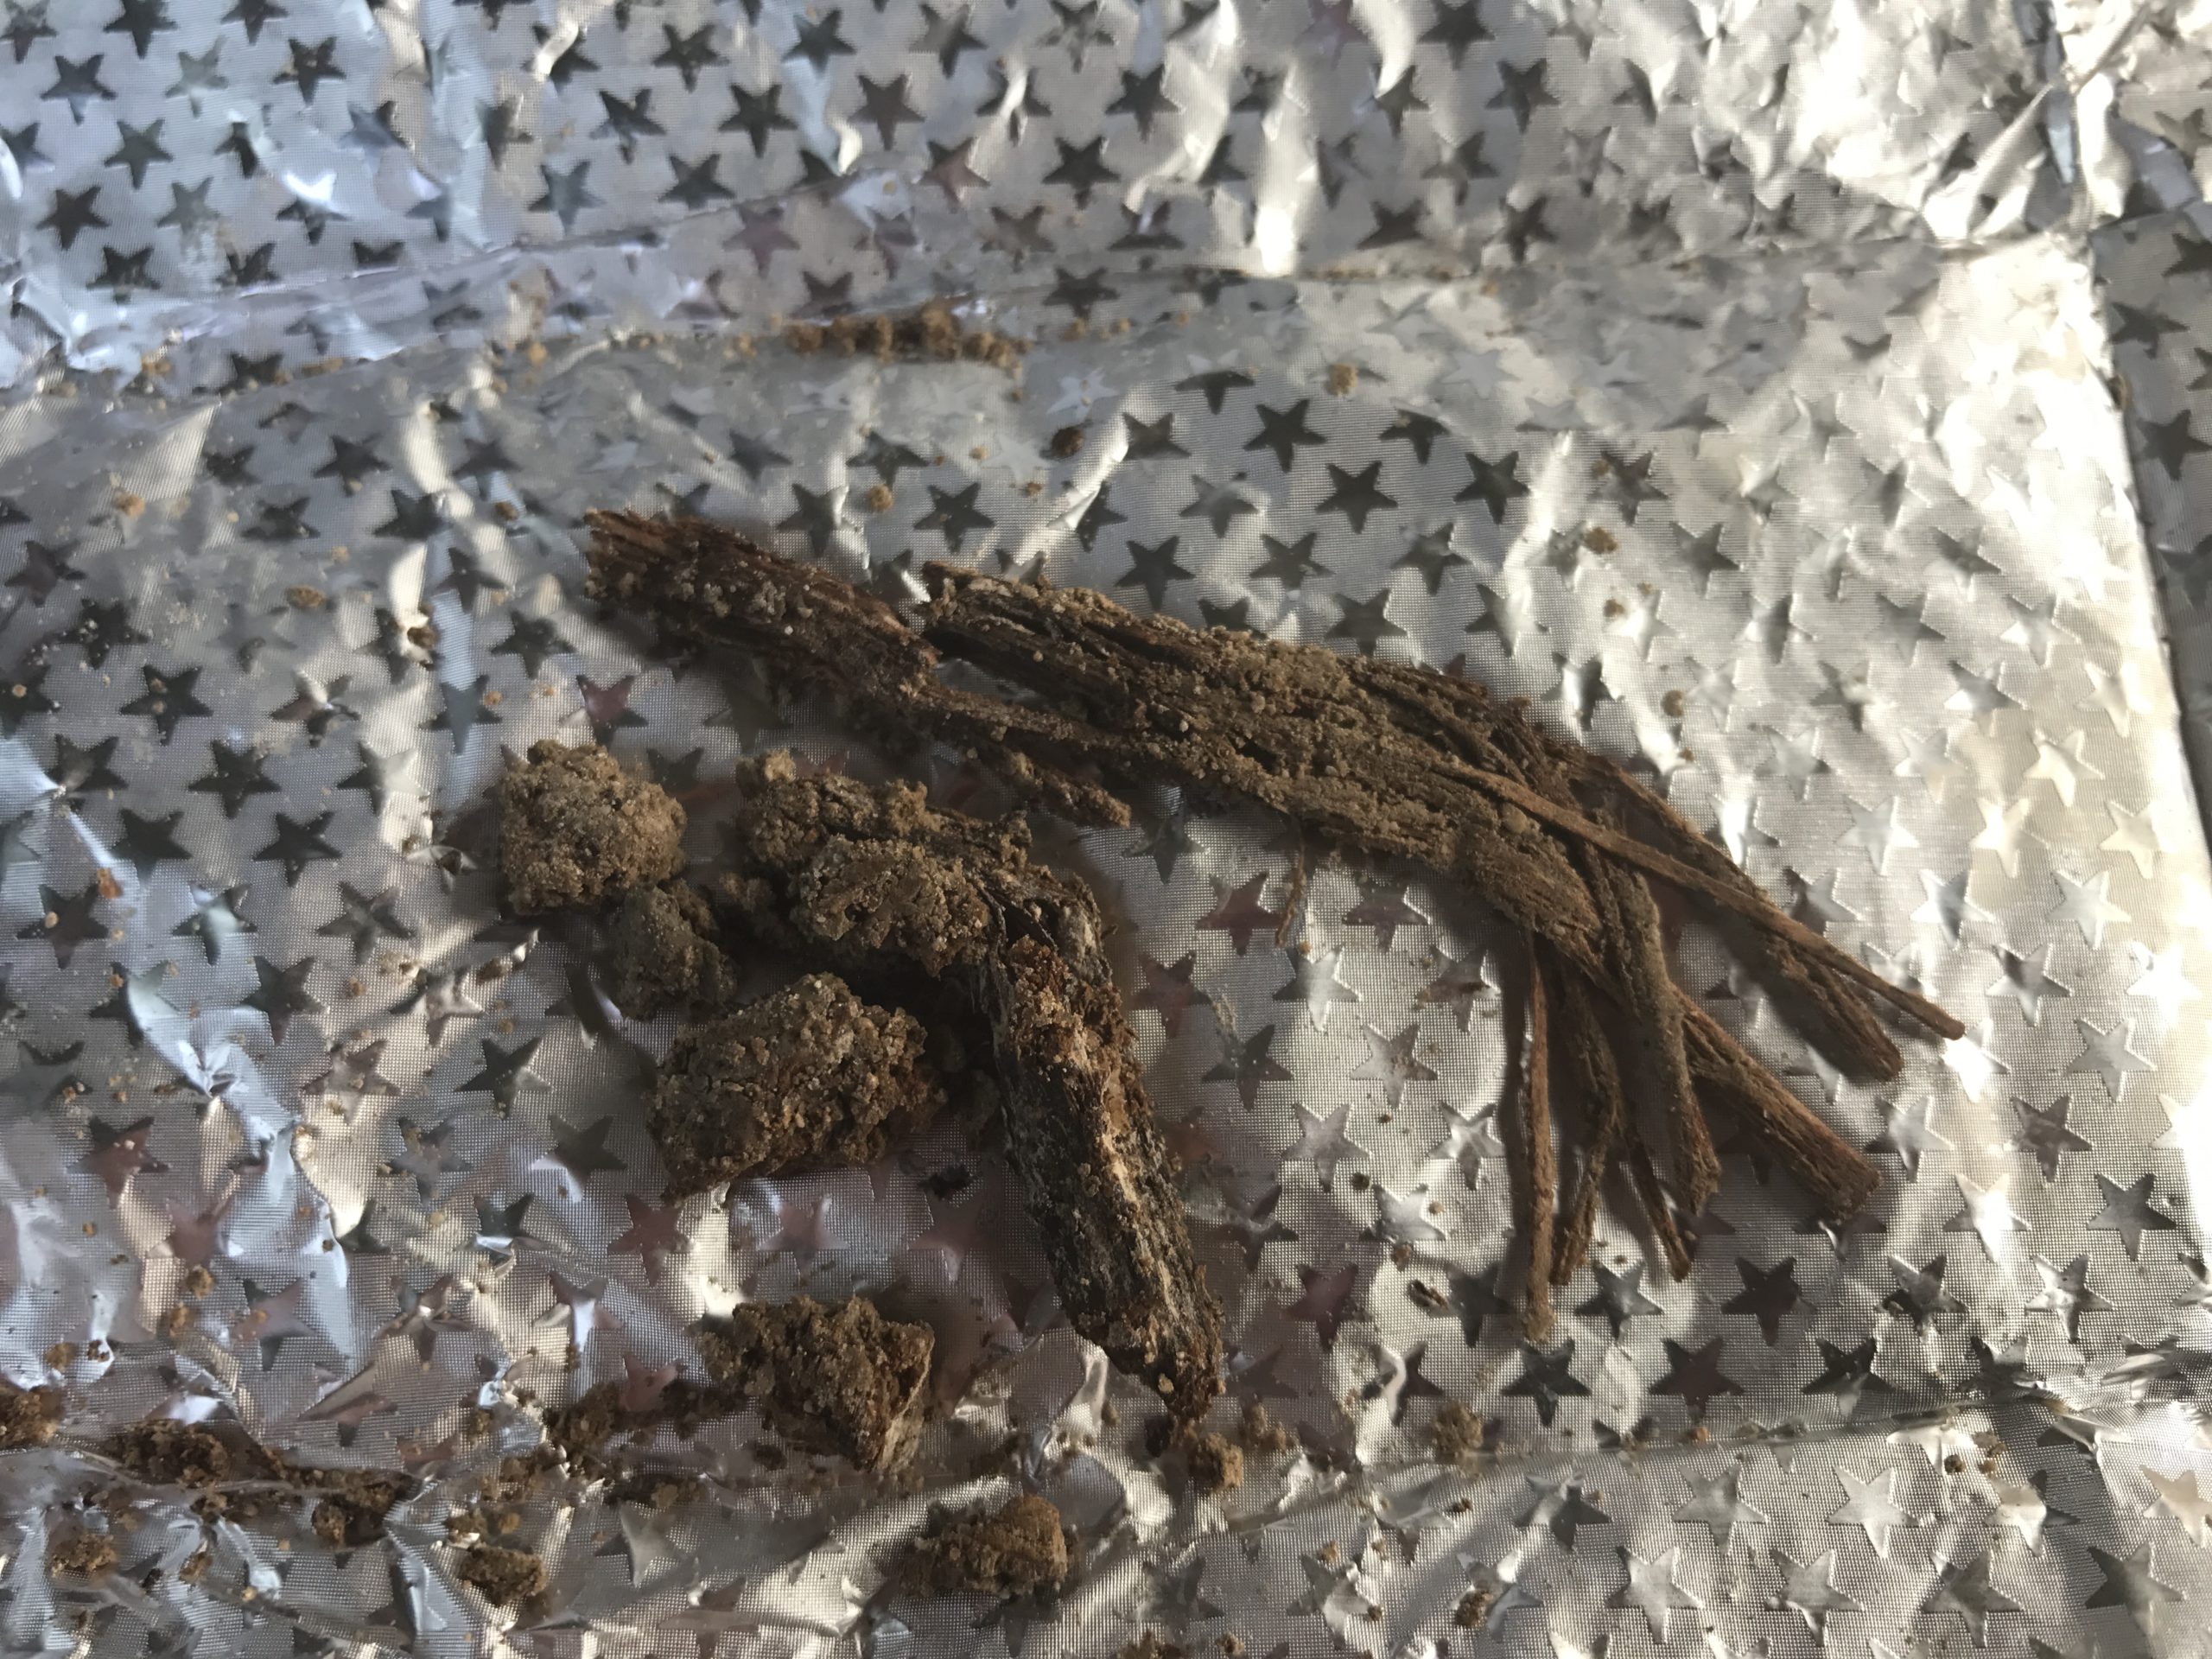 Radiocarbon Sample RCNZ18119 before being sent to the lab
Click on photo to open magnifiable image in a new tab Photo by Jefferson Williams Sample 2  Radiocarbon Sample RCNZ18119 Sample 2 before being sent to the lab
Click on photo to open magnifiable image in a new tab Photo by Jefferson Williams |
JW: Huge some burning, Lab: Wood - not in seismite | 189 | 1301 | 26 |
| RCNZ18035 |
 Radiocarbon Sample RCNZ18035 before being sent to the lab
Click on photo to open magnifiable image in a new tab Photo by Jefferson Williams |
JW : Big Twig looks old no field photo, Lab: Wood - not in seismite | 225 | 1373 | 26 | |
| RCNZ18029B |
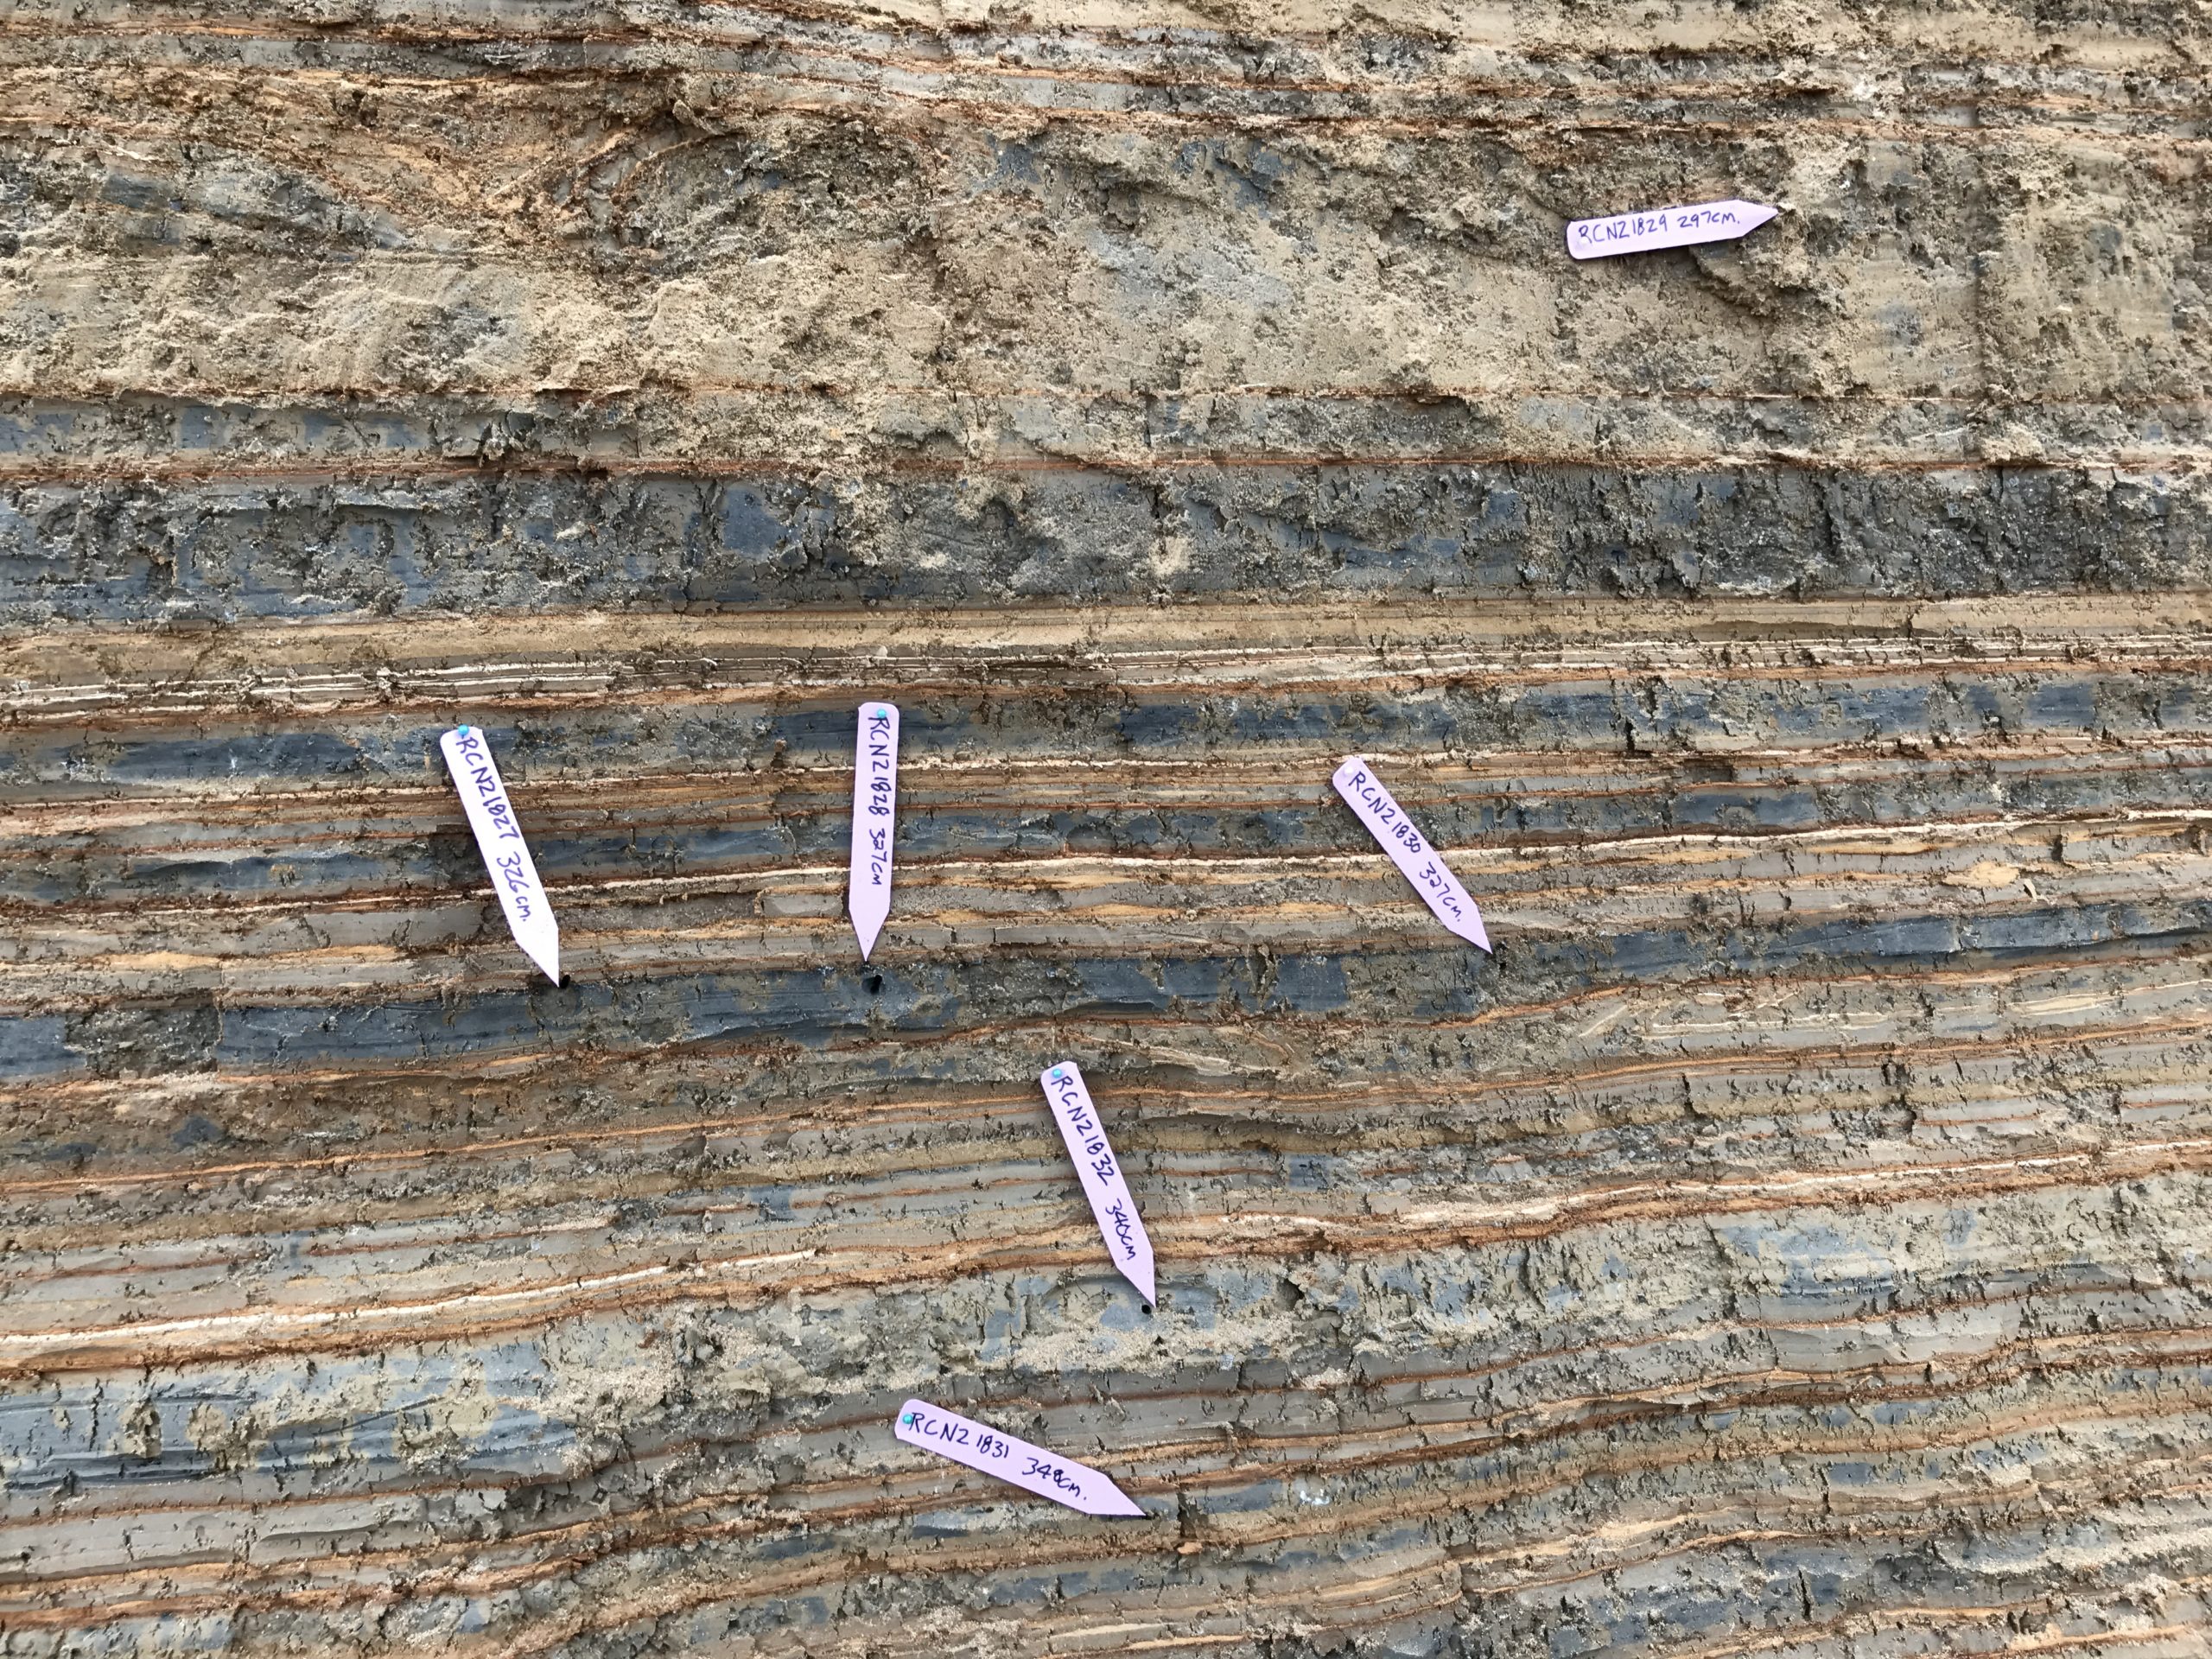 Radiocarbon Sample RCNZ18029B in situ
Click on photo to open magnifiable image in a new tab Photo by Jefferson Williams 2018 |
 Radiocarbon Sample RCNZ18029B before being sent to the lab
Click on photo to open magnifiable image in a new tab Photo by Jefferson Williams |
JW : Big Twig looks old, Lab : Wood - not in seismite | 297 | 1831 | 25 |
| RCNZ18111 |
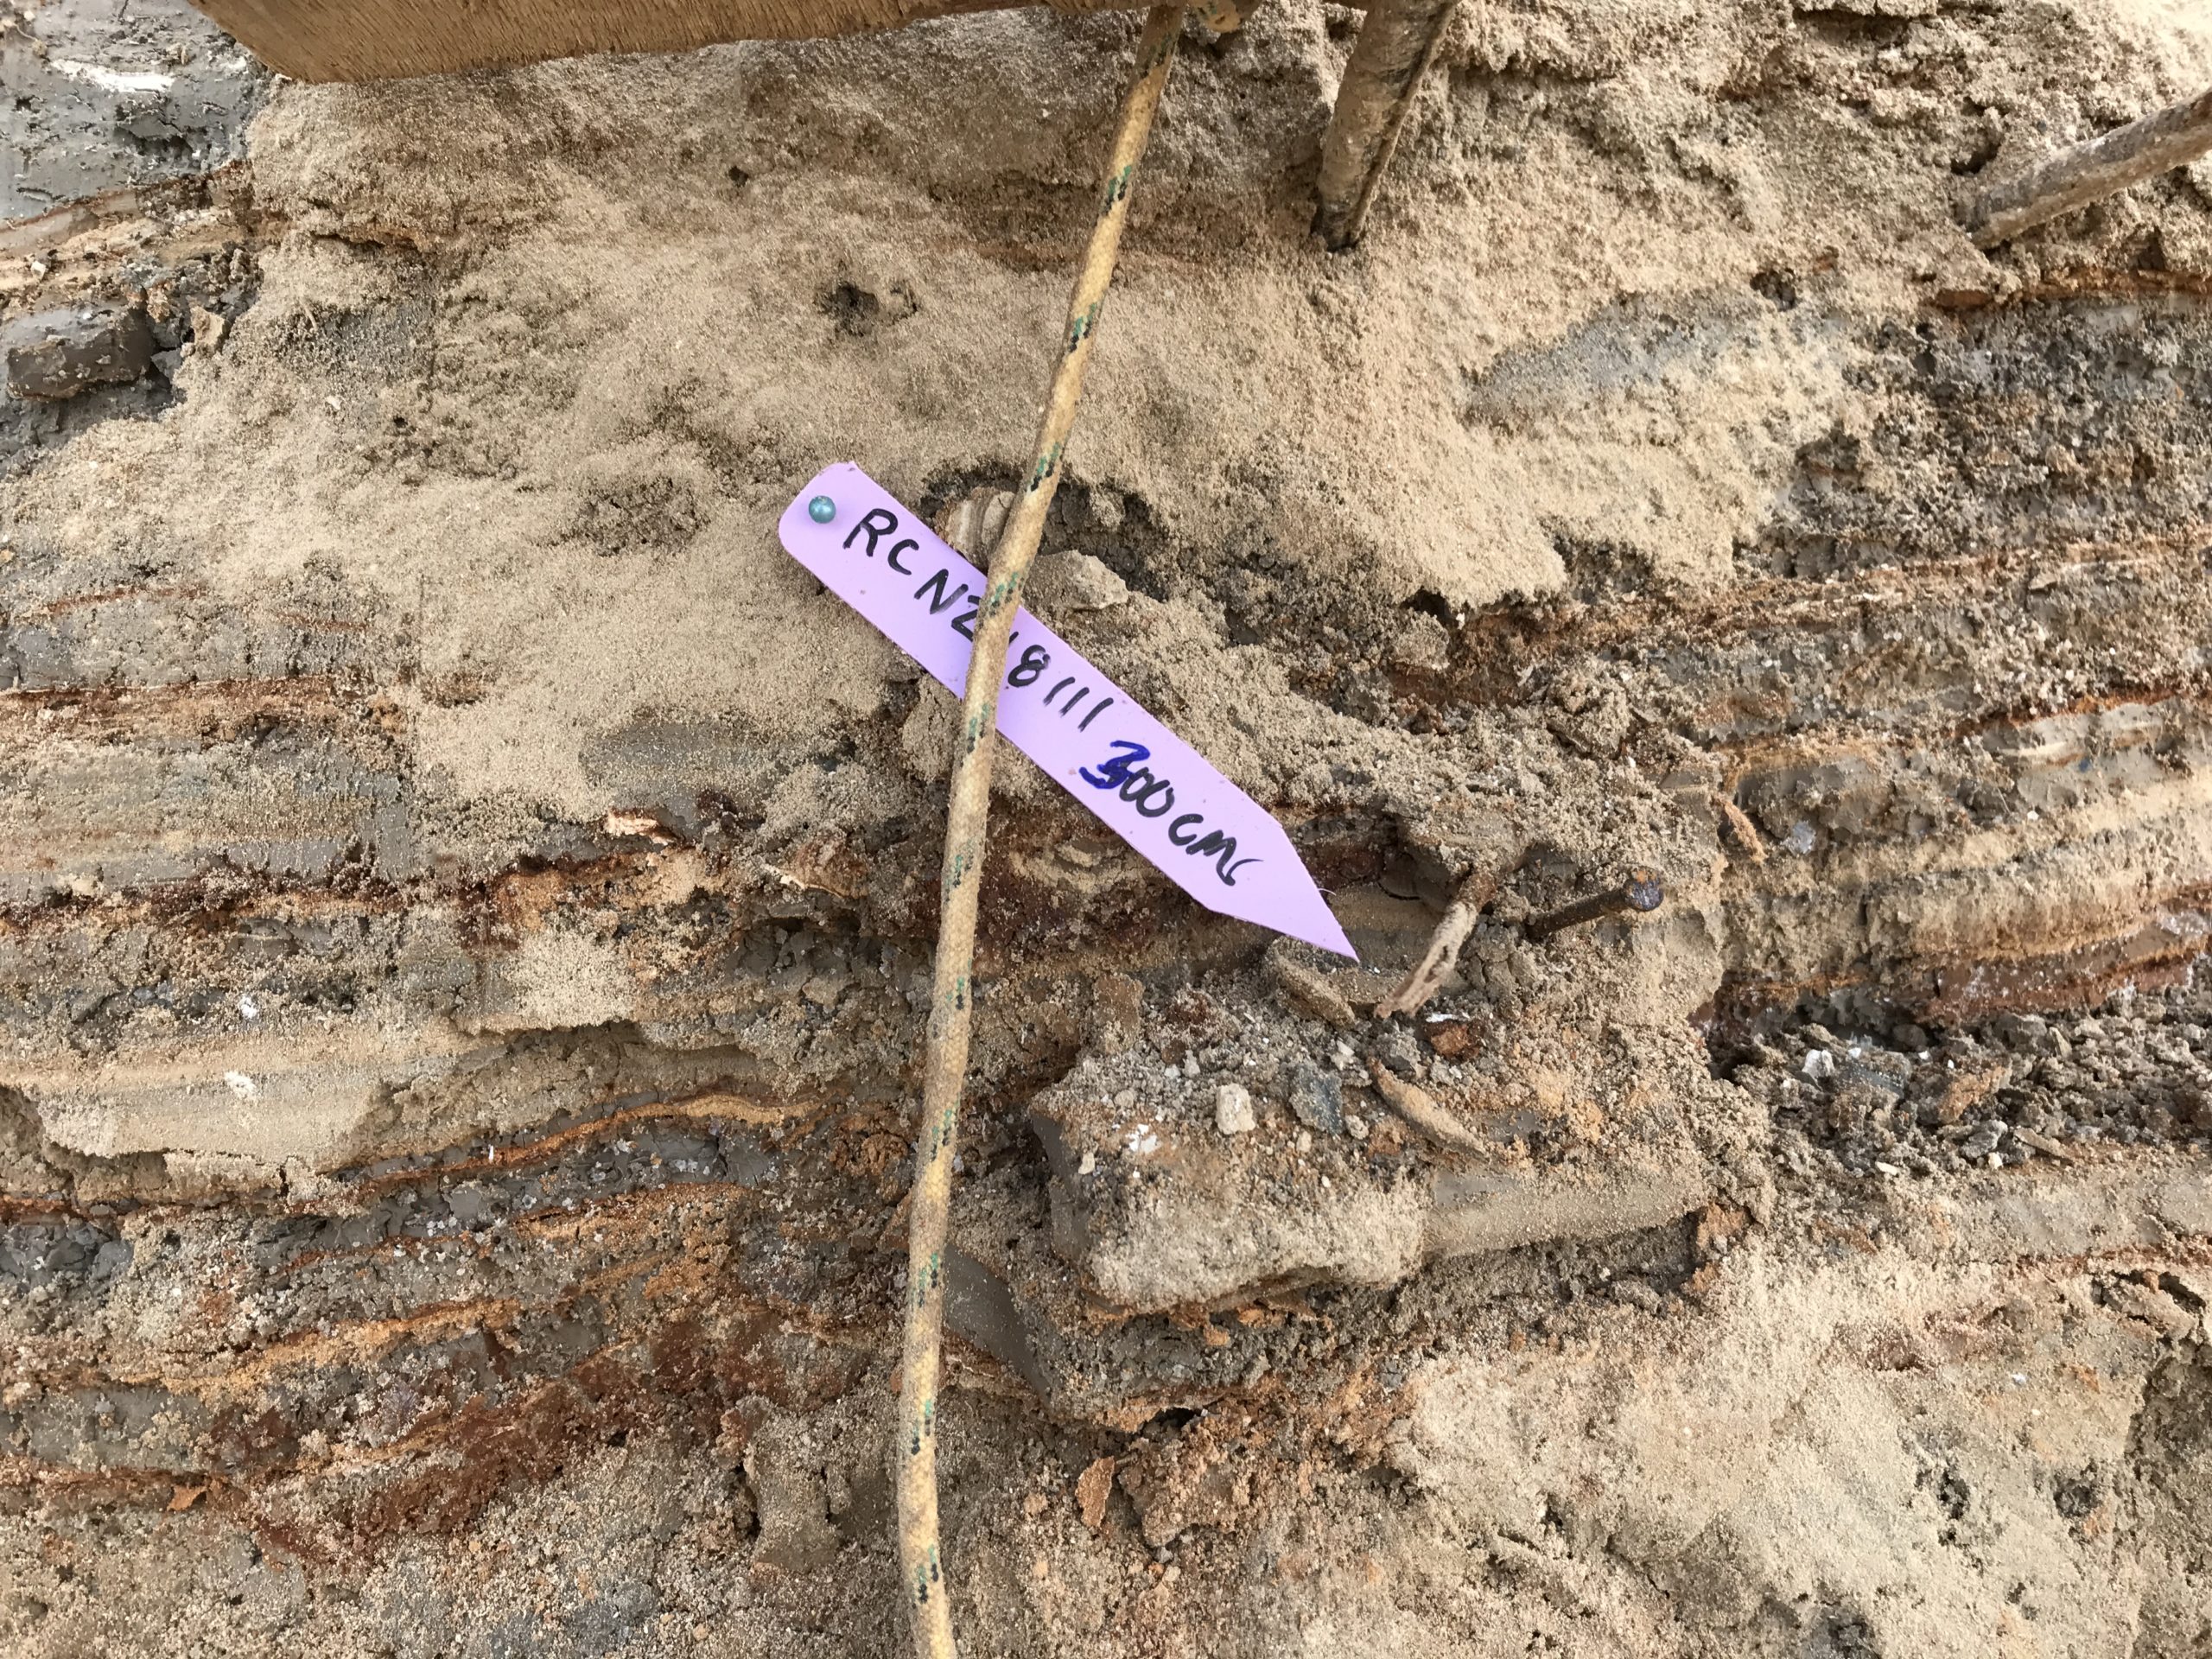 Radiocarbon Sample RCNZ18111 in situ
Click on photo to open magnifiable image in a new tab Photo by Jefferson Williams 2018 |
JW : Huge Twig, Lab: Charcoal - not in seismite | 300 | 1918 | 27 | |
| RCNZ18034 |
 Radiocarbon Sample RCNZ18034 before being sent to the lab
Click on photo to open magnifiable image in a new tab Photo by Jefferson Williams |
JW : Big Twig looks old - no field photo, Lab: Wood - not in seismite | 315 | 1845 | 32 | |
| RCNZ18032 |
Radiocarbon Sample RCNZ18032 in situ Click on photo to open magnifiable image in a new tab Photo by Jefferson Williams 2018 |
JW : nice twig, Lab: Charcoal - not in seismite | 340 | 2033 | 27 | |
| RCNZ18020 |
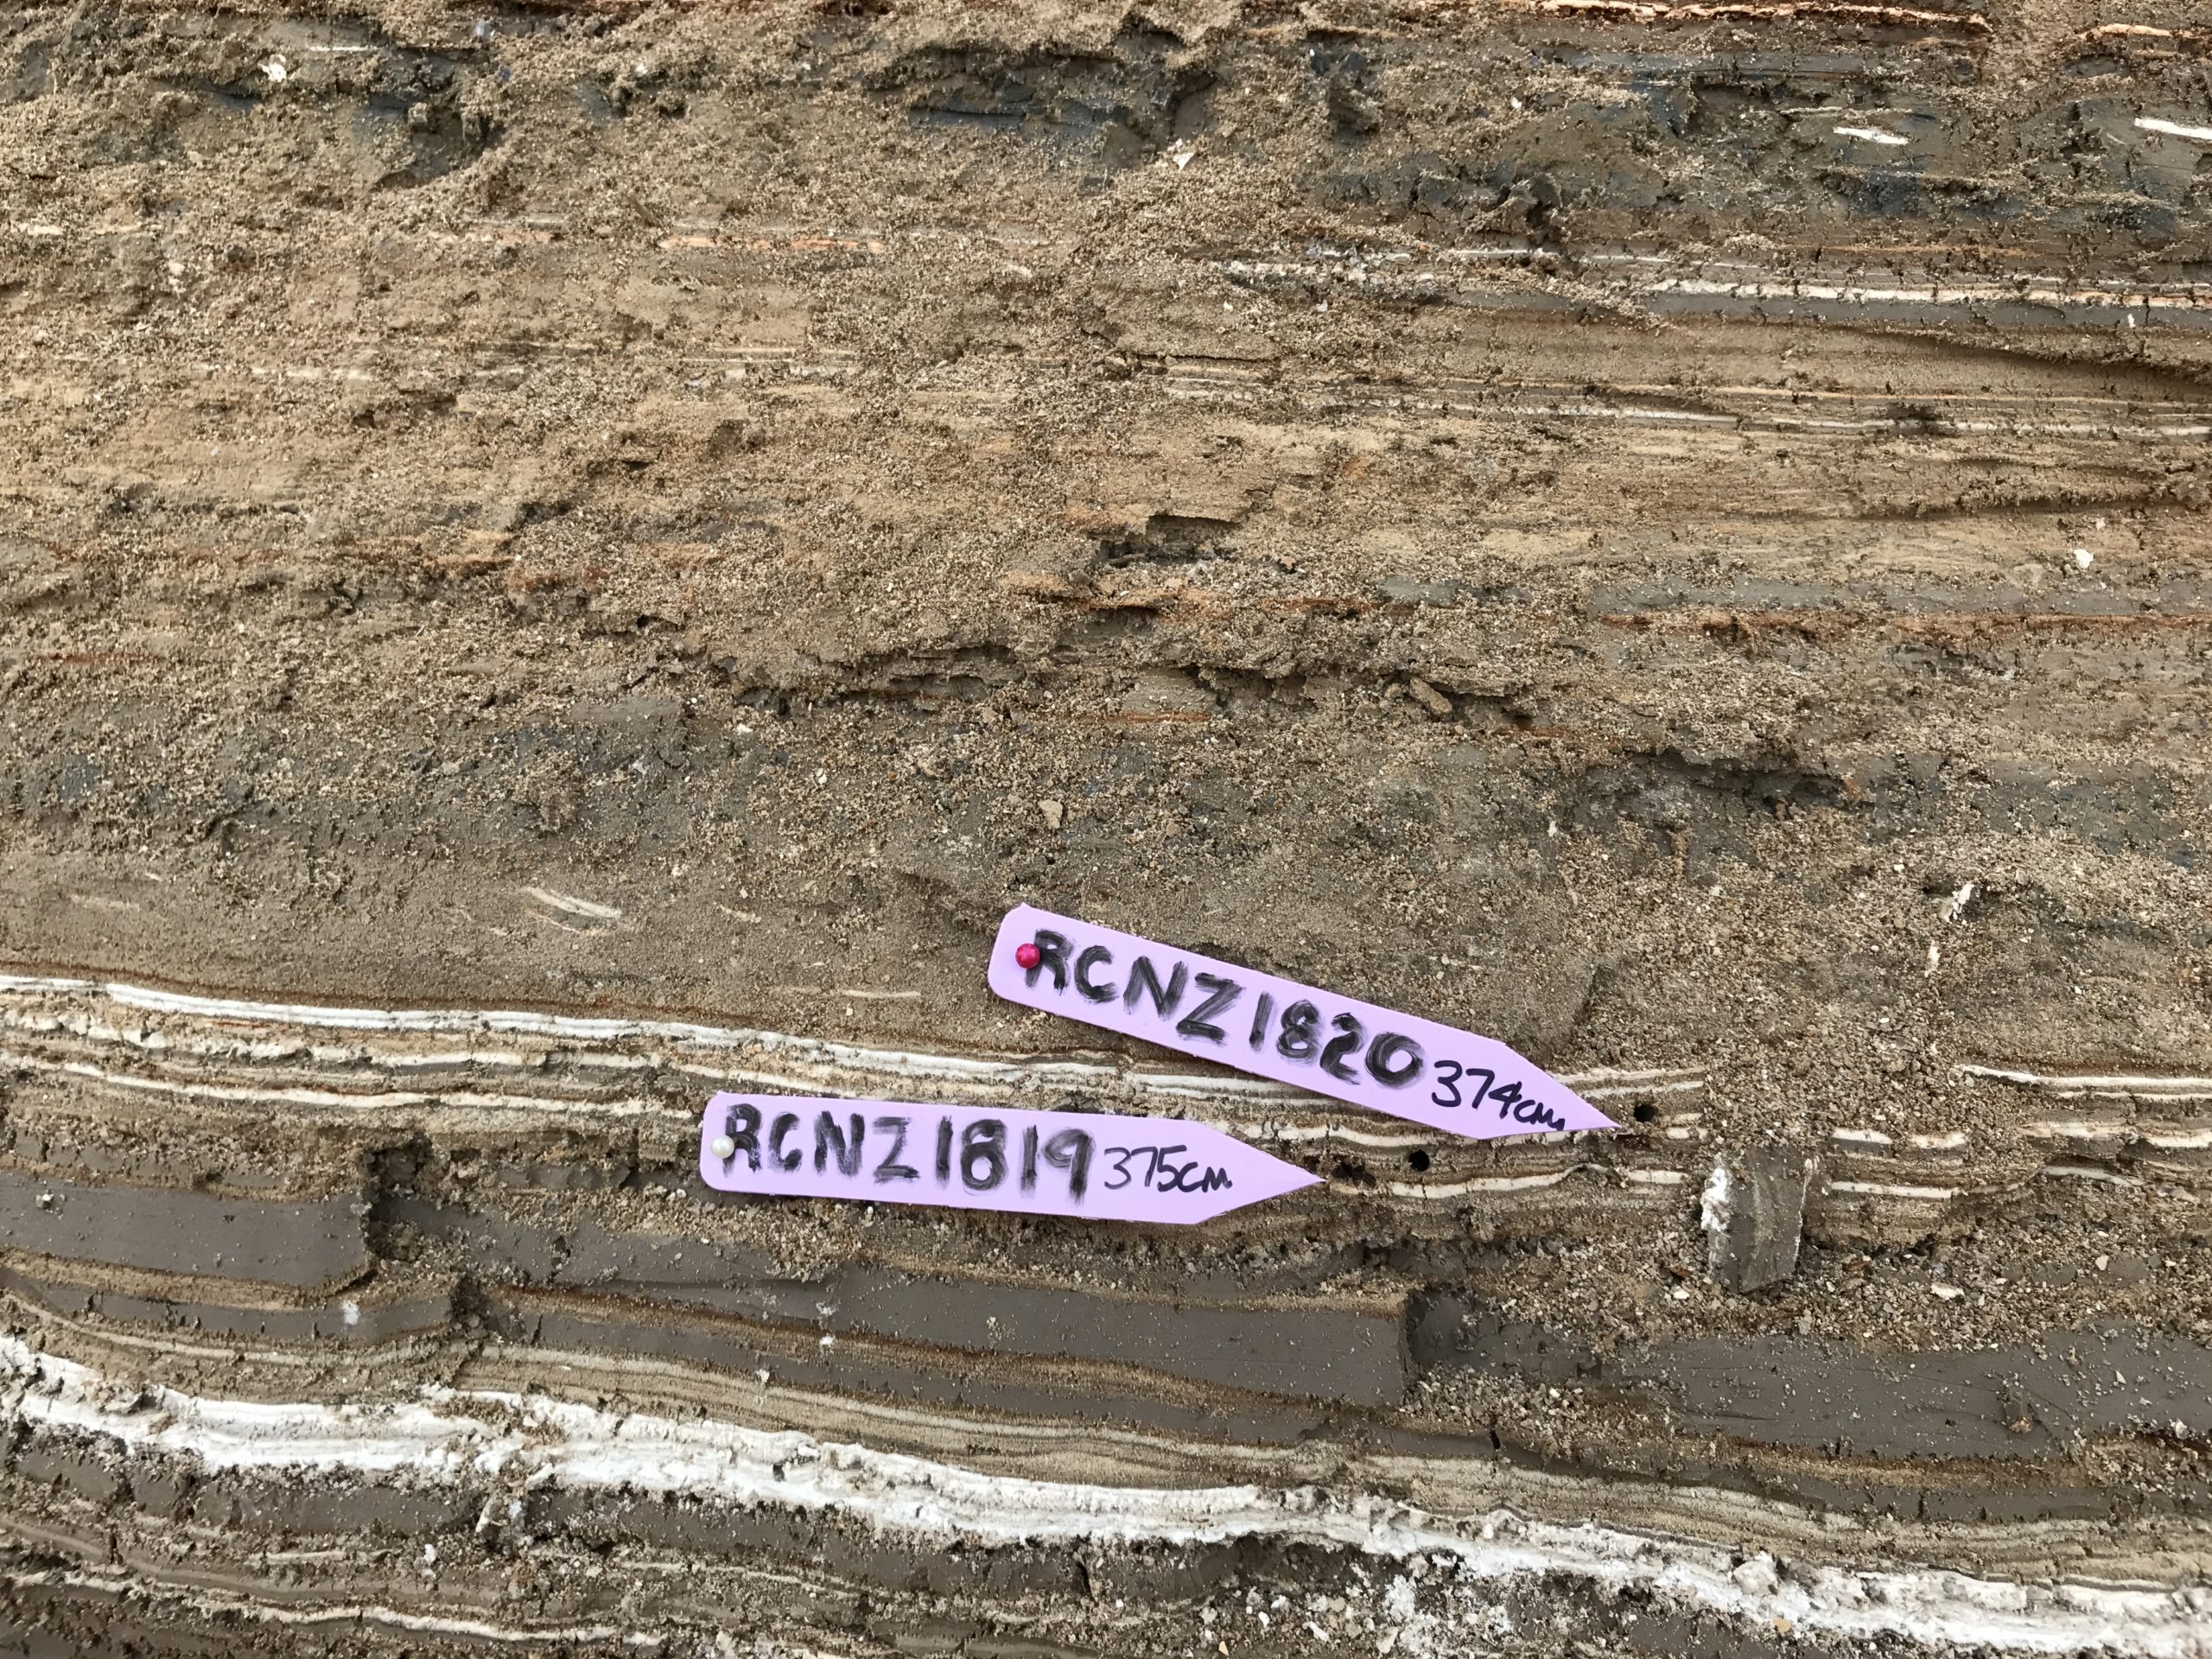 Radiocarbon Sample RCNZ18020 in situ
Click on photo to open magnifiable image in a new tab Photo by Jefferson Williams 2018 |
JW : Big poss. recent, Lab: Charcoal - not in seismite | 374 | 2144 | 39 | |
| RCNZ18013 |
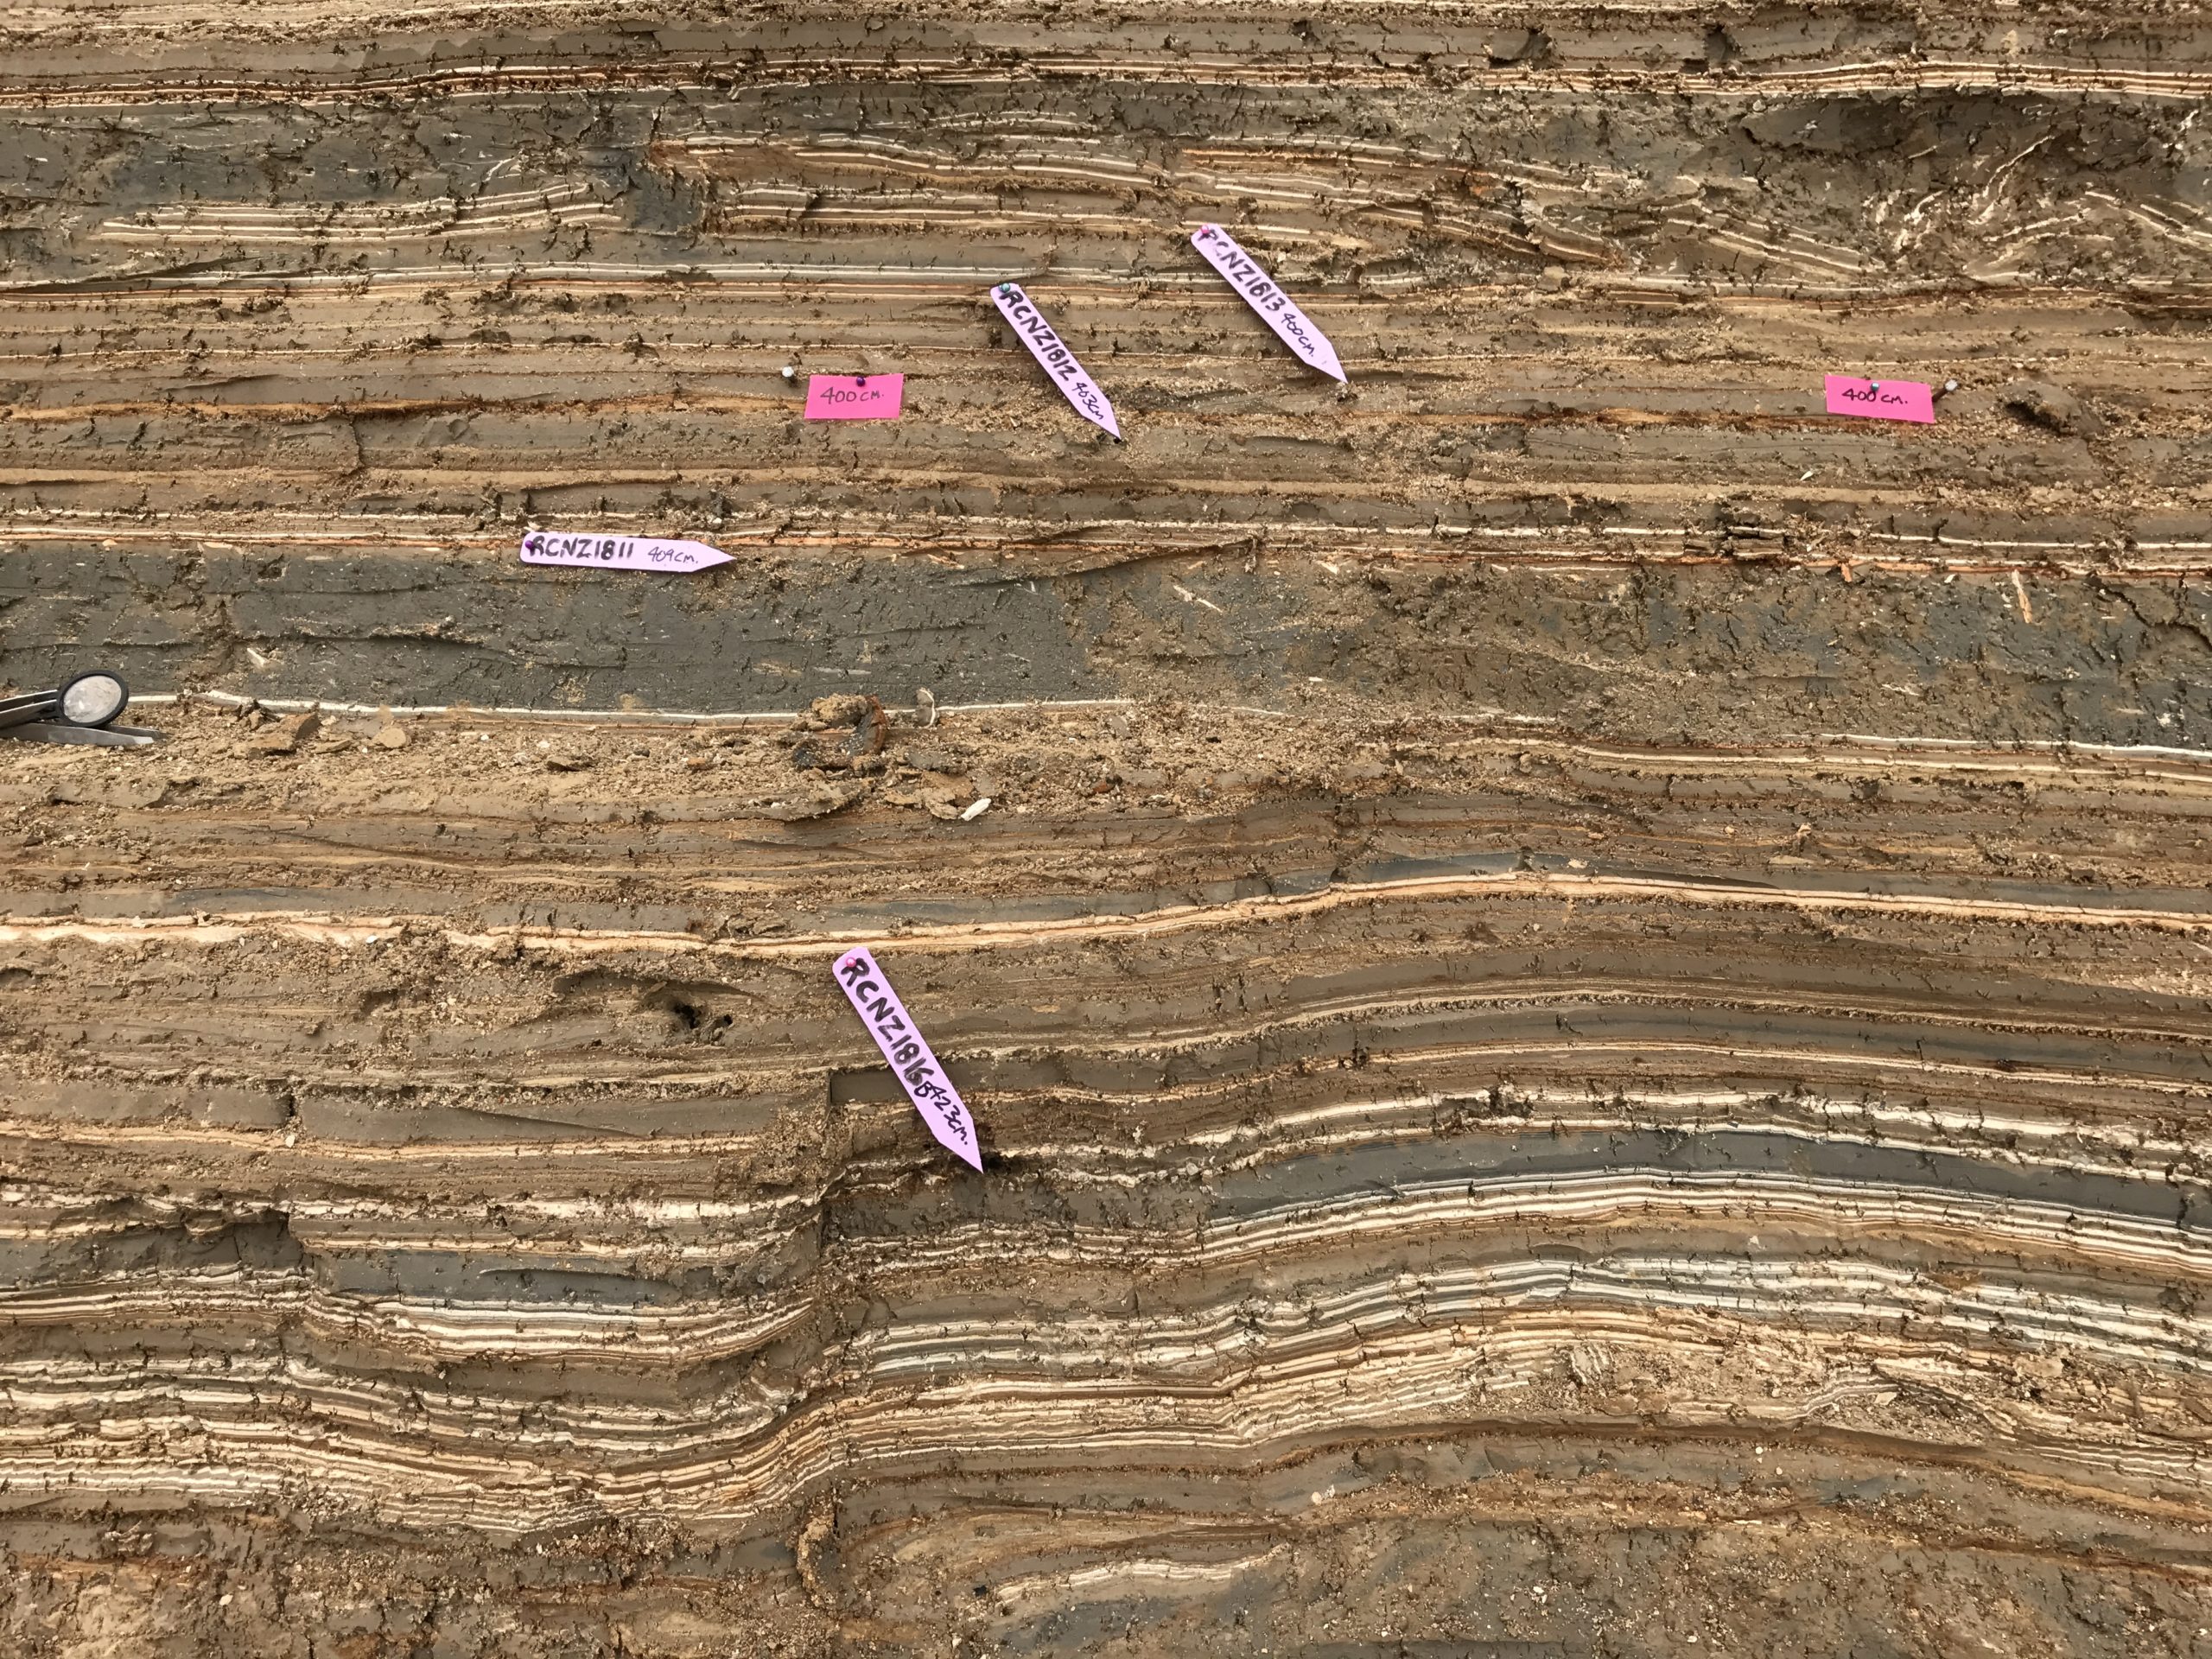 Radiocarbon Sample RCNZ18013 in situ
Click on photo to open magnifiable image in a new tab Photo by Jefferson Williams 2018 |
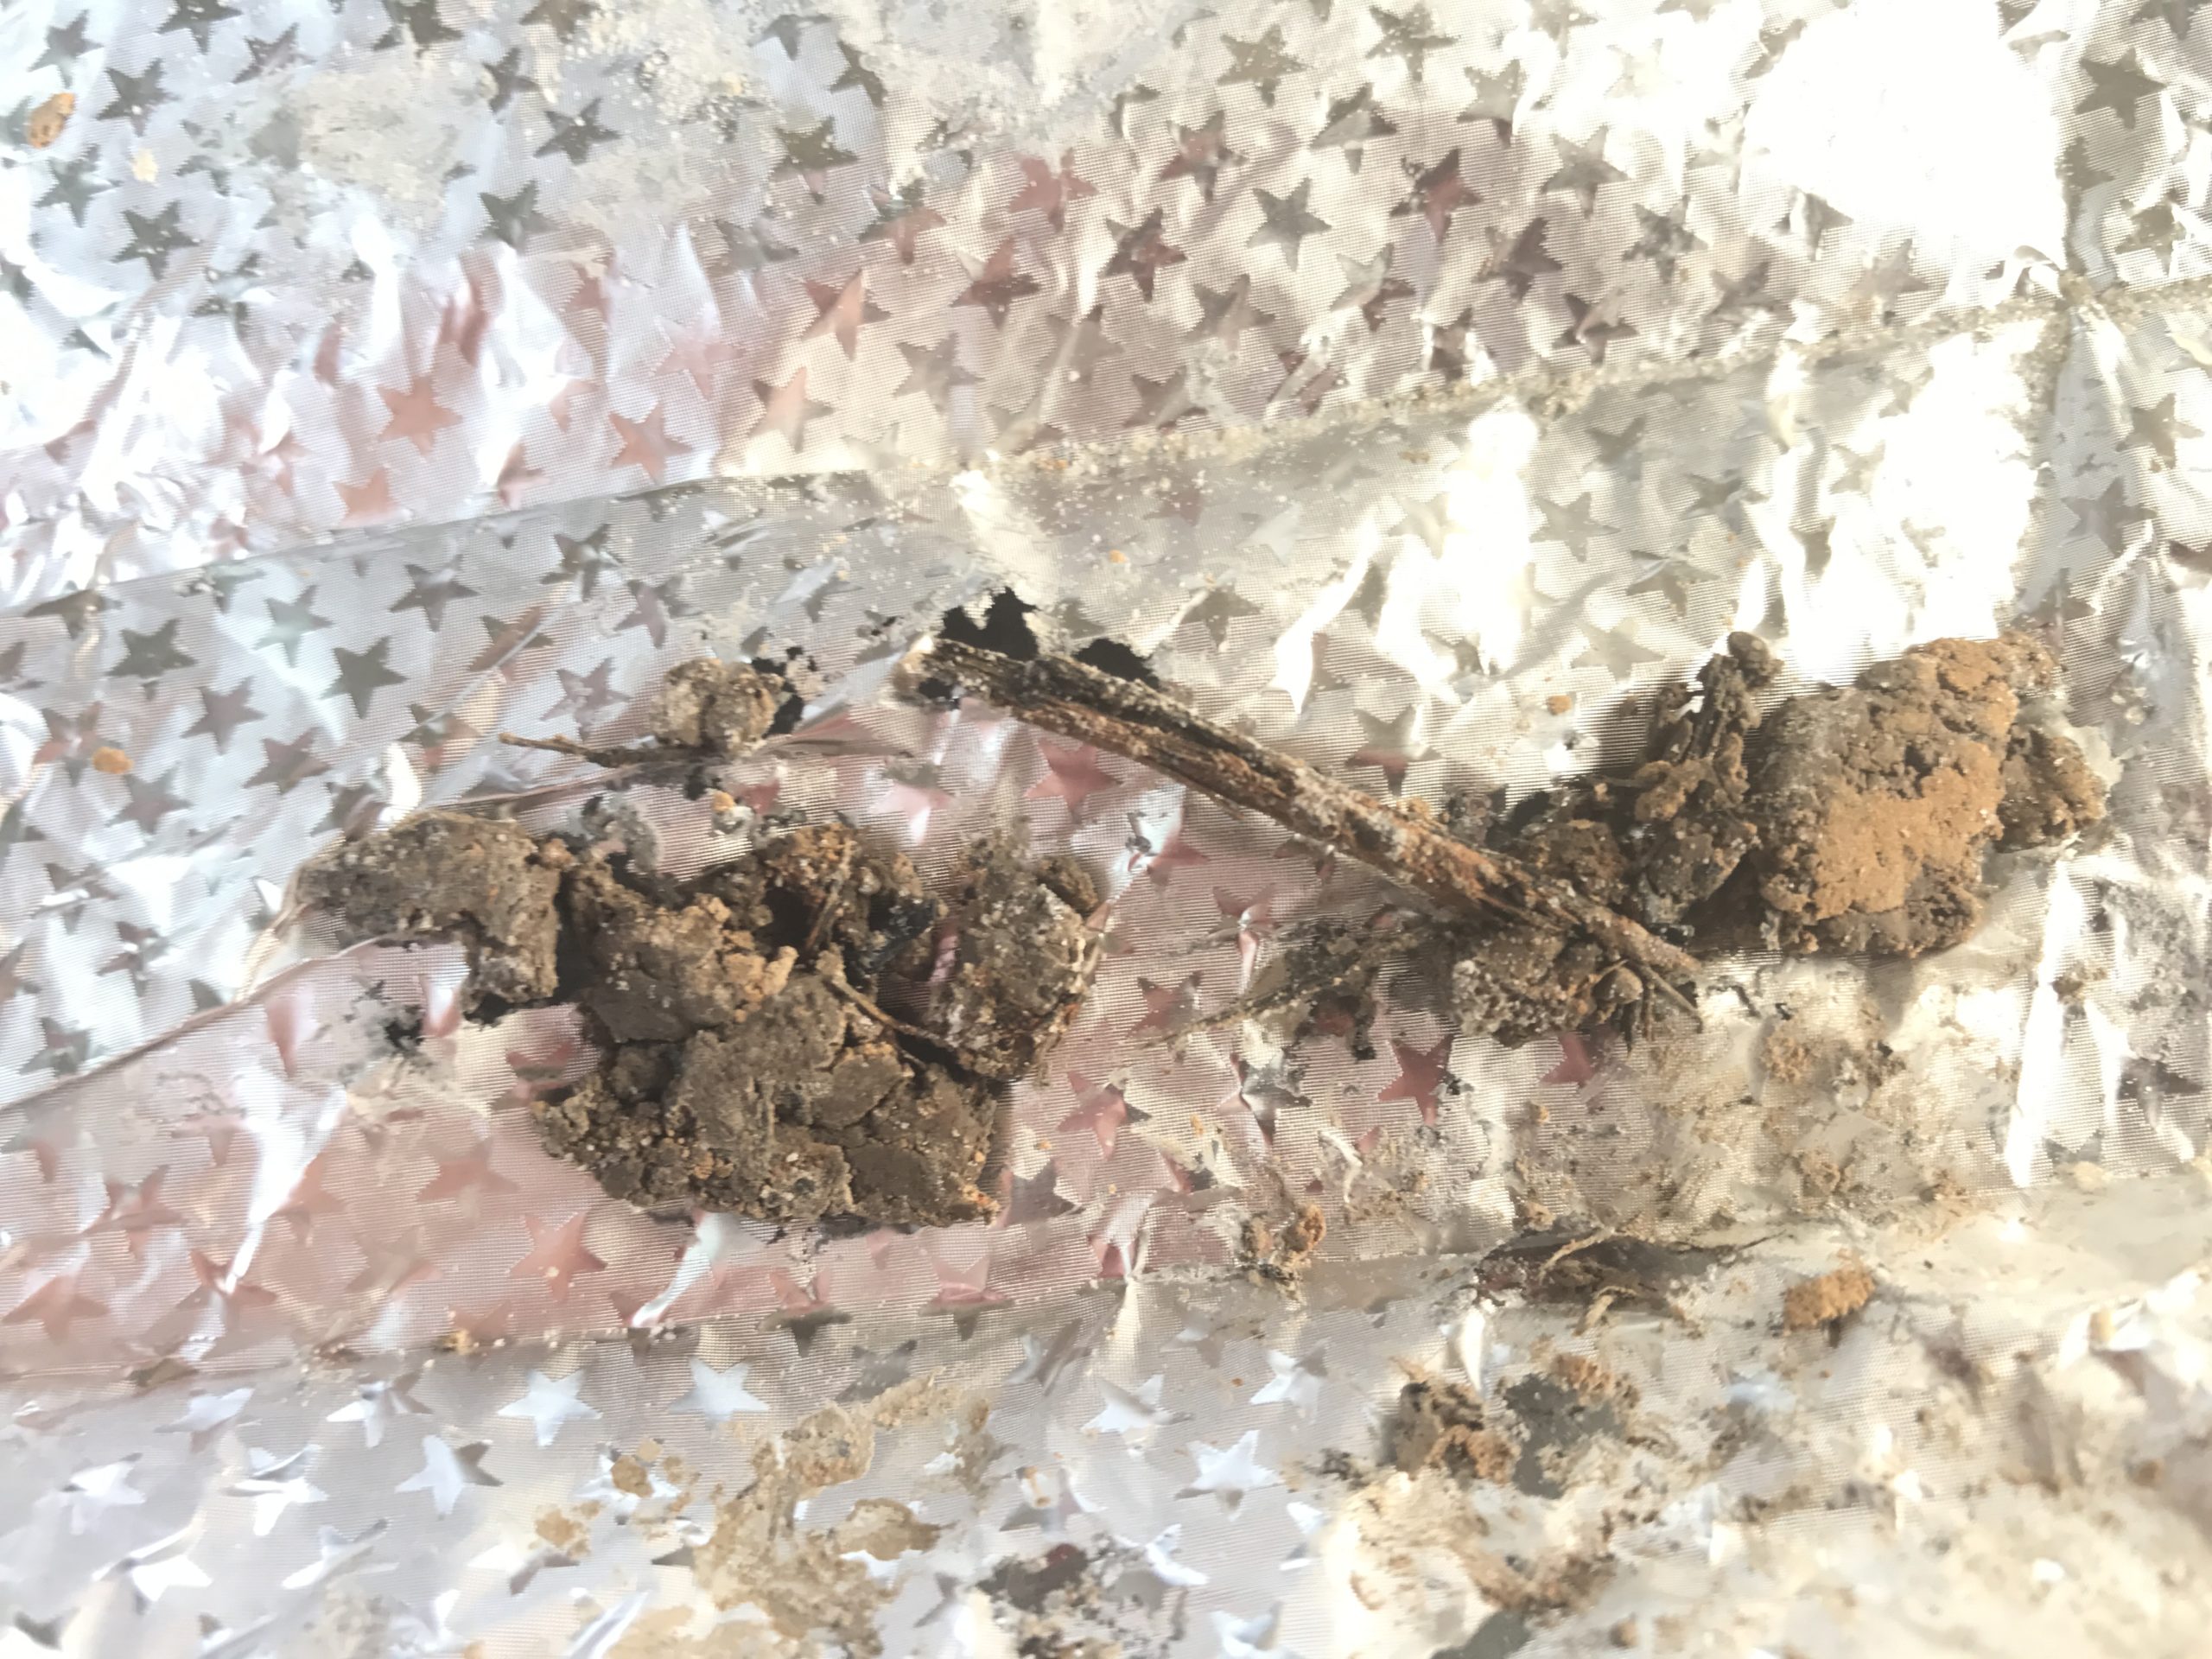 Radiocarbon Sample RCNZ18013 before being sent to the lab
Click on photo to open magnifiable image in a new tab Photo by Jefferson Williams |
JW : Twig - some burning, Lab: Wood - not in seismite | 400 | 1781 | 33 |
| RCNZ18016B |
Radiocarbon Sample RCNZ18016B in situ Click on photo to open magnifiable image in a new tab Photo by Jefferson Williams 2018 |
 Radiocarbon Sample RCNZ18016B before being sent to the lab
Click on photo to open magnifiable image in a new tab Photo by Jefferson Williams |
JW : Twigs big Lab: Wood - not in seismite | 423 | 1996 | 25 |
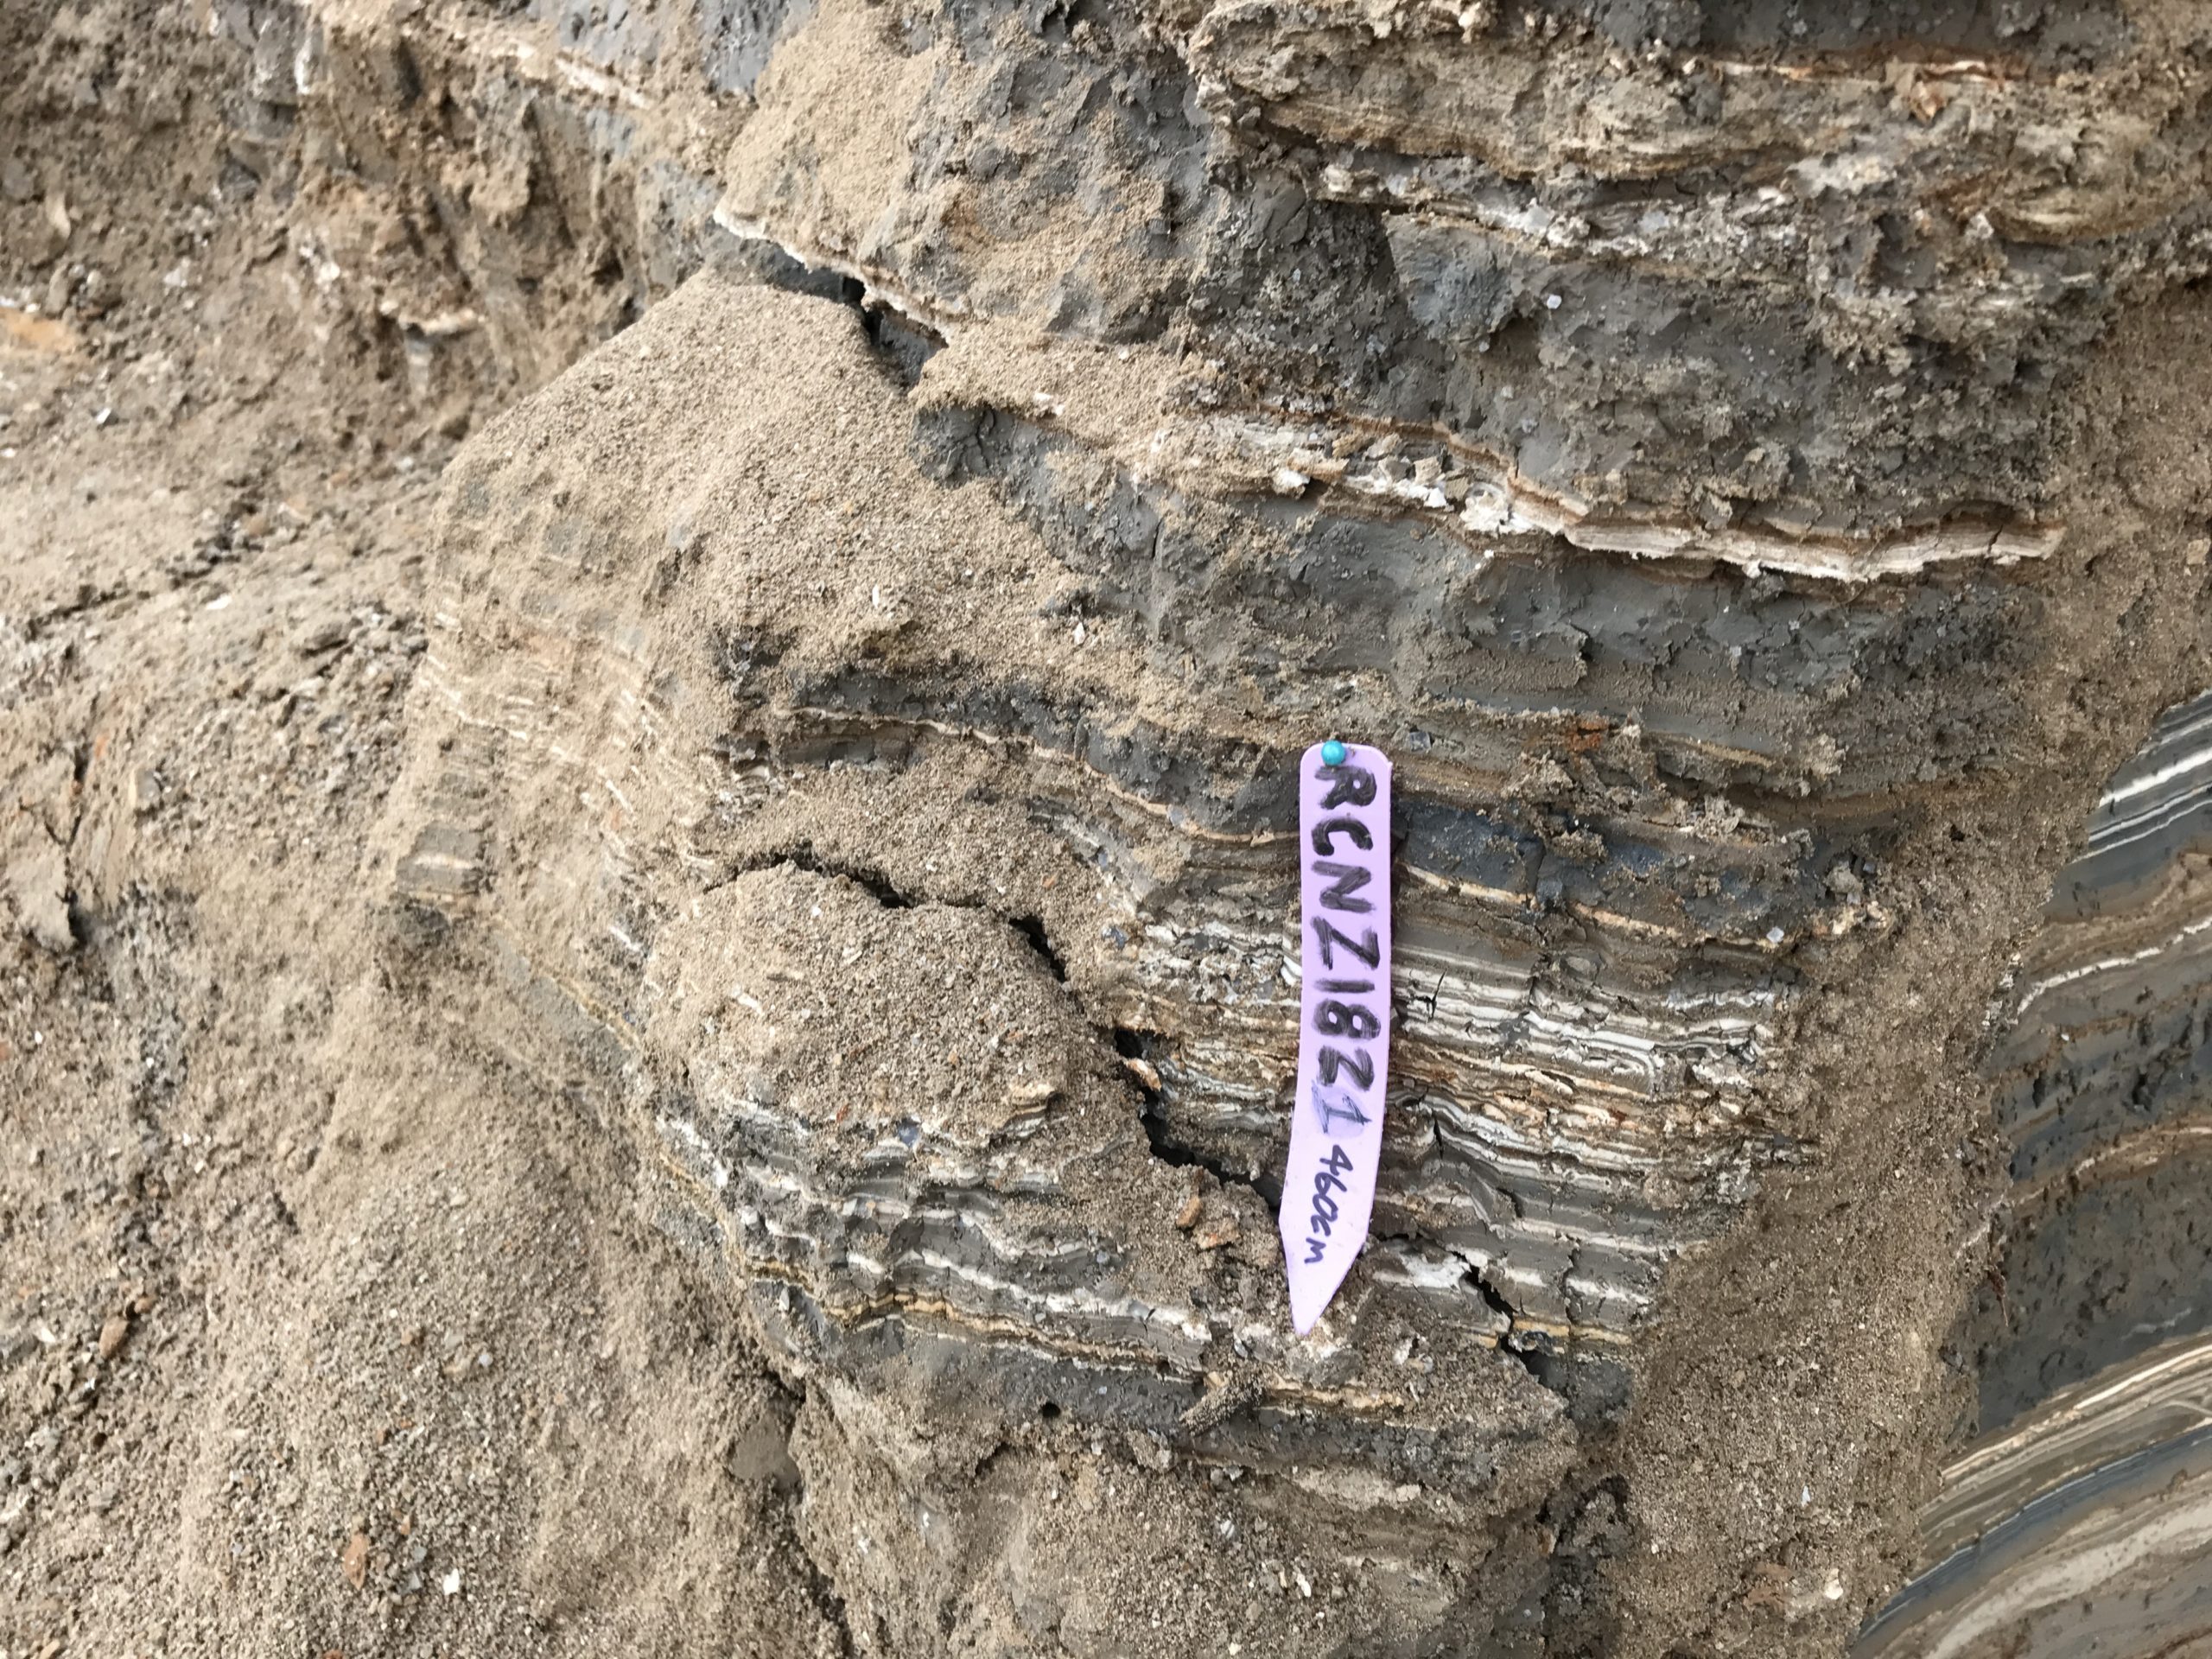
| RCNZ18125 |
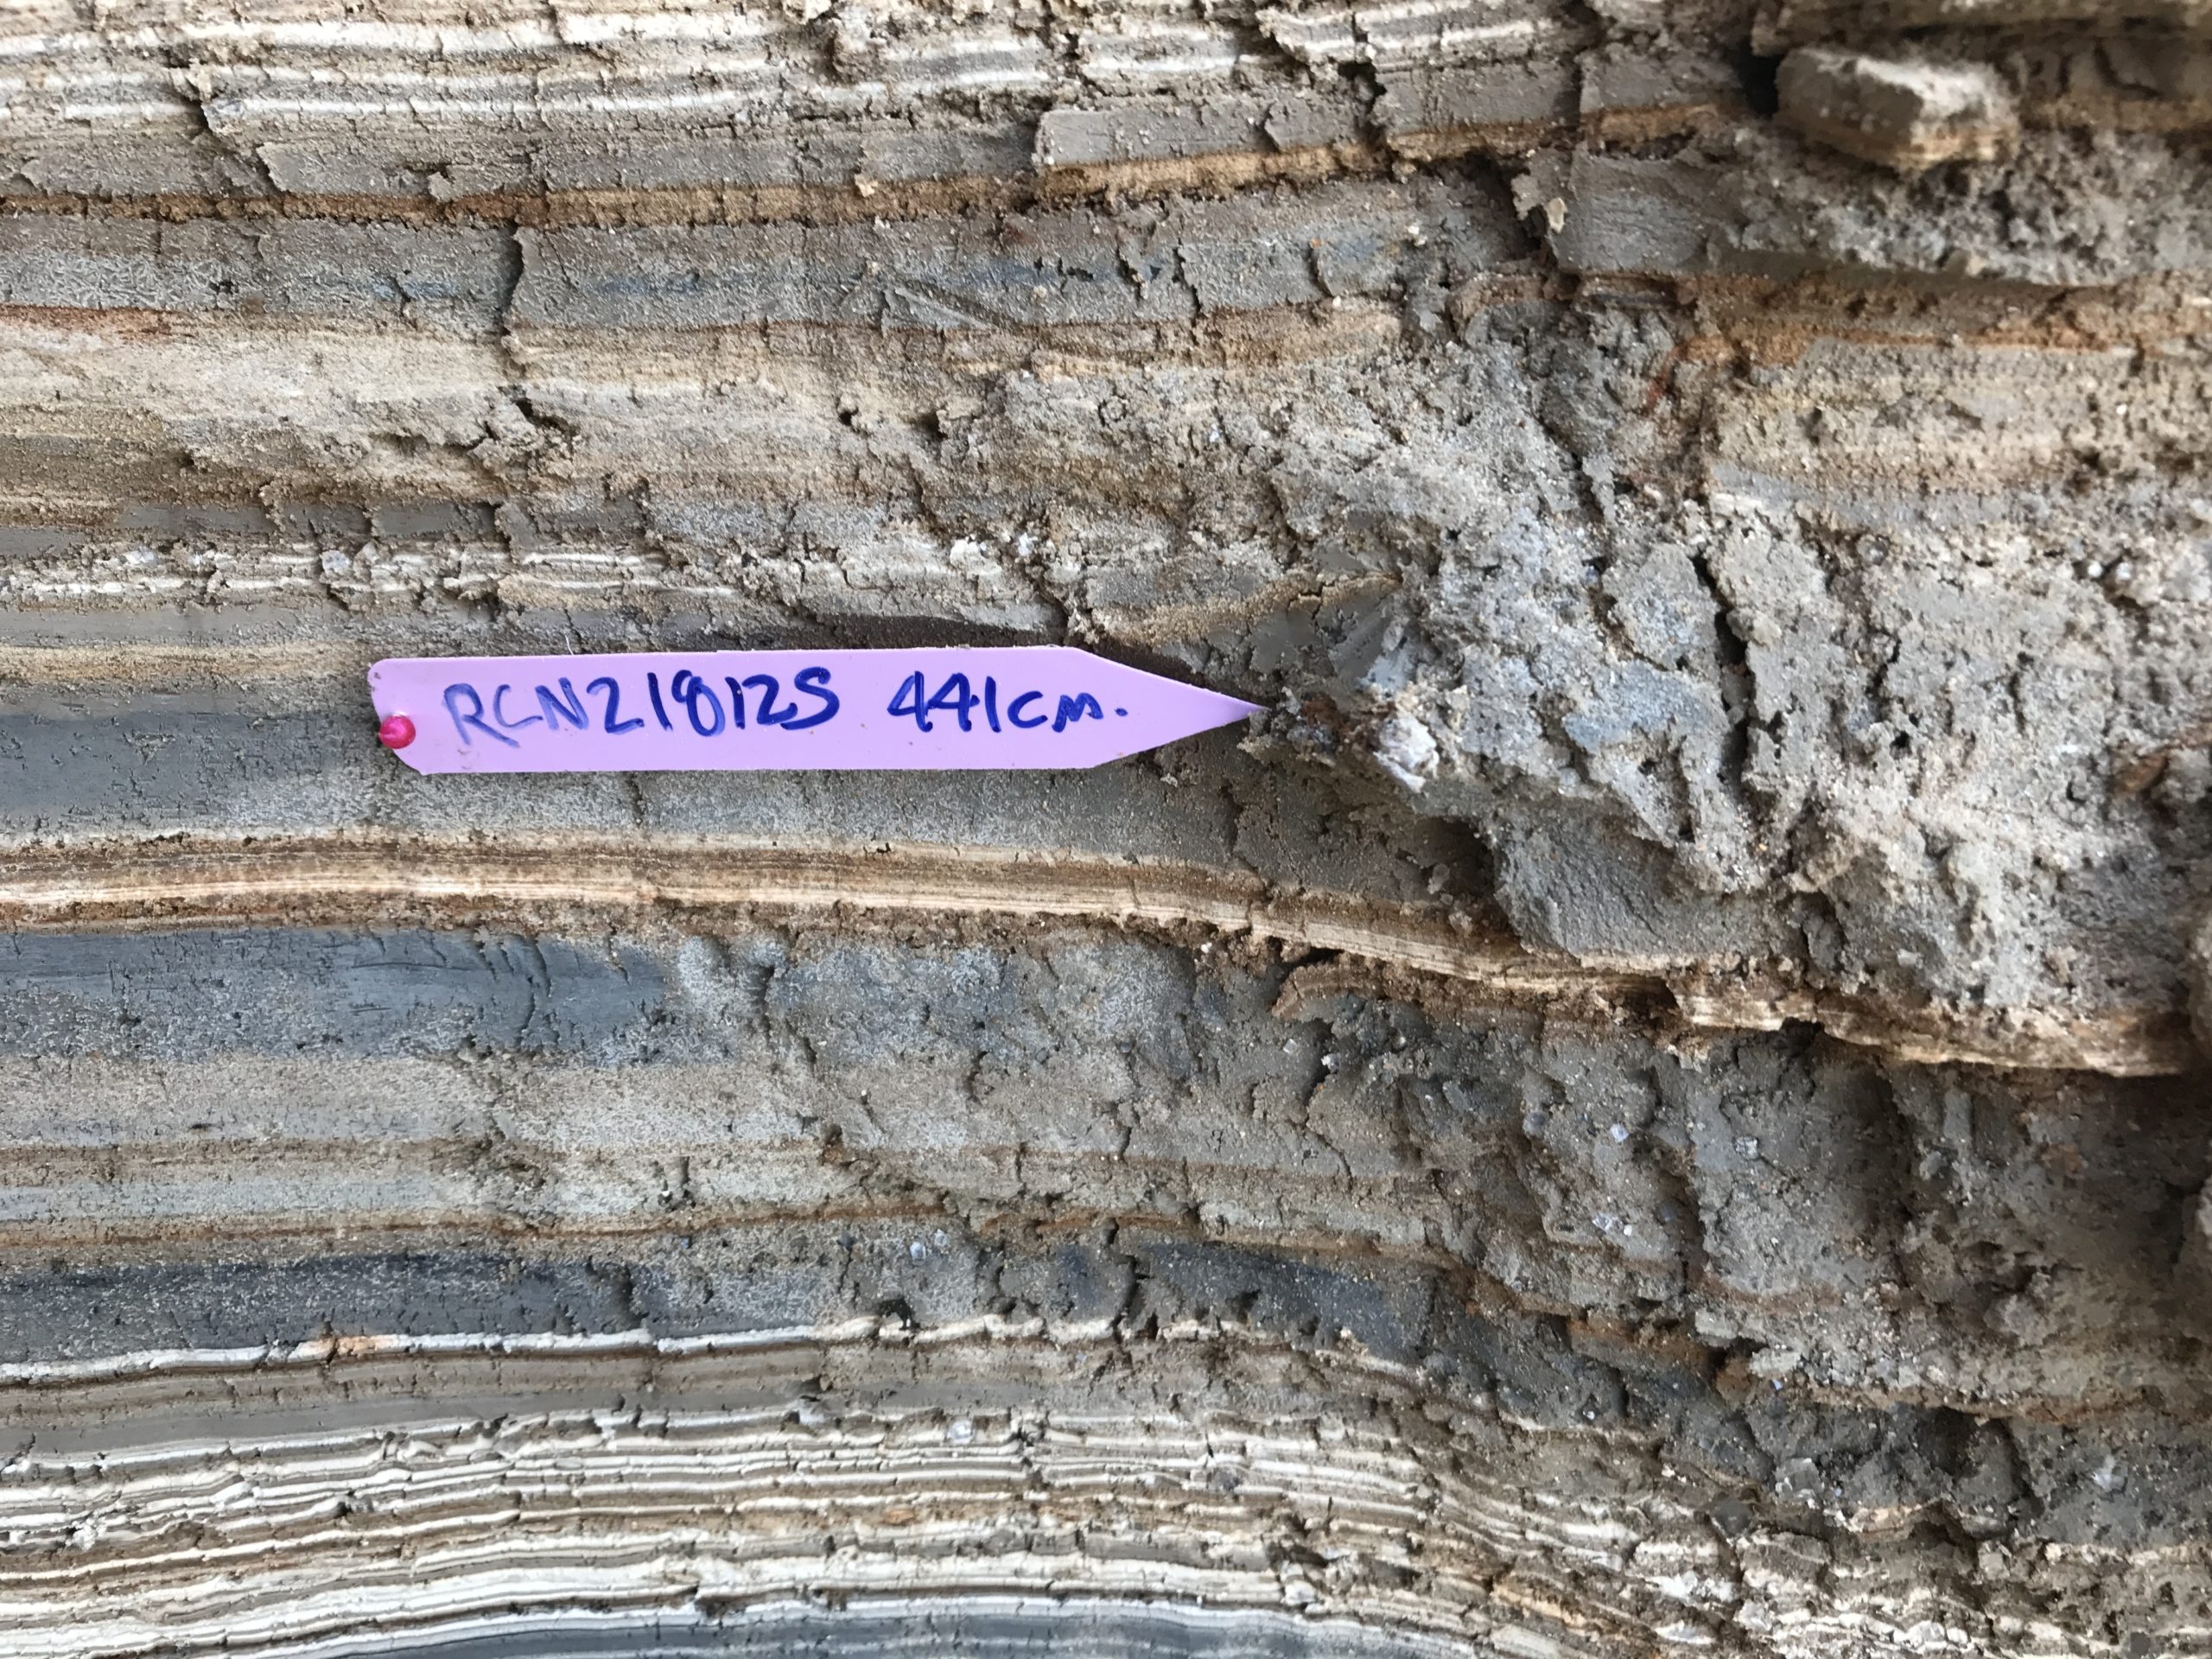 Radiocarbon Sample RCNZ18125 in situ
Click on photo to open magnifiable image in a new tab Photo by Jefferson Williams 2018 |
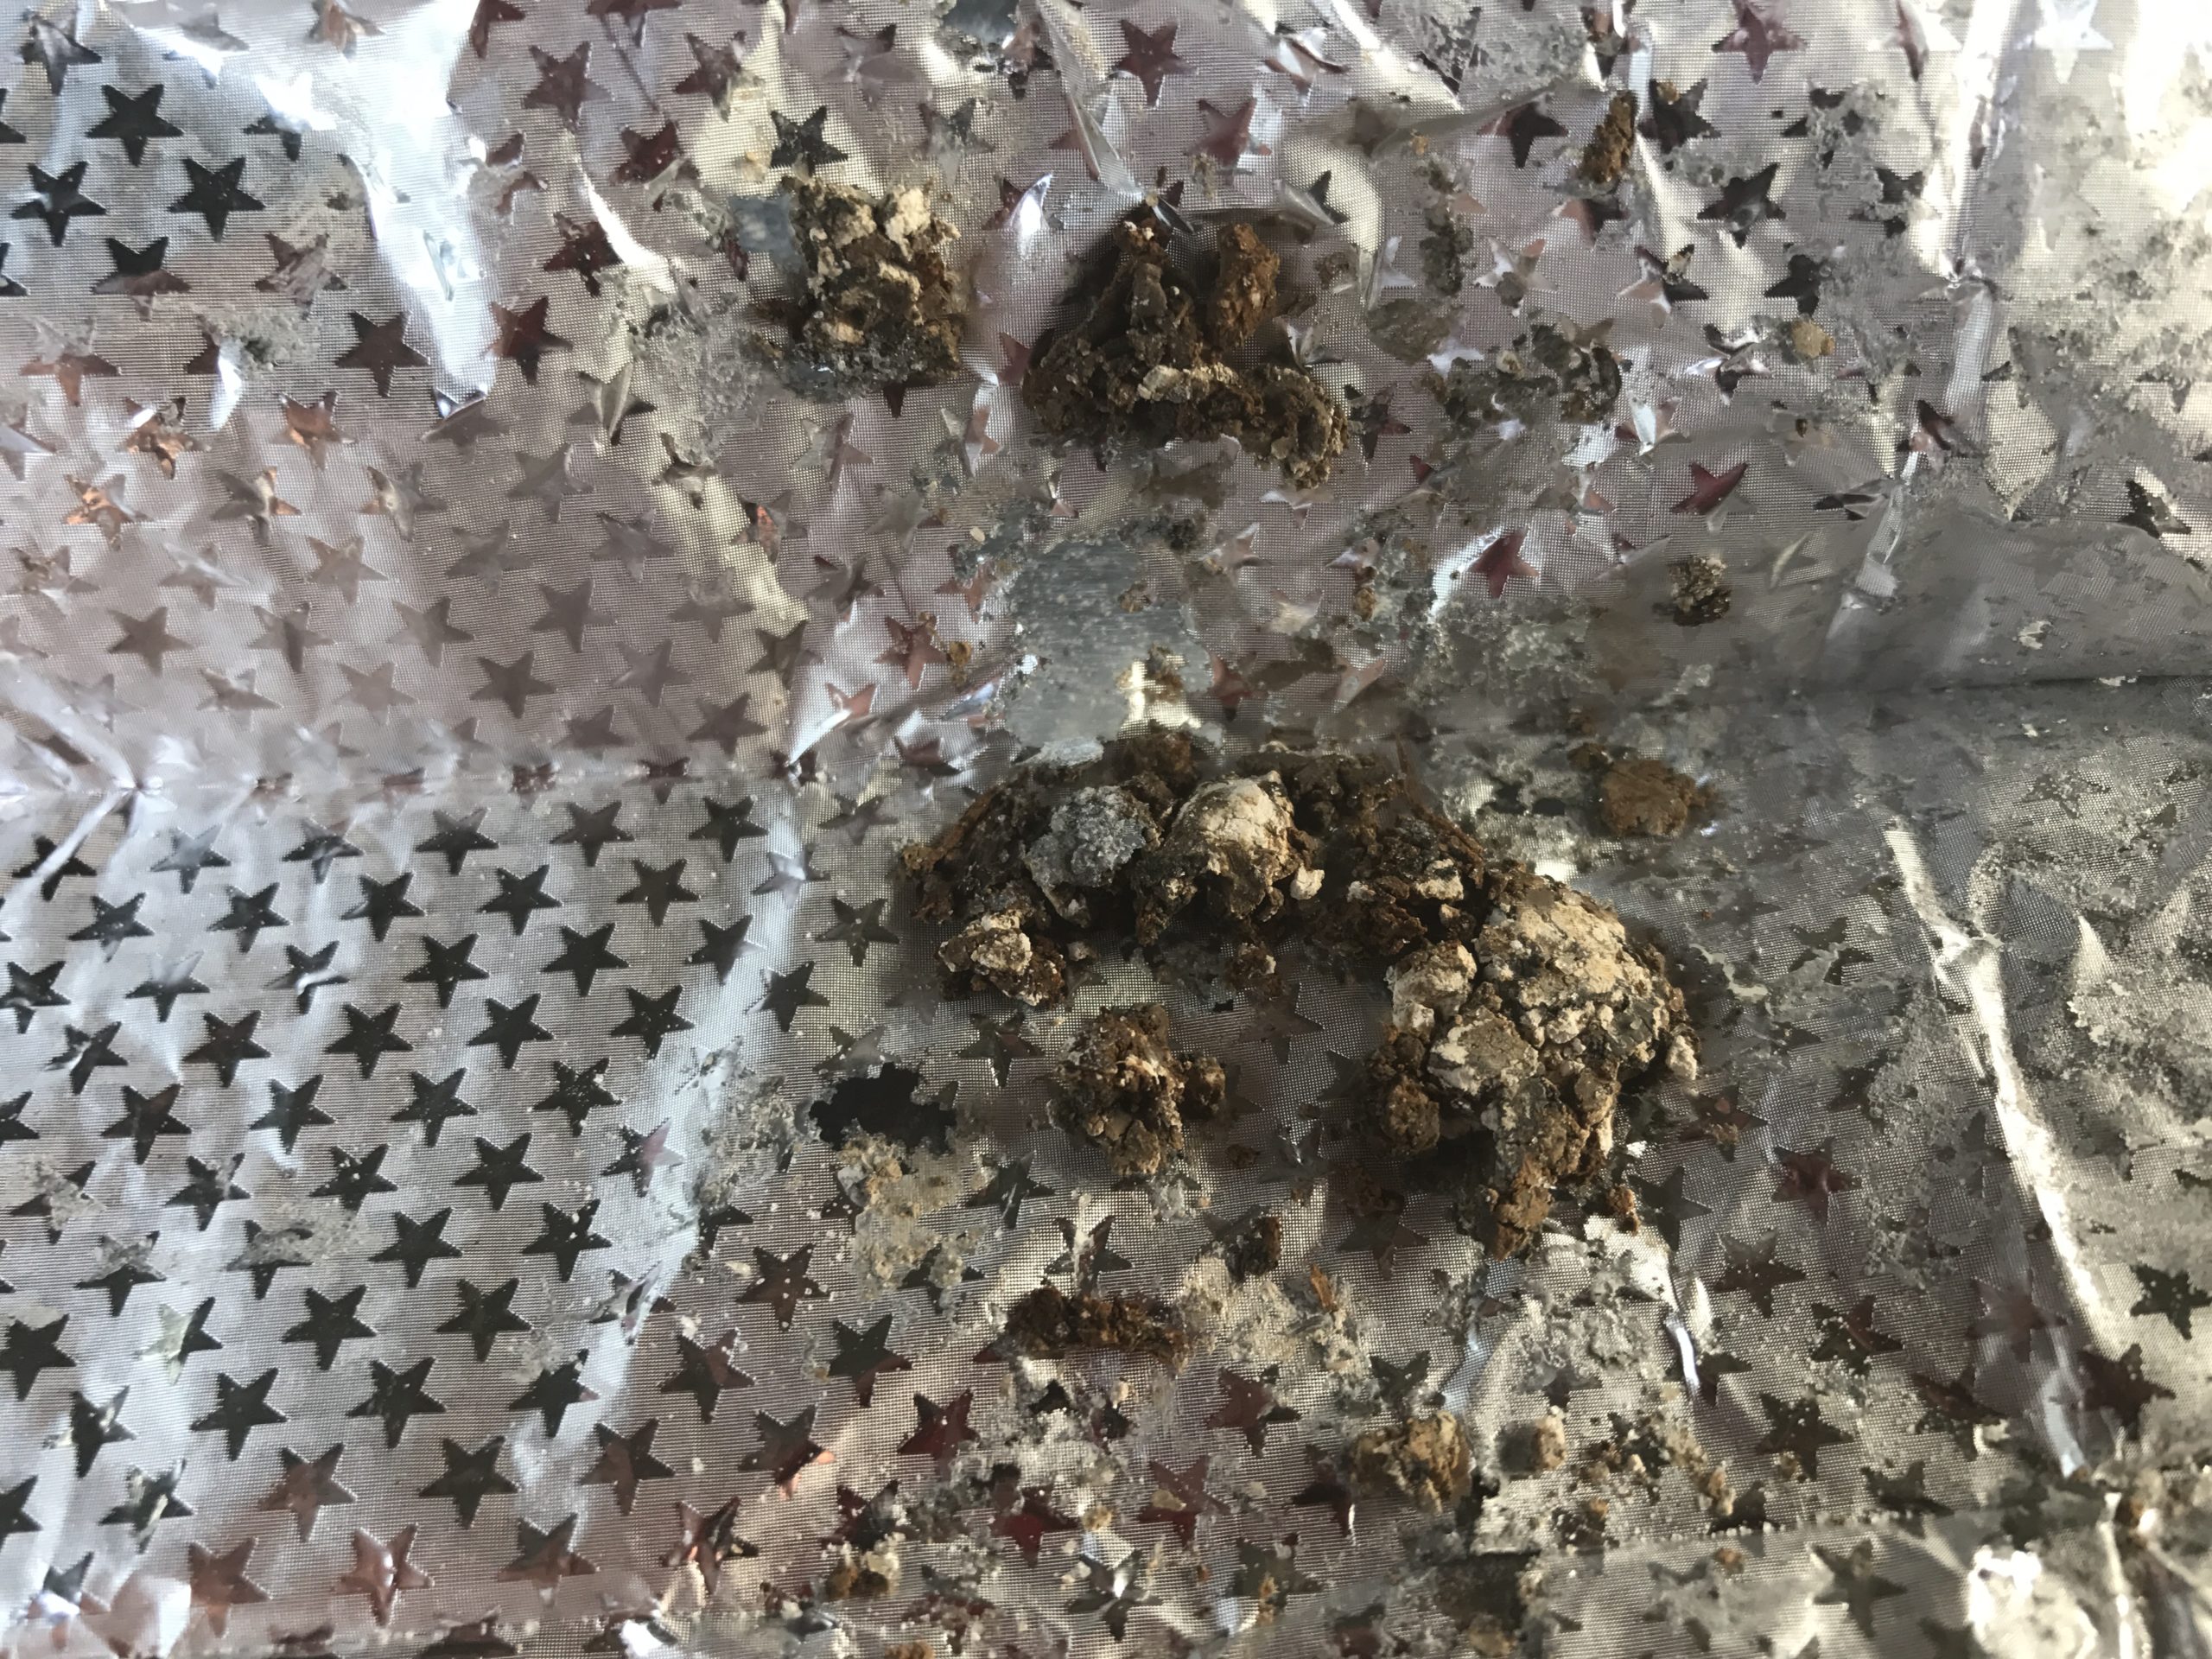
 Radiocarbon Sample RCNZ18125 before being sent to the lab
Click on photo to open magnifiable image in a new tab Photo by Jefferson Williams |
JW : Big Twig slightly burnt, Lab: Wood - not in seismite | 441 | 1998 | 36 |
| NZ_15_G |
 Radiocarbon Sample NZ_15_G in situ
Click on photo to open magnifiable image in a new tab Photo by Jefferson Williams 2015 |
JW : Middle Outcrop 450 mg, Lab: Charcoal - not in seismite | 449 | 2173 | 33 | |
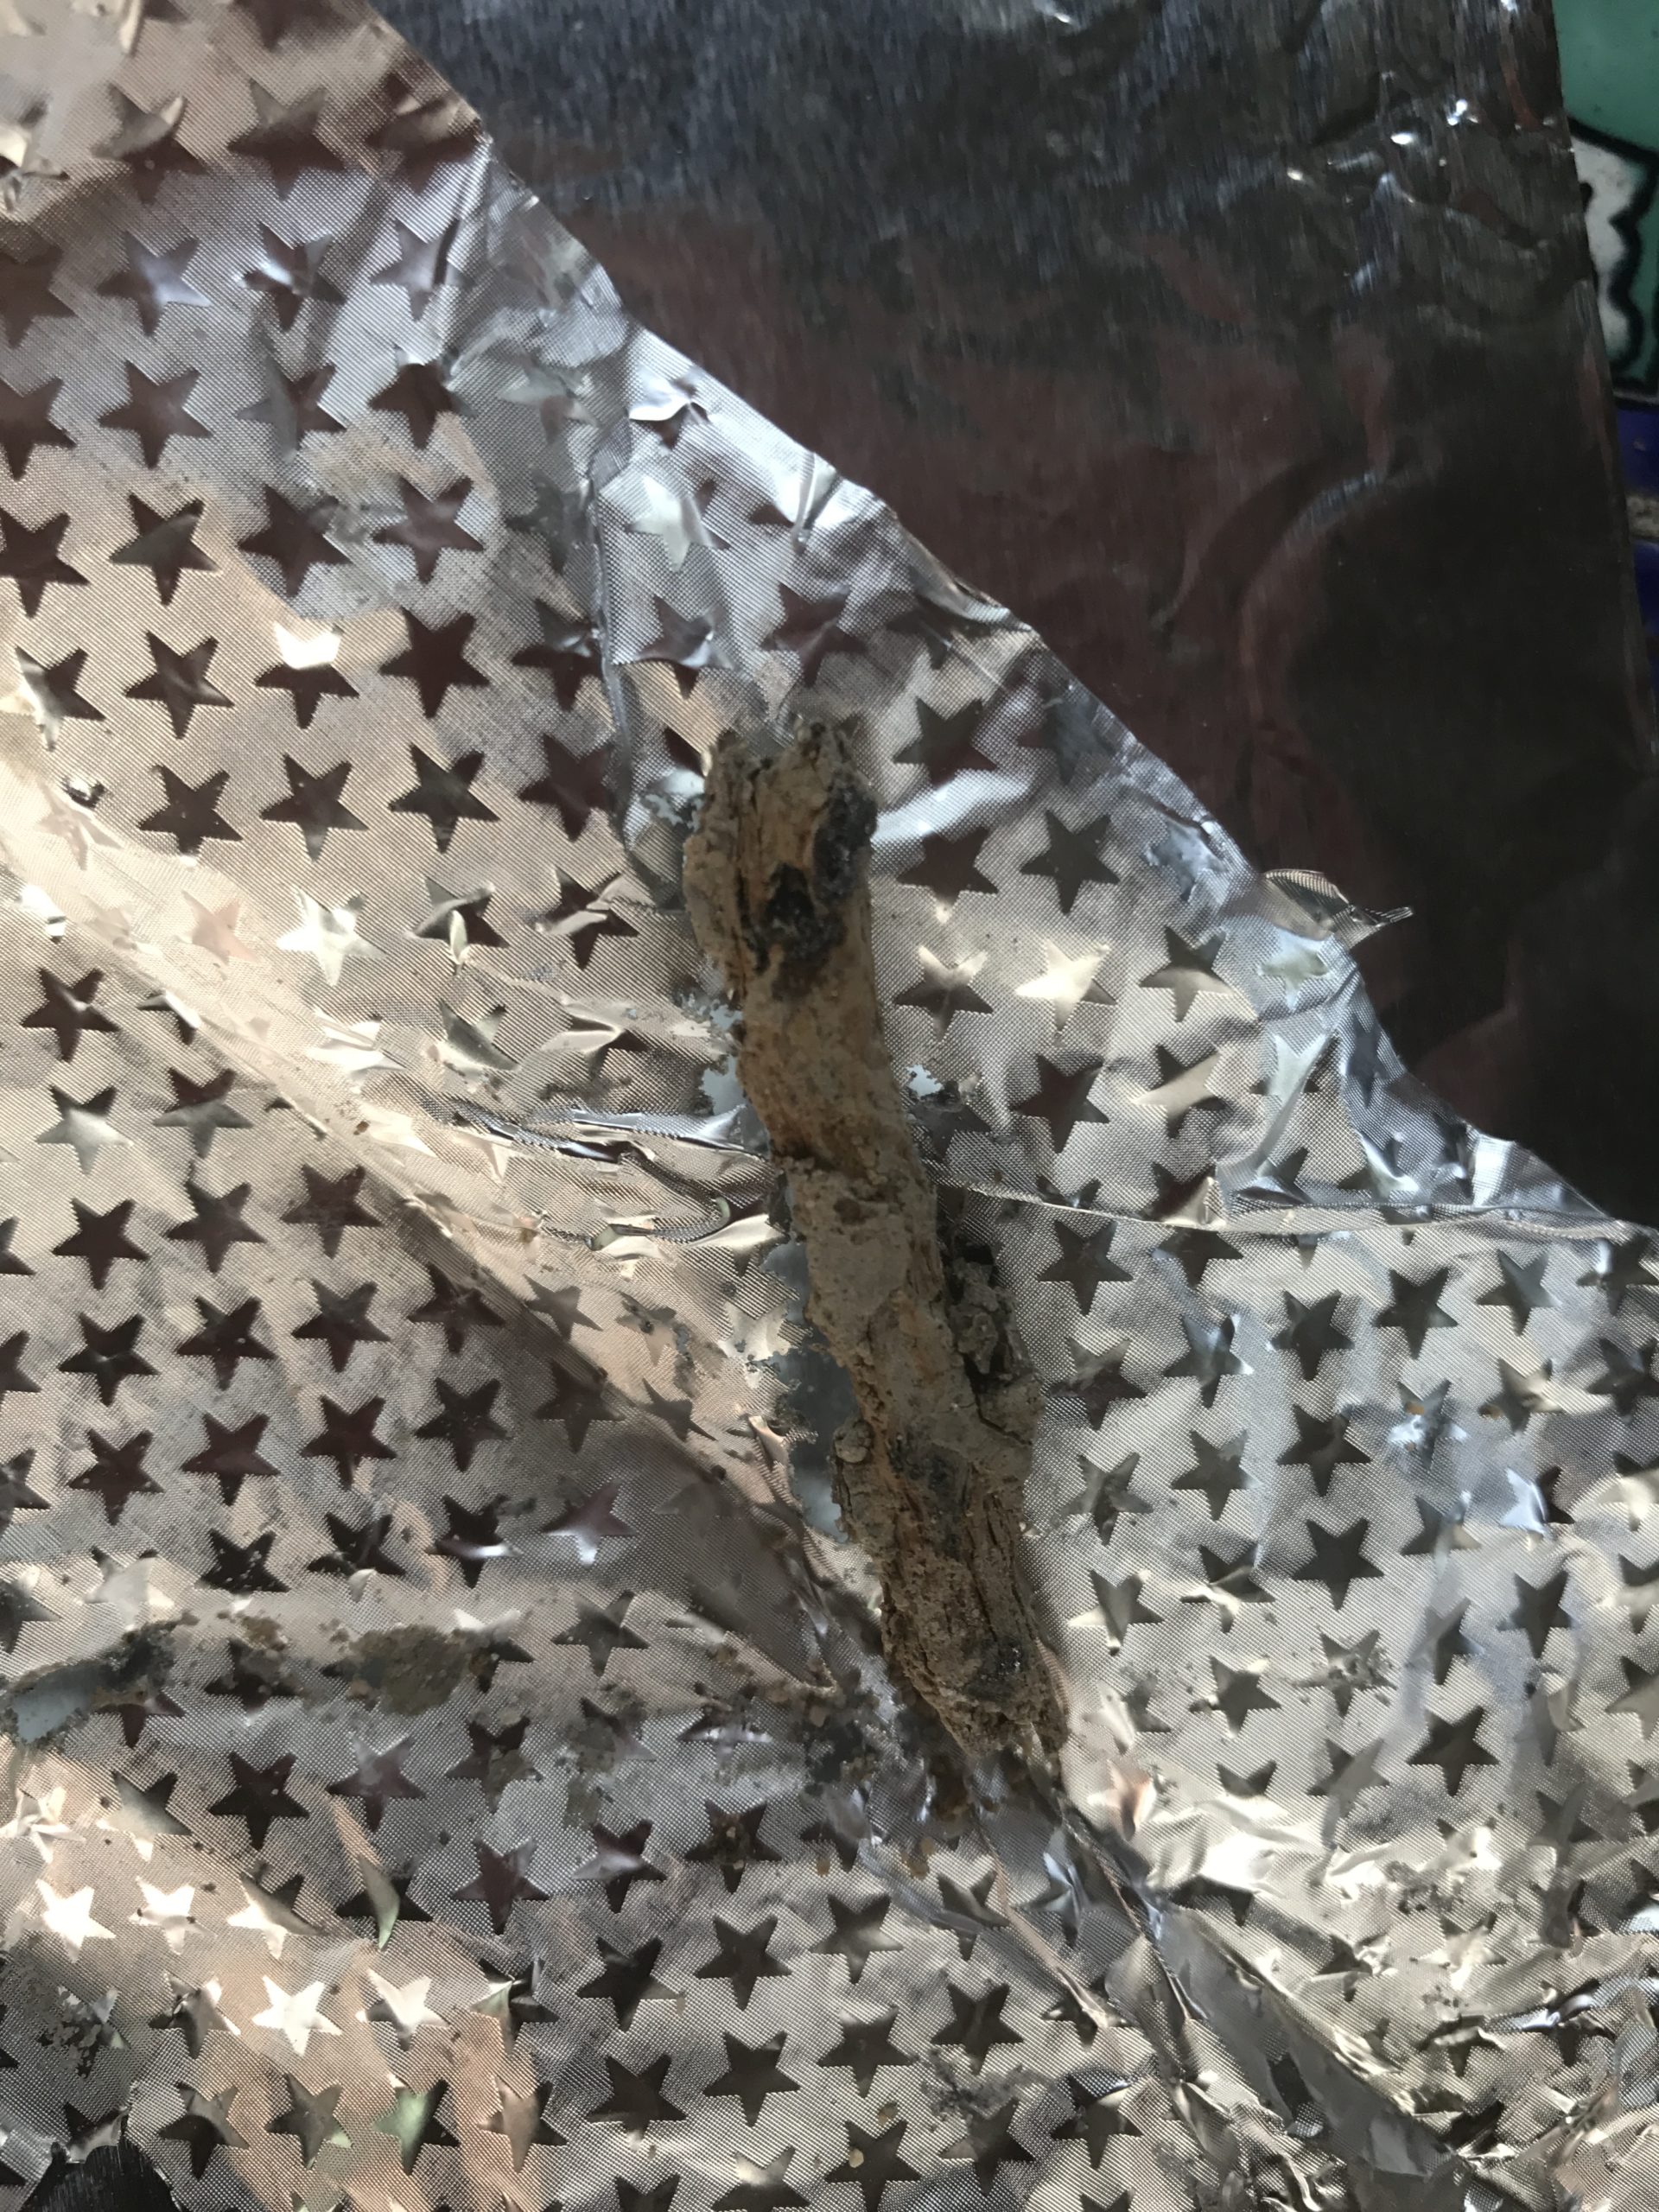
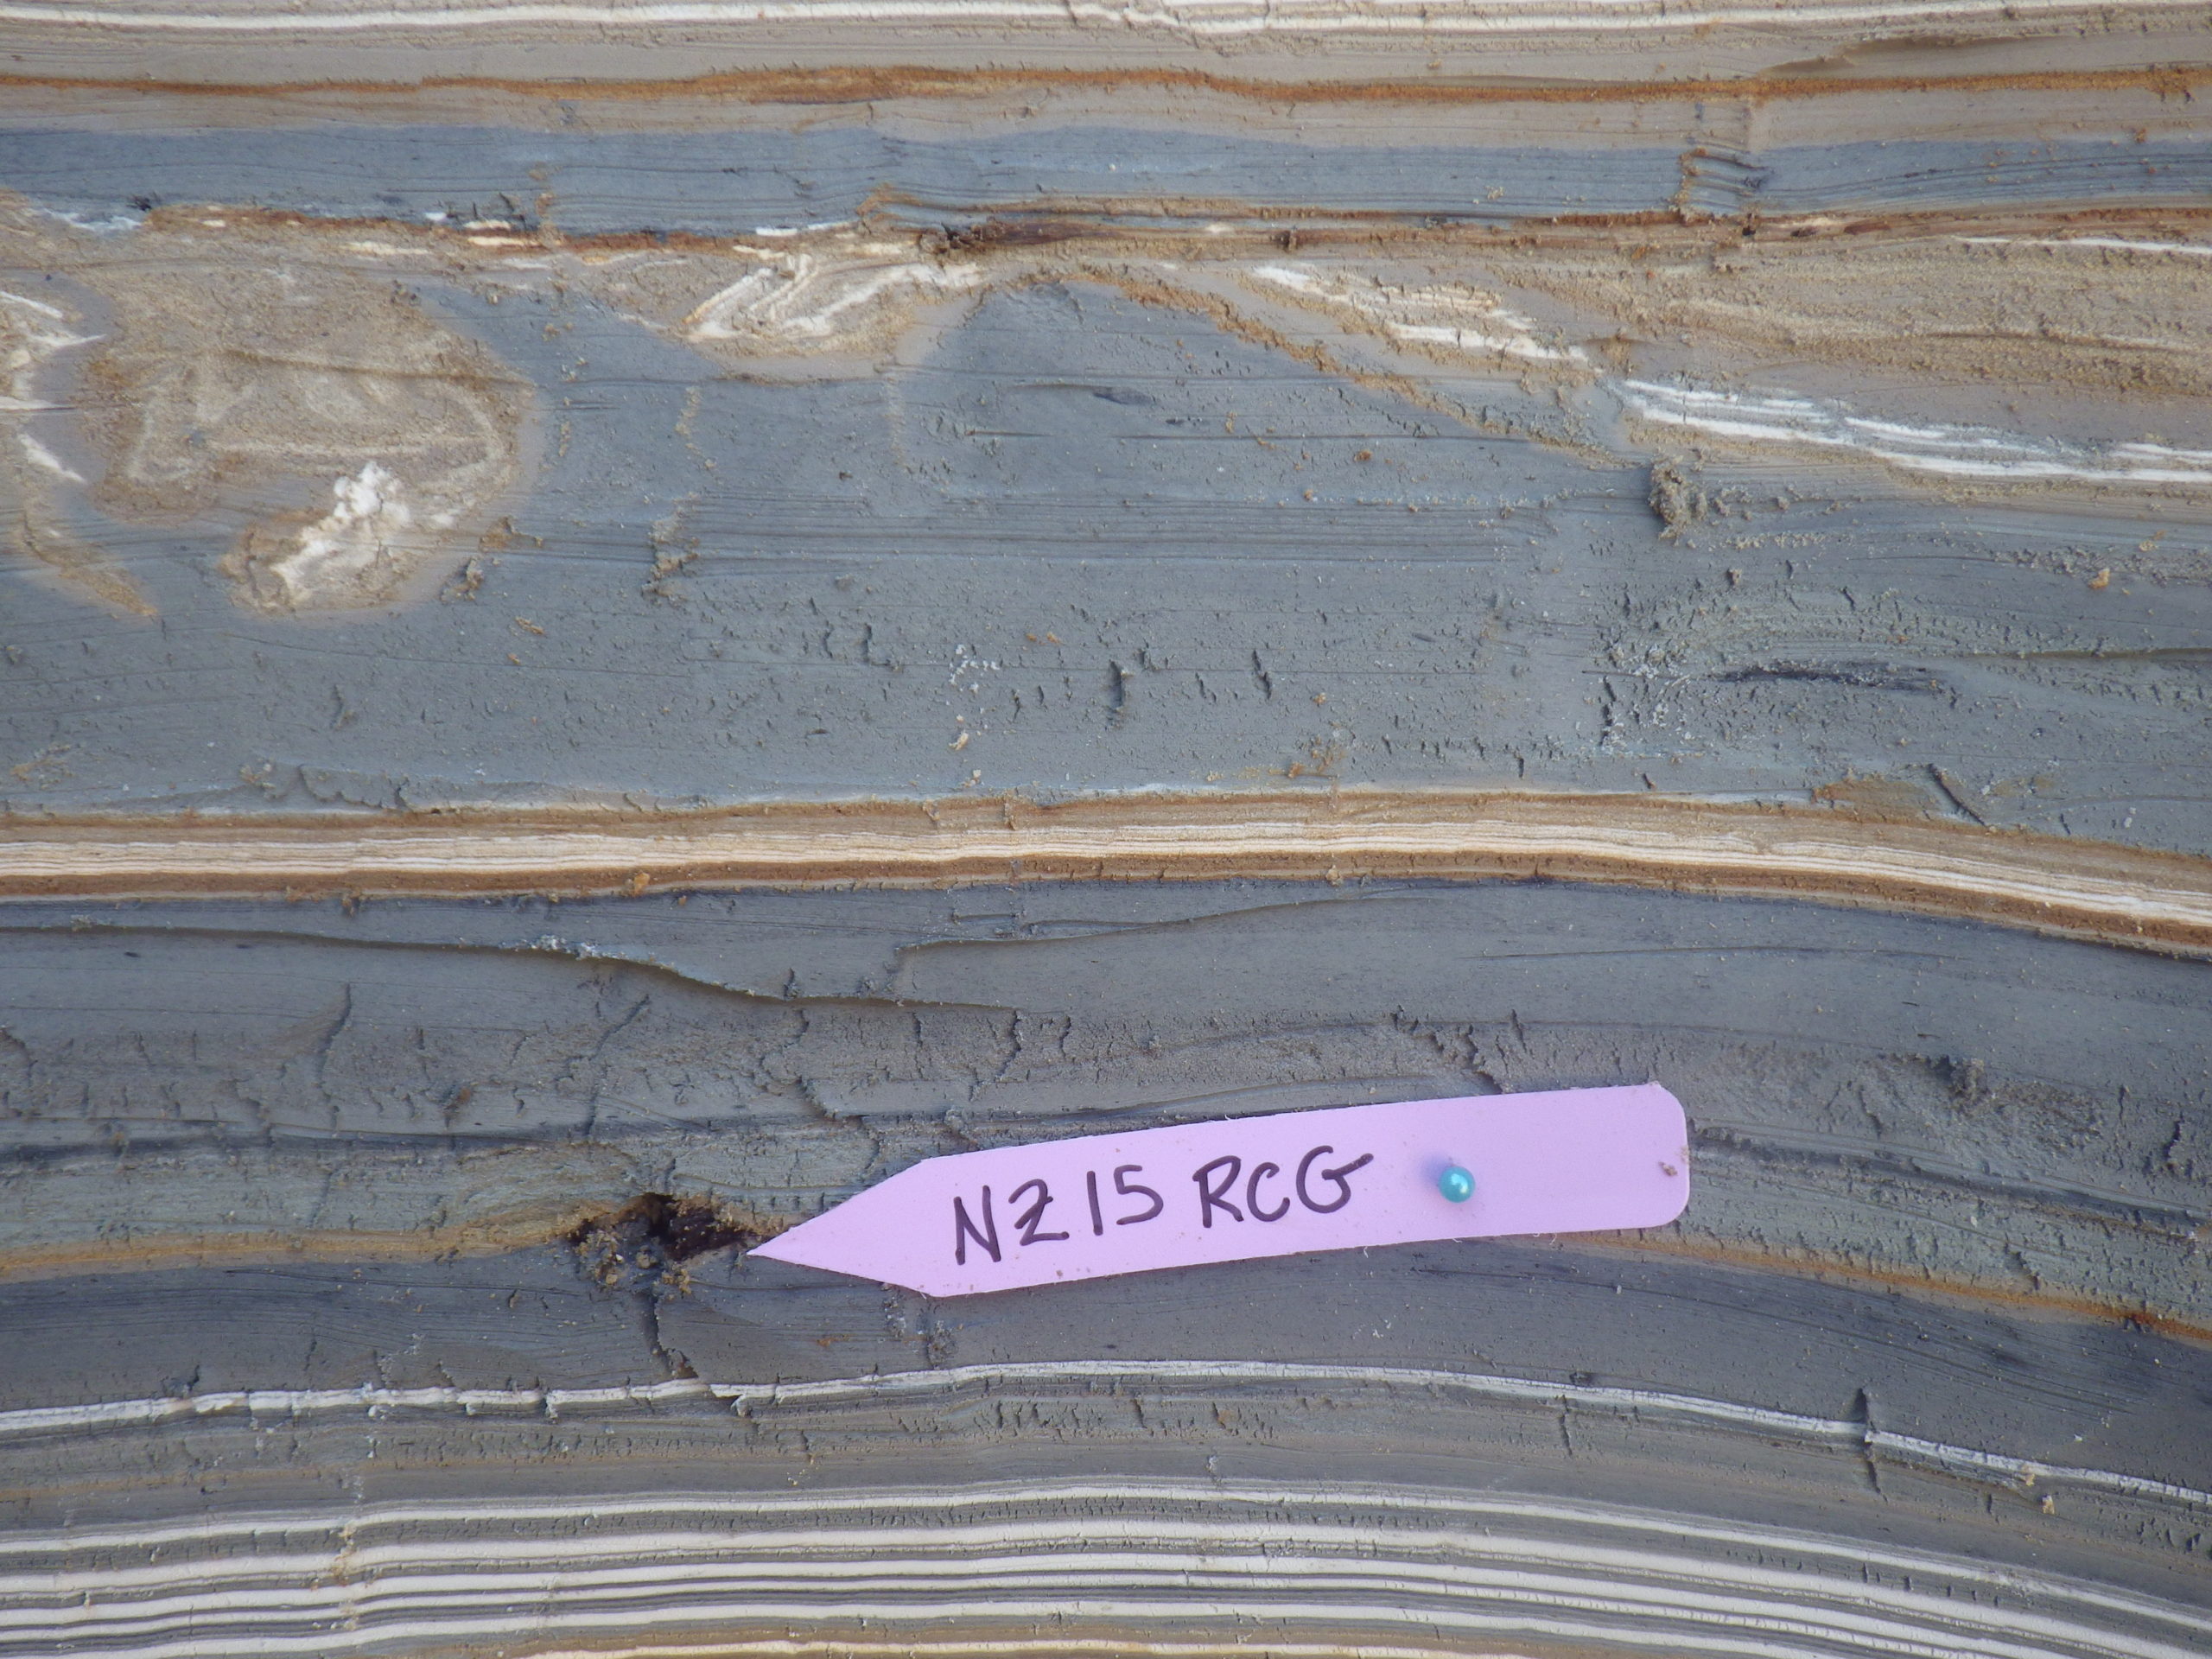
| RCNZ18123 |
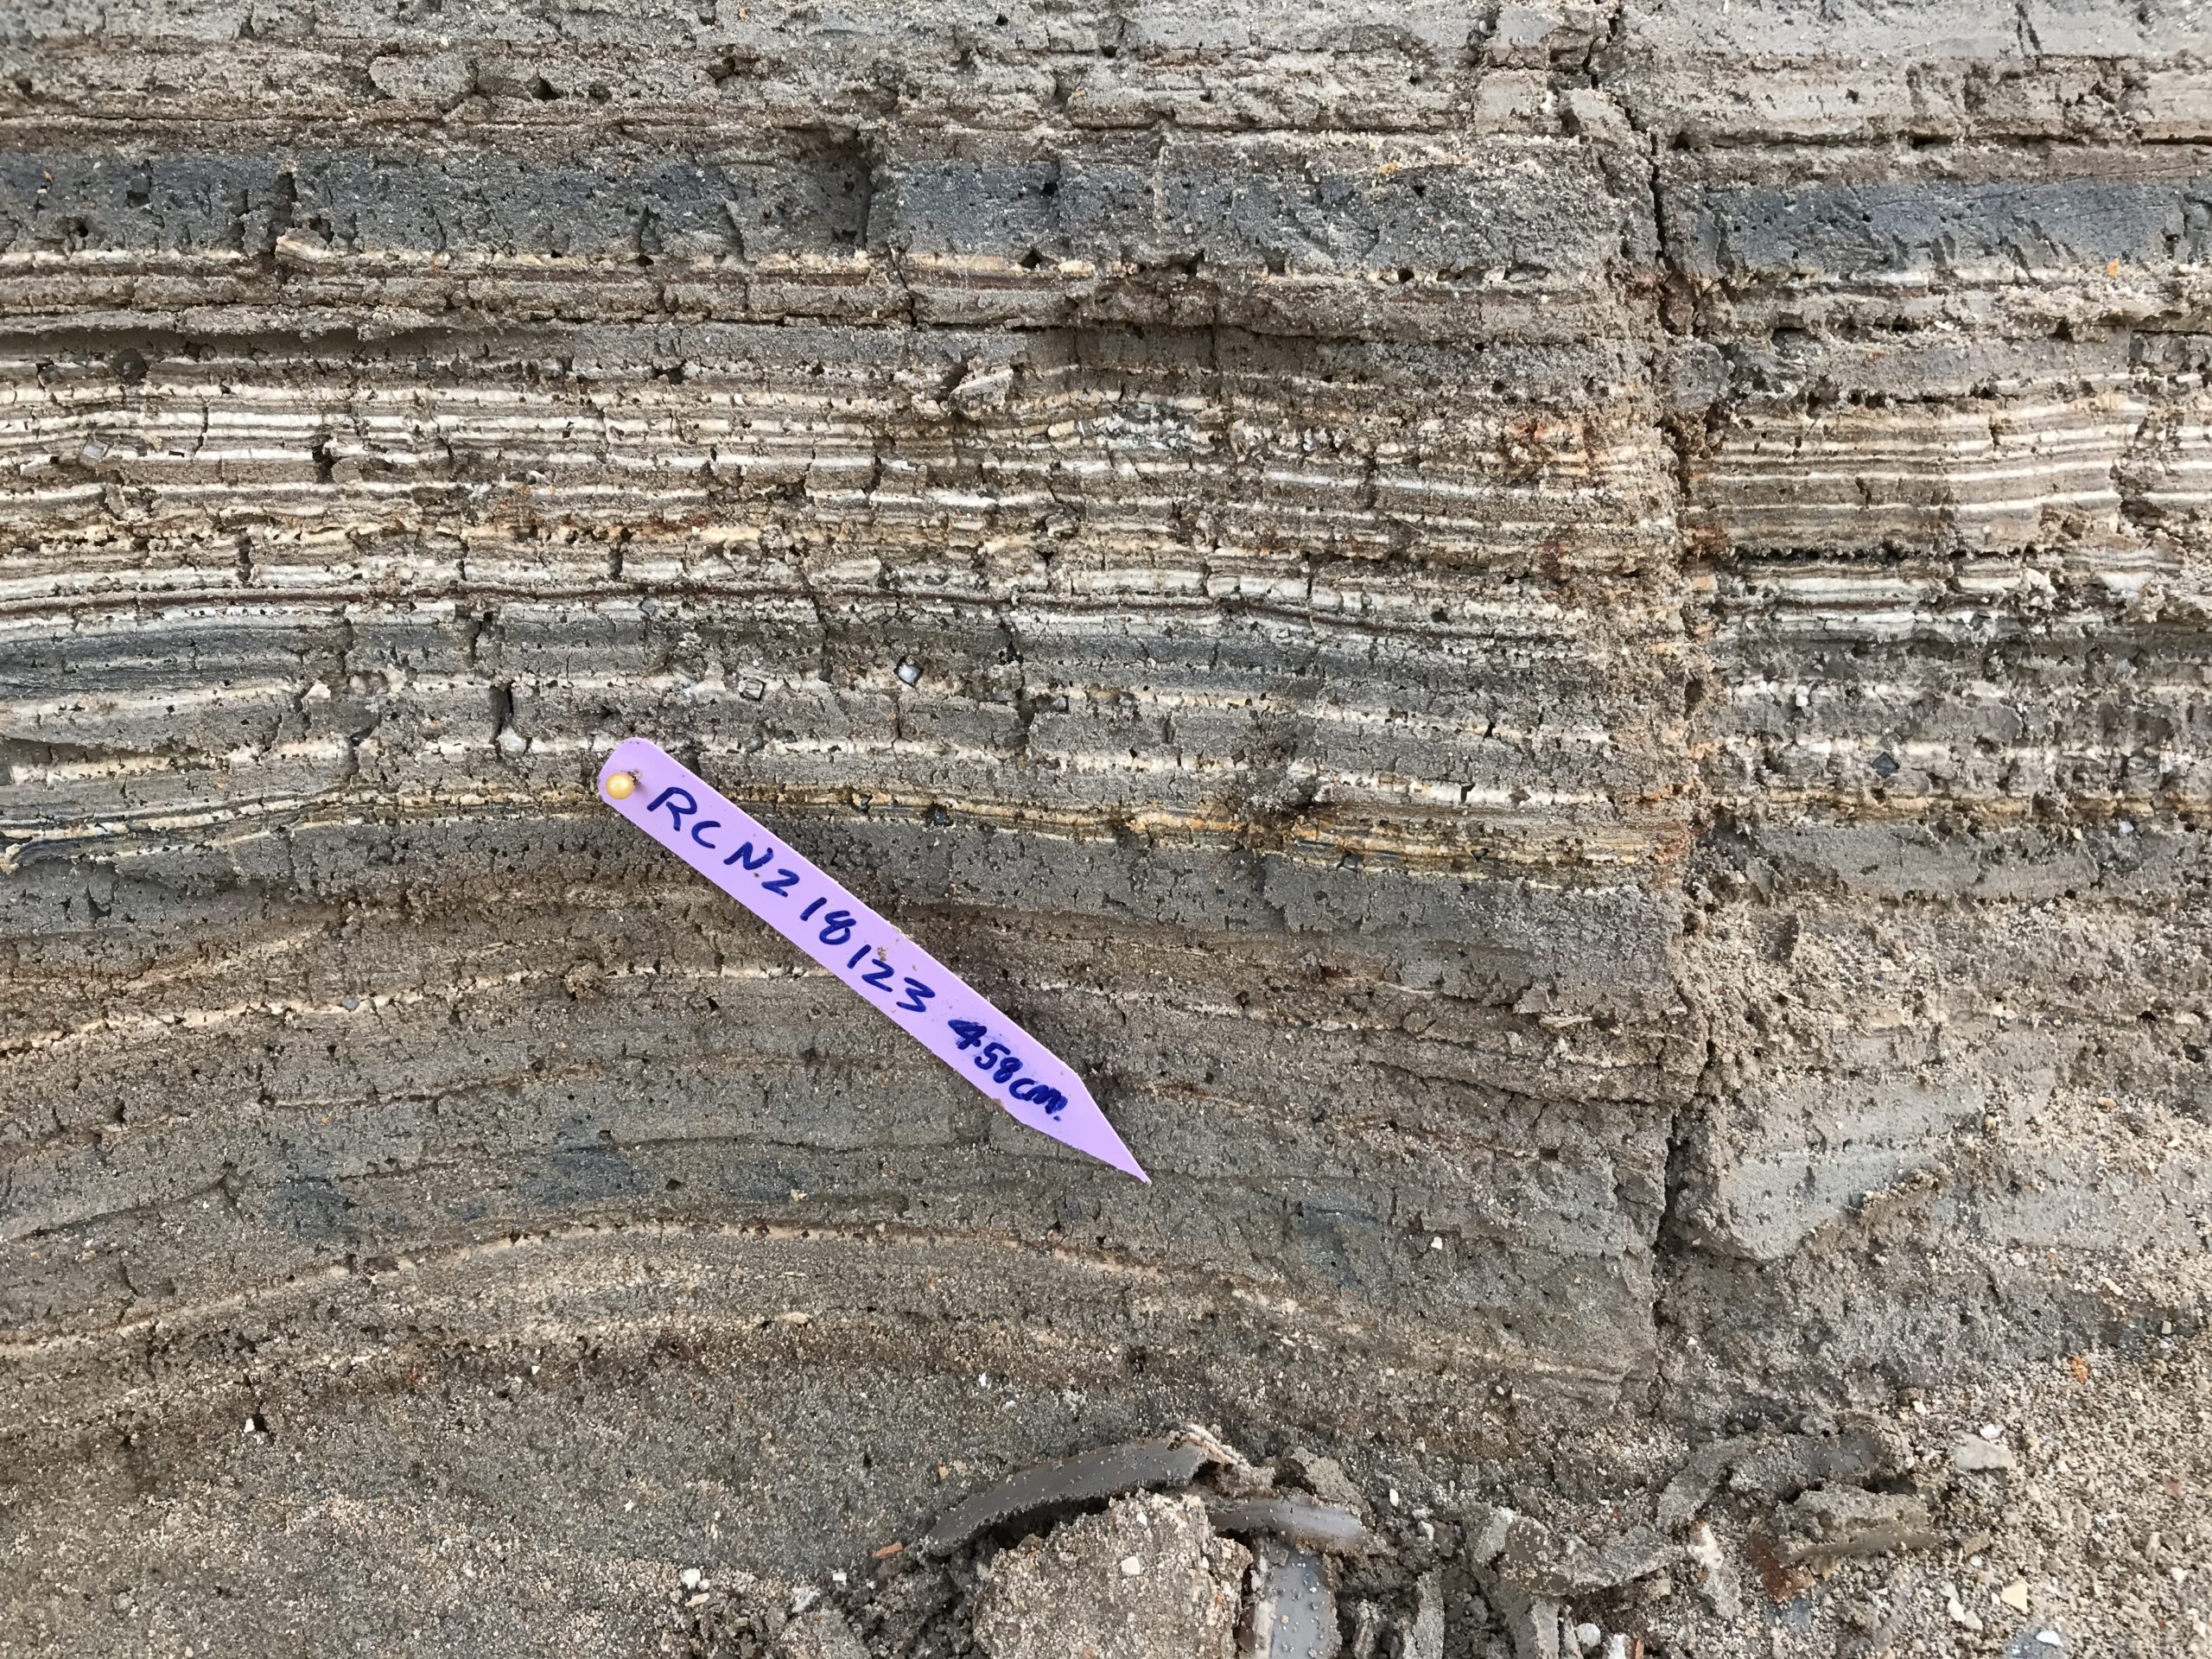 Radiocarbon Sample RCNZ18123 in situ
Click on photo to open magnifiable image in a new tab Photo by Jefferson Williams 2018 |
JW : Big recentish some burning looks old, Lab: Wood - not in seismite | 458 | 2020 | 36 | |
| RCNZ18021 |
 Radiocarbon Sample RCNZ18021 in situ
Click on photo to open magnifiable image in a new tab Photo by Jefferson Williams 2018 |
 Radiocarbon Sample RCNZ18021 before being sent to the lab
Click on photo to open magnifiable image in a new tab Photo by Jefferson Williams |
JW : Big Twig, Lab: Charcoal - not in seismite | 460 | 2118 | 32 |
| NZ_15_C |
 Radiocarbon Sample NZ_15_C in situ
Click on photo to open magnifiable image in a new tab Photo by Jefferson Williams 2015 |
JW : Middle Outcrop 782 mg, Lab: Charcoal - at top of seismite | 466 | 2198 | 34 | |
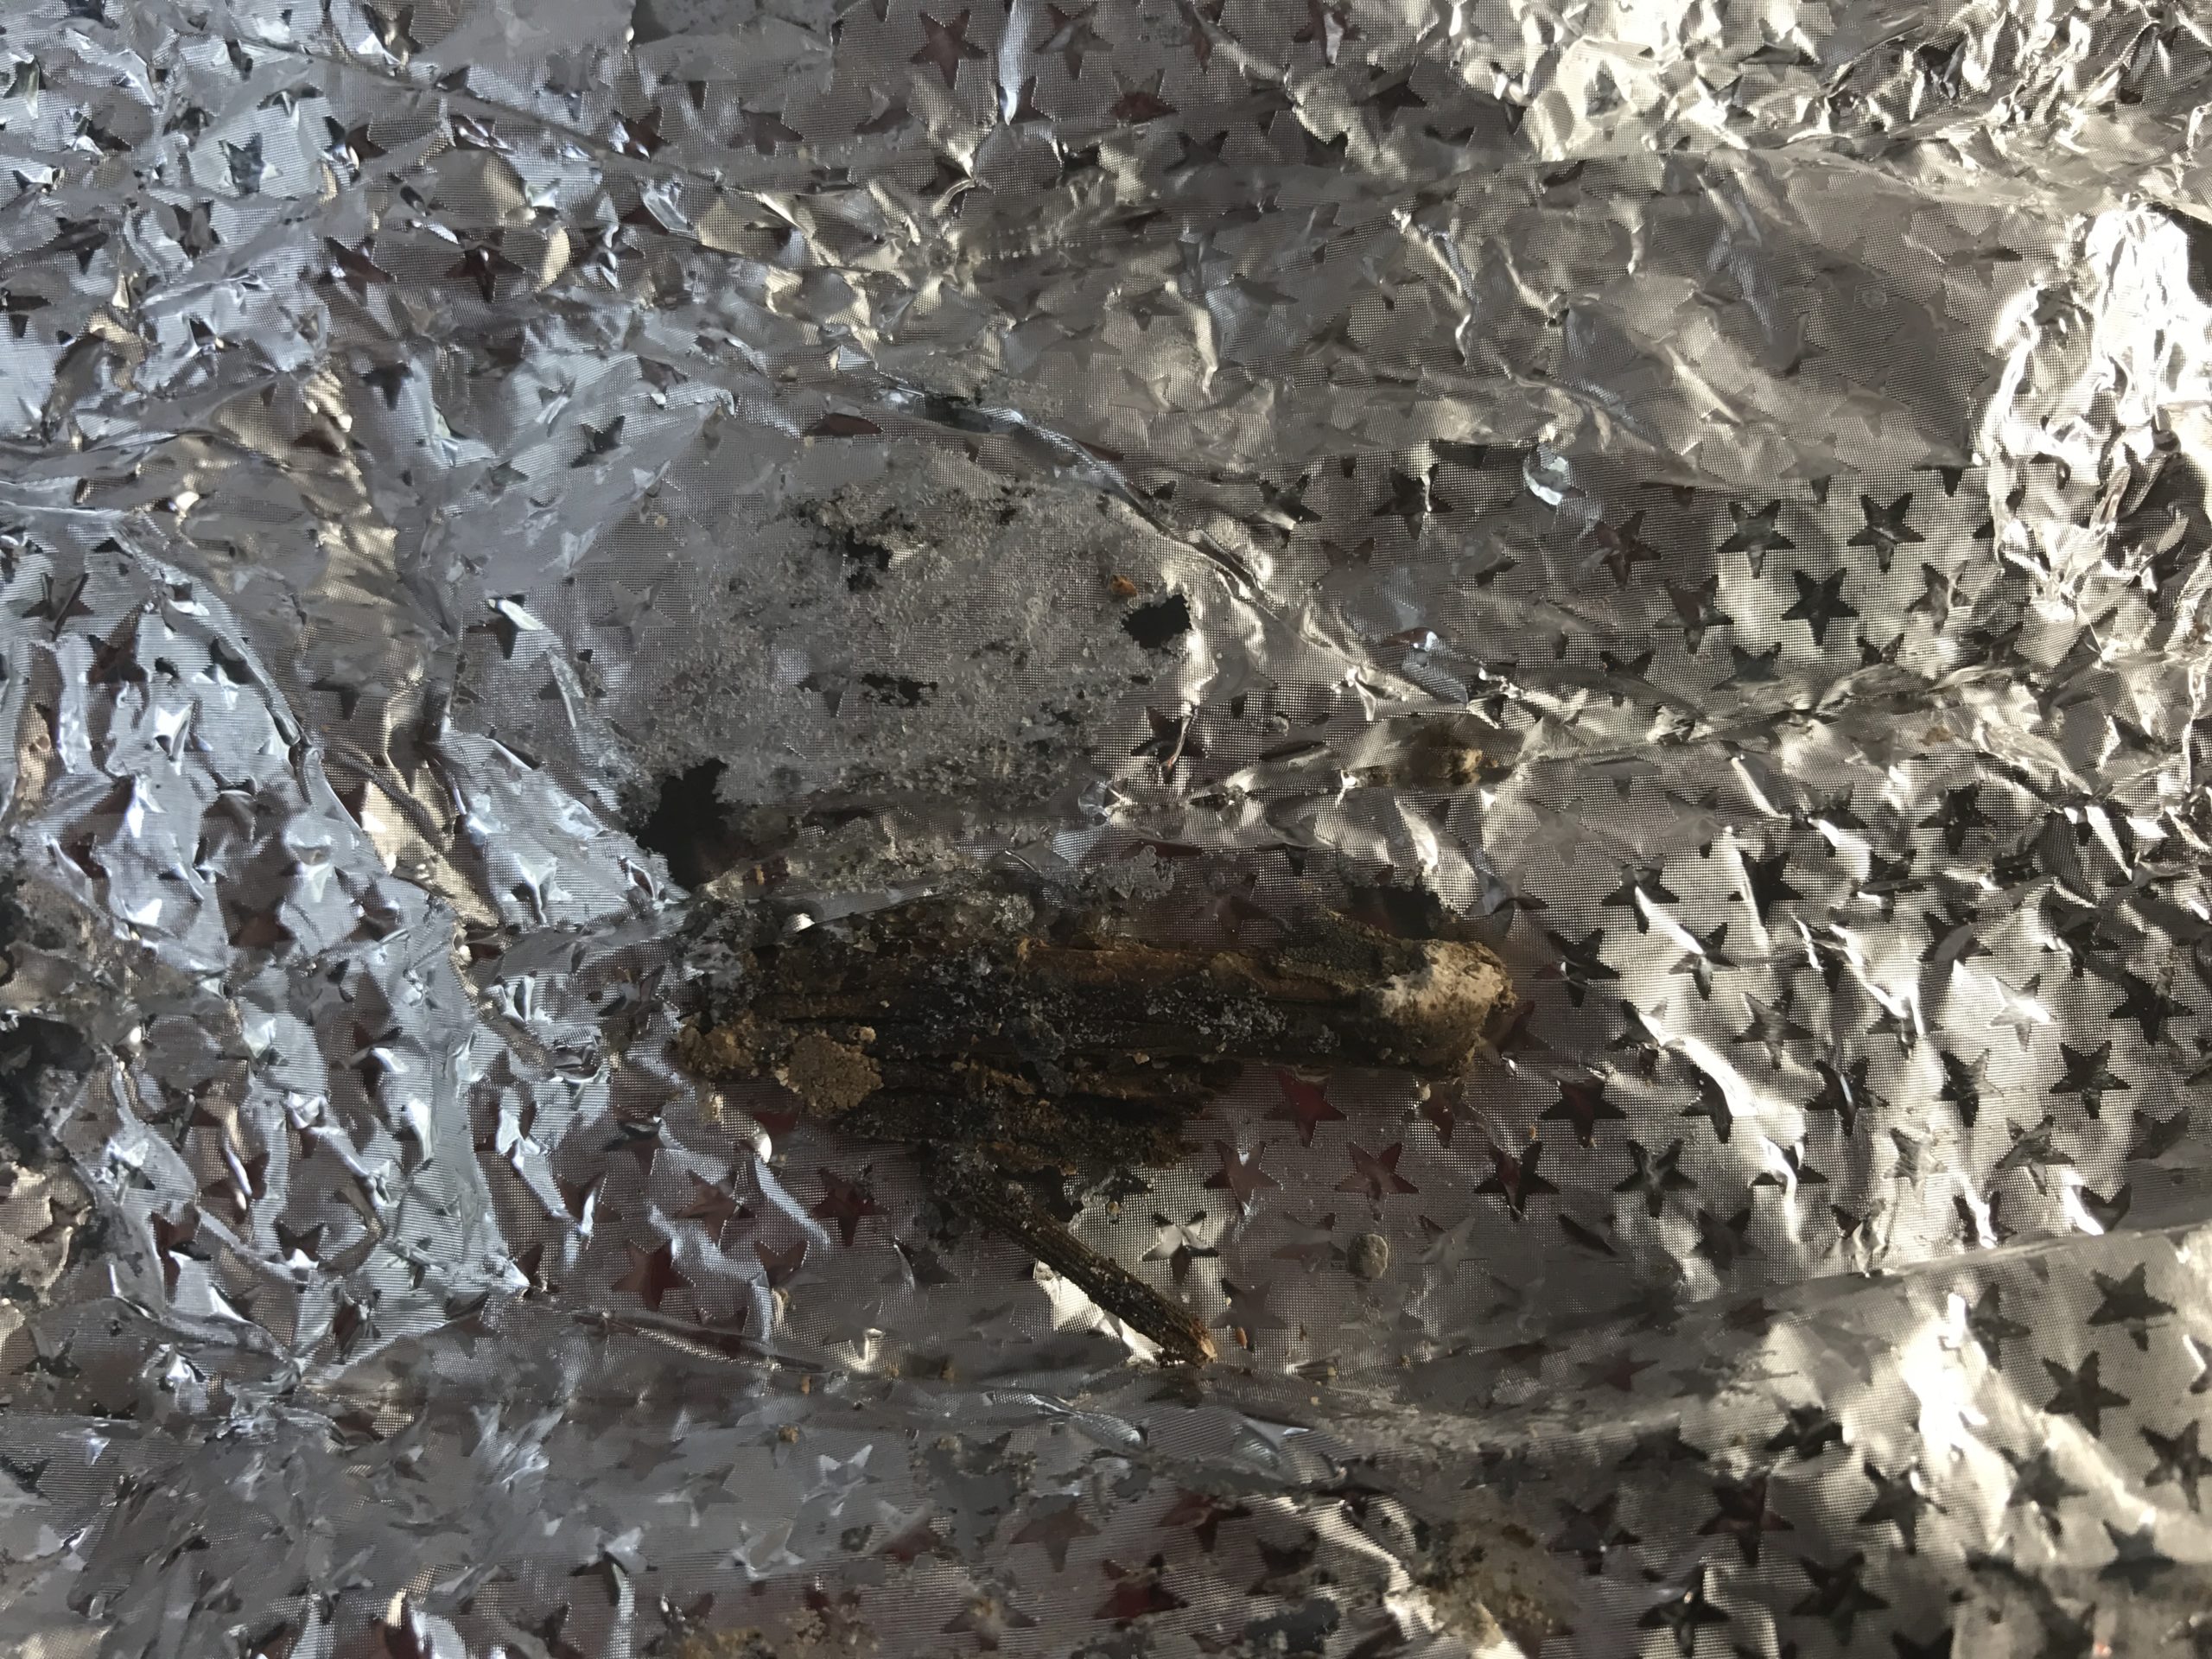
| RCNZ18201 |
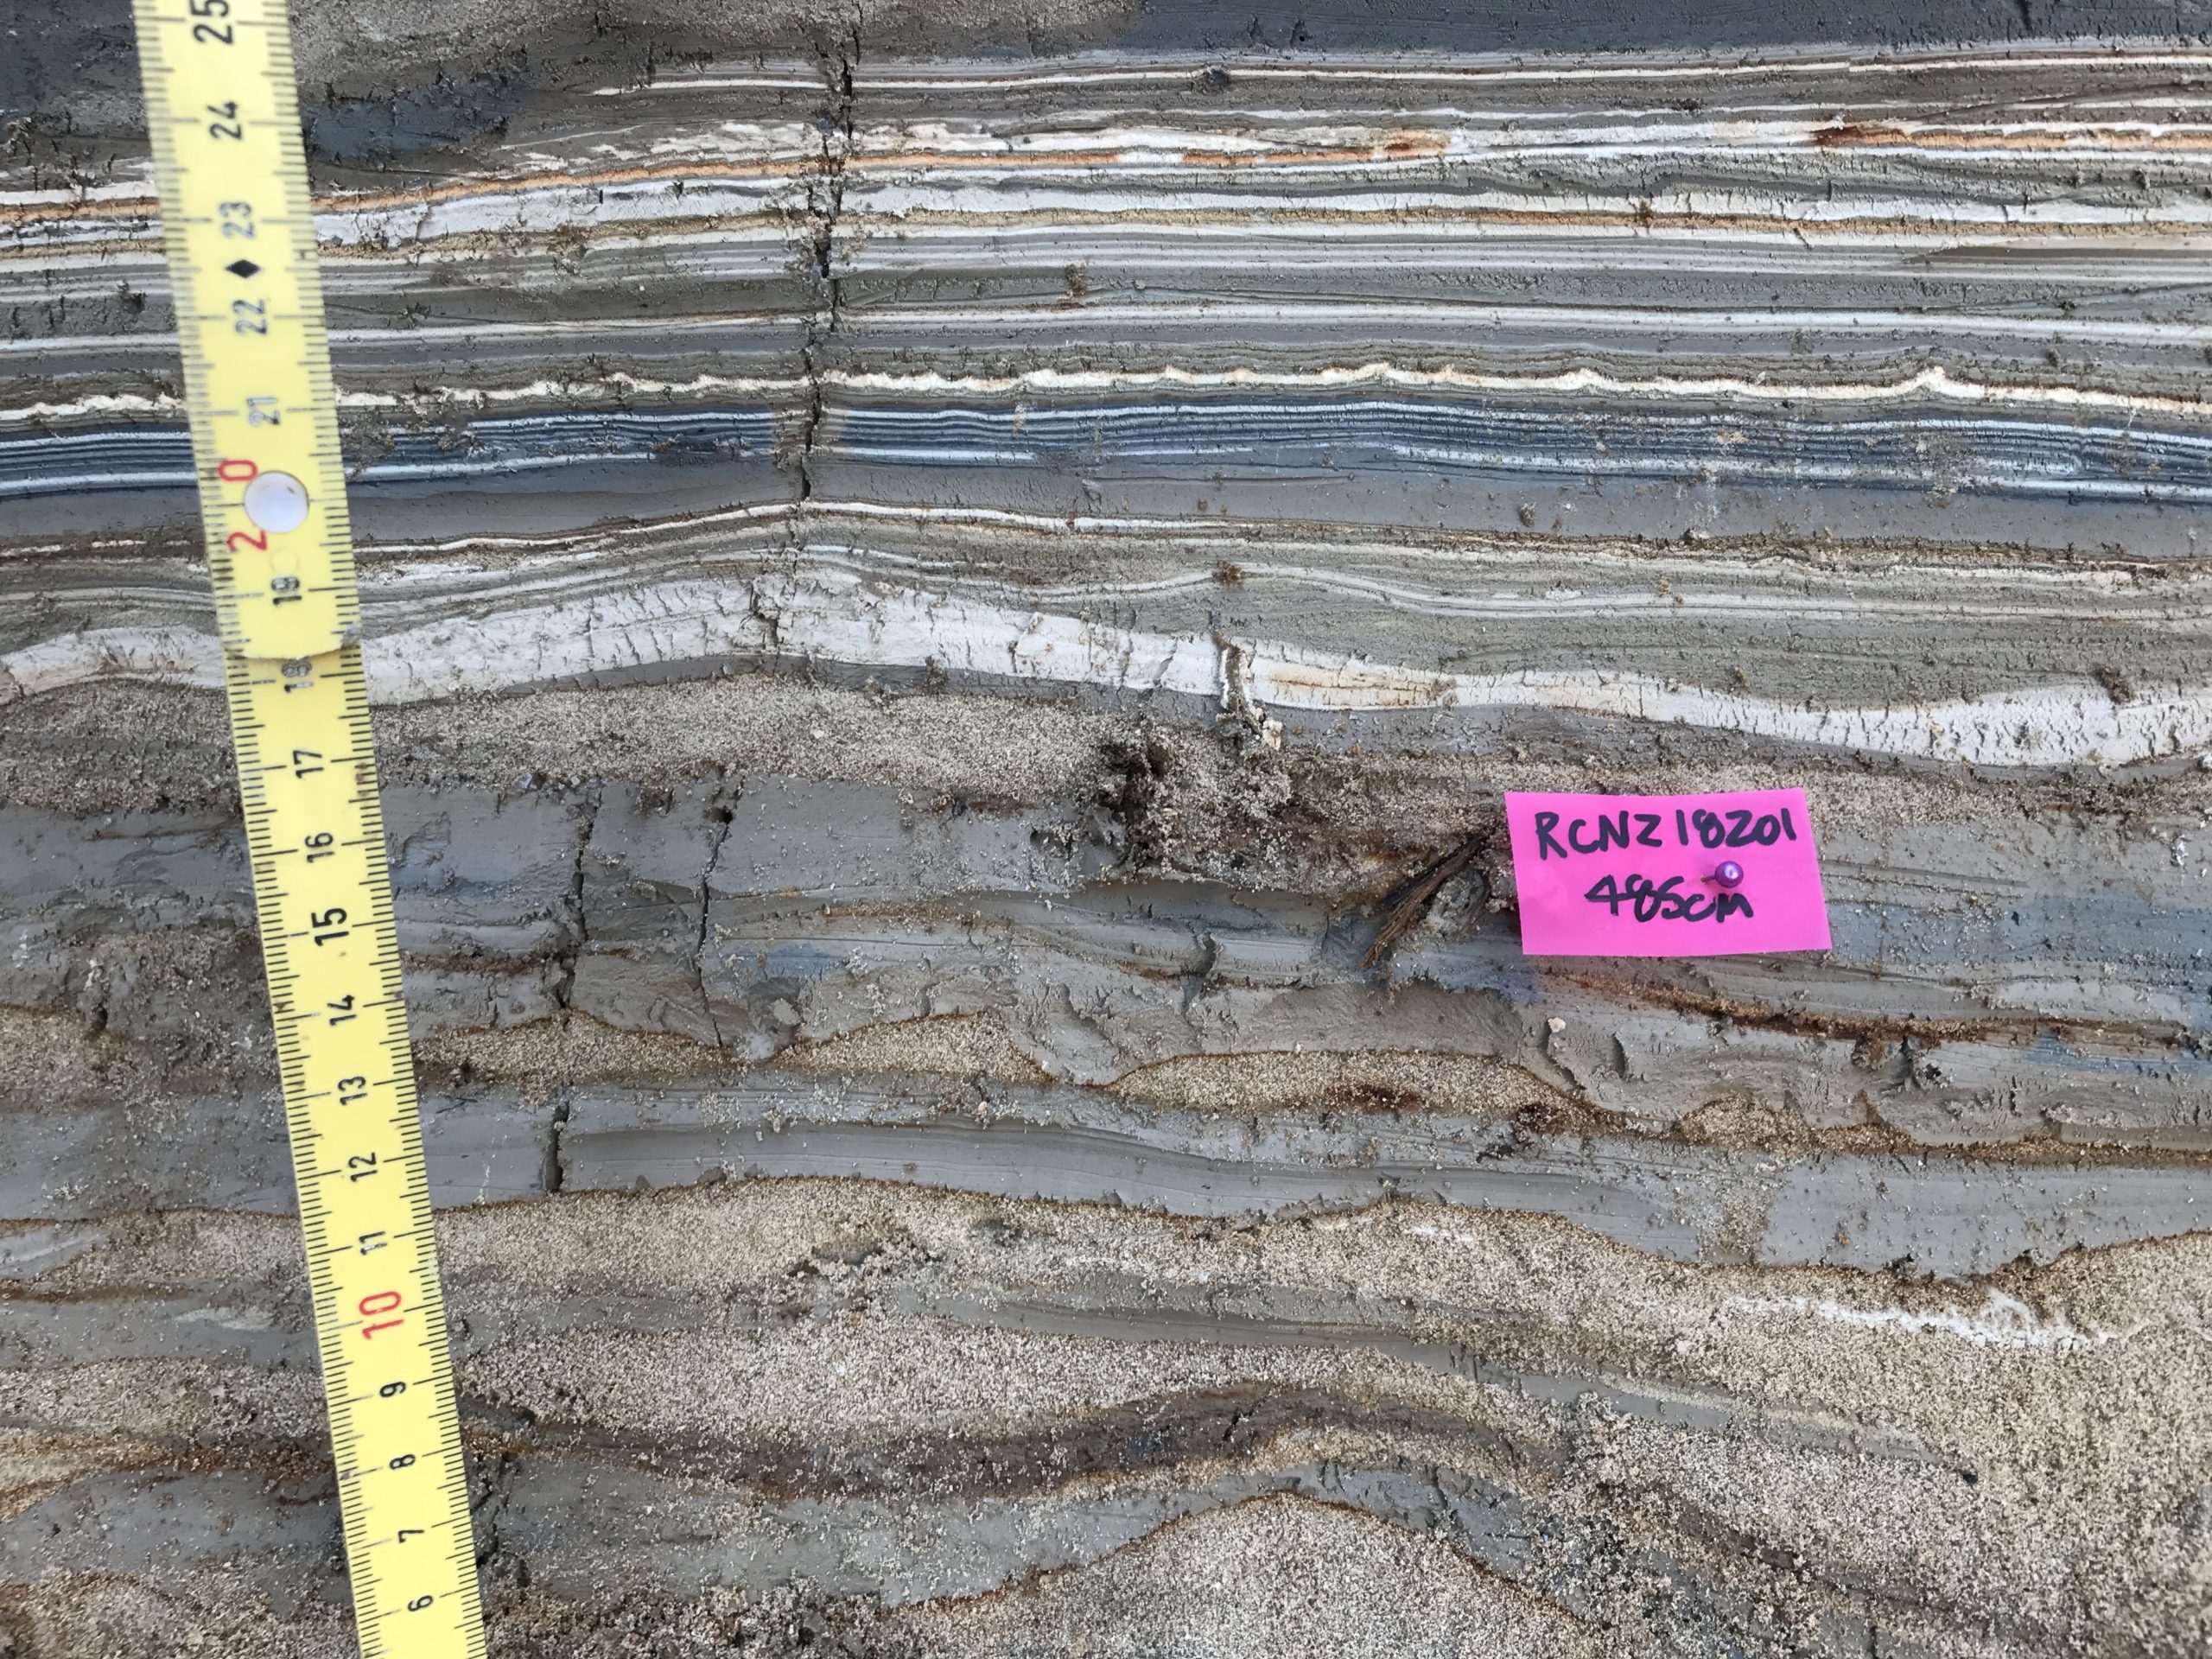 Radiocarbon Sample RCNZ18201 in situ
Click on photo to open magnifiable image in a new tab Photo by Jefferson Williams 2018 |
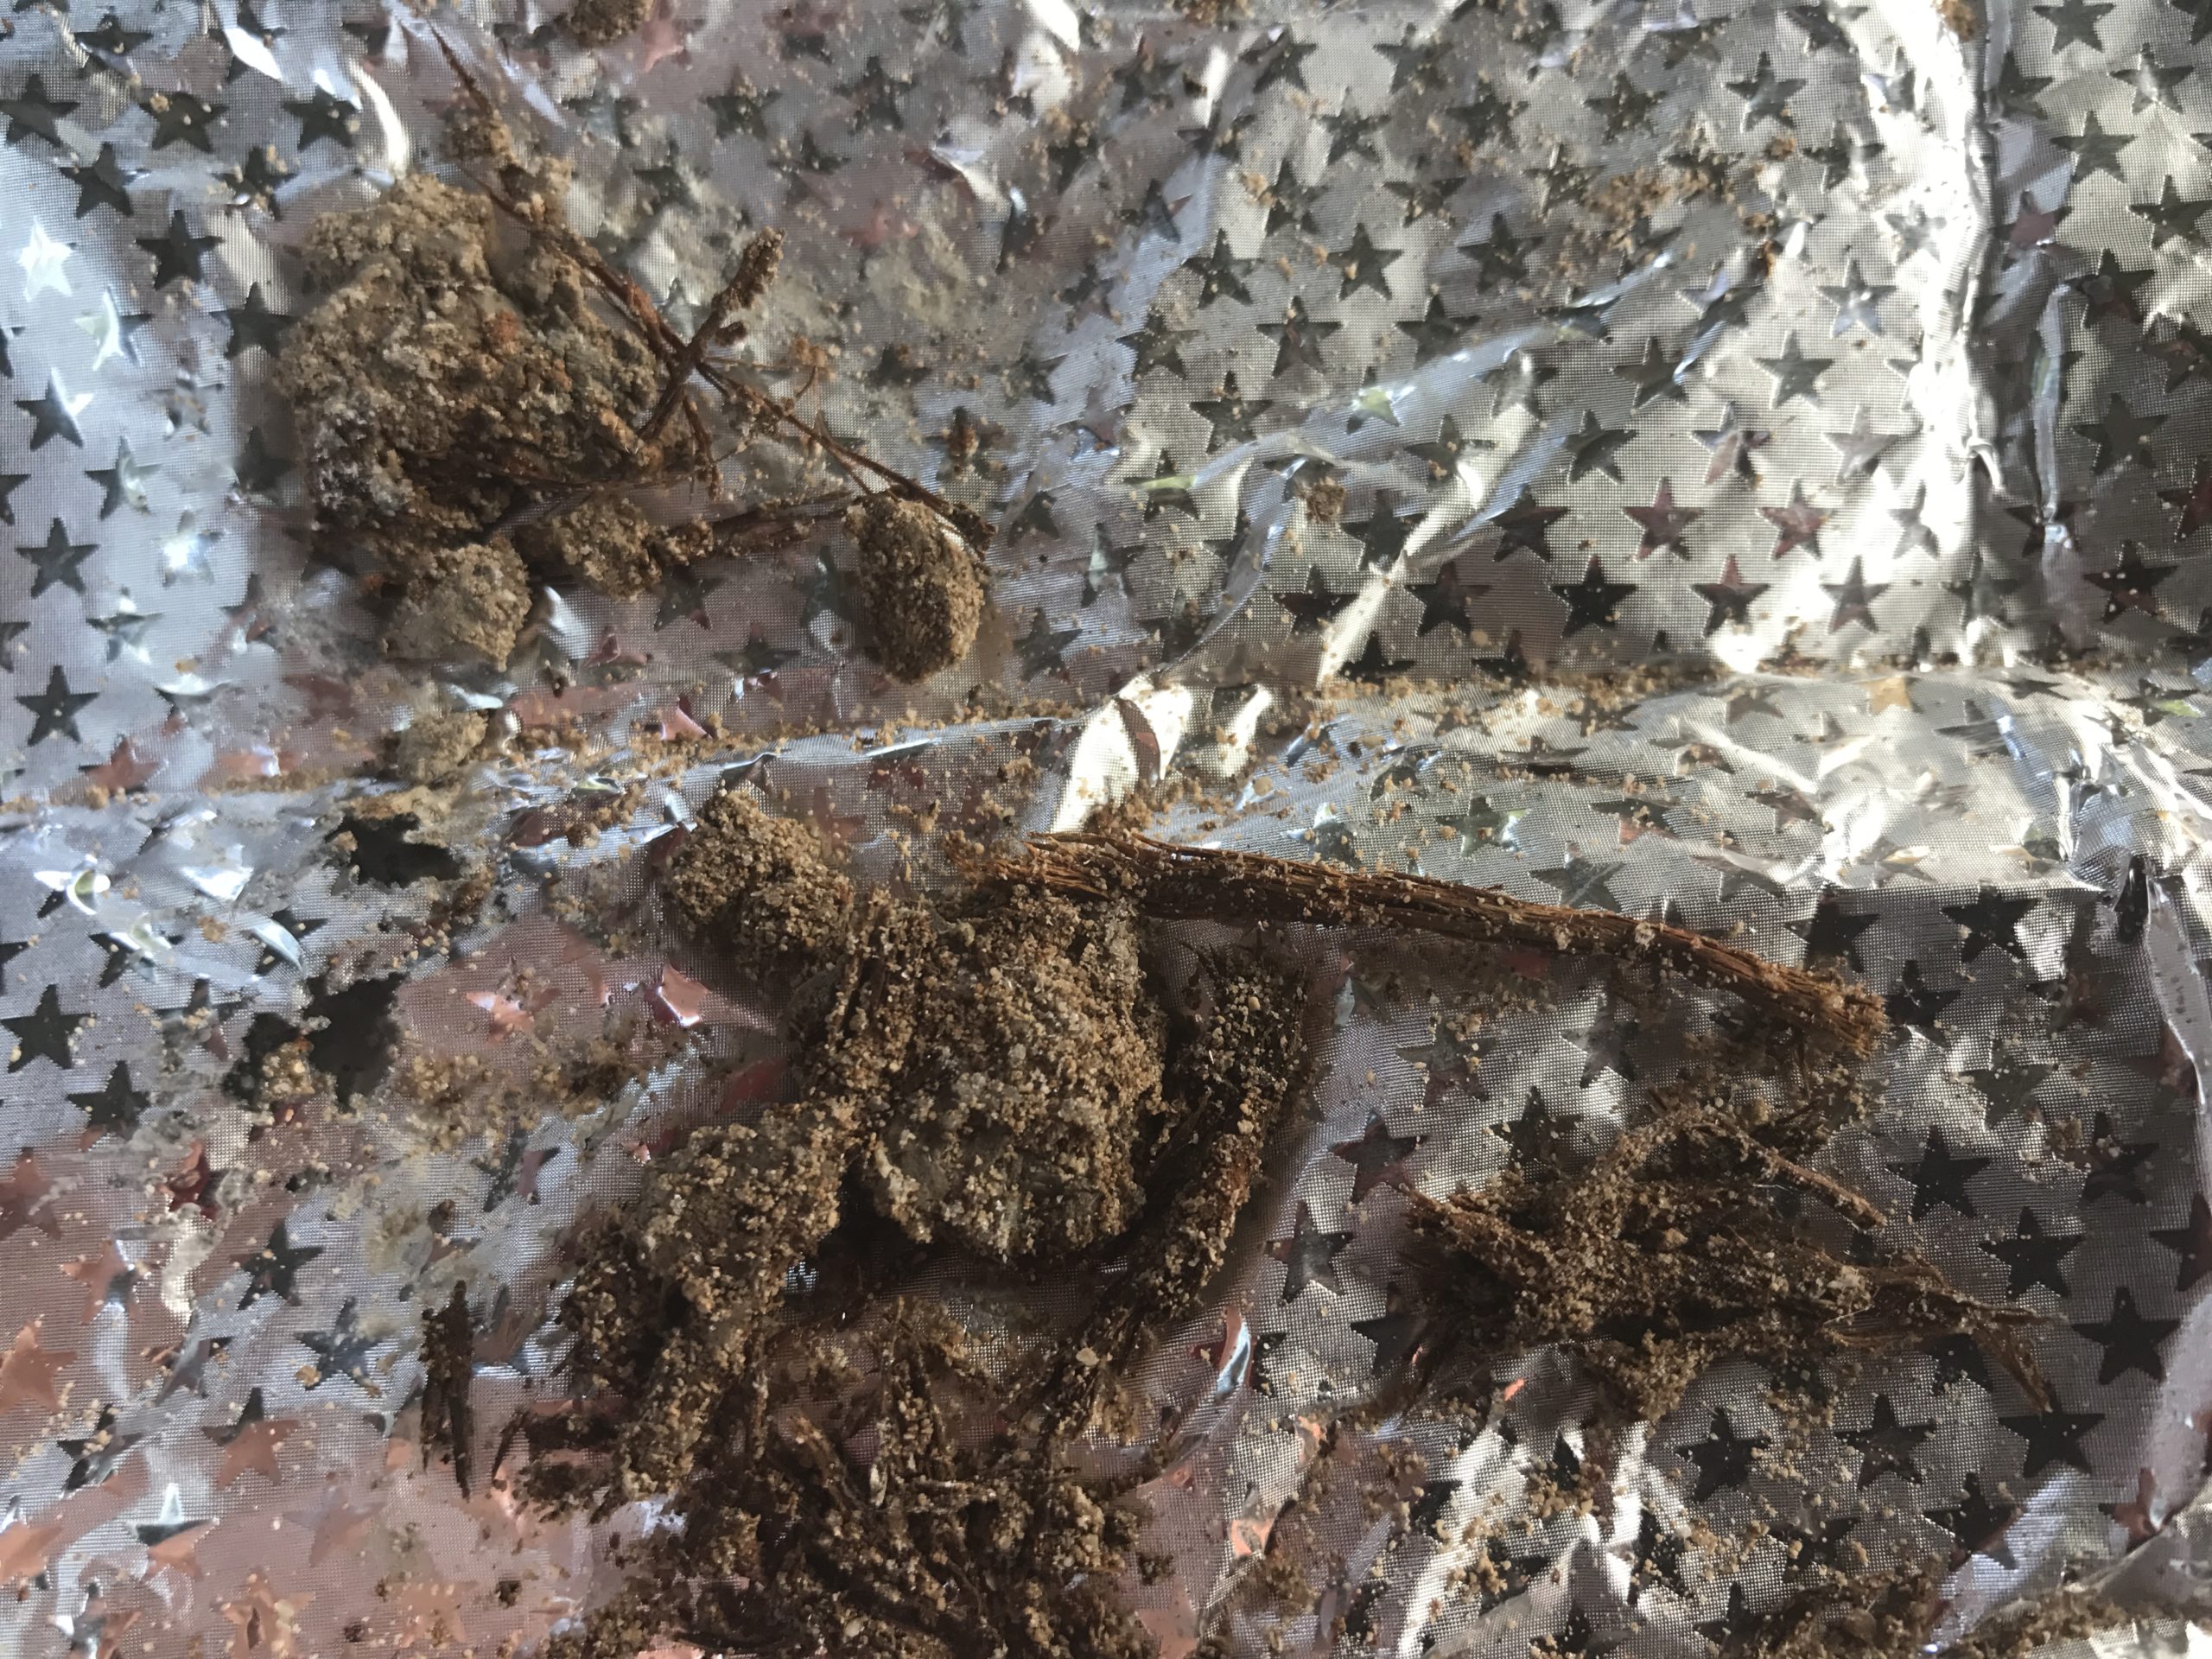 Radiocarbon Sample RCNZ18201 before being sent to the lab
Click on photo to open magnifiable image in a new tab Photo by Jefferson Williams |
JW : lots of material recentish, Lab: Wood - not in seismite | 485 | 2152 | 34 |
 Preliminary Fence Diagram for ZA-2, ZA-3, and ZA-4
Click on Image to open high resolution version in a new tab
Constructed by JW - Nov. 2024

Click on Image to open high resolution version in a new tab
Photo by Jefferson Williams - January 20214

Click on Image to open high resolution version in a new tab
Photo by Jefferson Williams - January 20214

Click on Image to open high resolution version in a new tab
Photo by Jefferson Williams - January 20214

Click on Image to open high resolution version in a new tab
Photo by Jefferson Williams - January 20214

Click on Image to open high resolution version in a new tab
Photo by Jefferson Williams - January 20214
 Fig. 2
Lithology of the sediment cores and the established age-depth models of the different profiles. The Ze'elim coring profile is paralleled by the Ze'elim gully wall [16] . The Ein Gedi chronology is based on 20 radiocarbon dates and on the varve counted section (black line) in the upper part.
Migowski et. al. 2004
The GFZ/GSI core at Nahal Ze'elim was taken in 1997. Thin Section Slides do not currently have depths logged relative to surface but were created to examine the Jerusalem Quake and the Josephus Quake so
that should provide an approximate depth.
Depths for thin sections is what was written on photo blocks and does not correspond to core depths but likely depth in an individual core section. Depths are measured from bottom to top
(i.e. downhole to uphole) so slide 1 is at the bottom and slide 4 is at the top. Top direction of all slides and images has been confirmed. Slides and images are oriented so the uphole
direction is pointing up. Core Inventory for 1997 GFZ/GSI cores can be found
here
| Image | Description | Image | Description | Image | Description | Image | Description |
|---|---|---|---|---|---|---|---|
 Thin Section Slide 1
Flatbed Scan |
Thin Section Slide 1 0-11 |
 Thin Section Slide 2
Flatbed Scan |
Thin Section Slide 2 9-20 |
 Thin Section Slide 3
Flatbed Scan |
Thin Section Slide 3 18-29 |
 Thin Section Slide 4
Flatbed Scan |
Thin Section Slide 4 26.5-37.5 |
 Resin Block for Thin Section Slides 1-4
|
Resin Block Slides 1-4 |
 Thin Section Slides 1-4 overlapped
|
Thin Section Slides 1-4 Overlapped |
The level of the modern Dead Sea is the result of a large human induced retreat linked to the damming of its northern tributary (Sea of Galilee) and water pumping for industrial purposes. This retreat has triggered the formation of several meter deep gullies in the Ze'elim Plain (Ben Moshe et al., 2008). Late Holocene laminated sequences are exposed in these gullies (Fig. 1B). The two aforementioned high-stand periods were identified in the radiocarbon-dated outcrop (Bookman (Ken-Tor) et al., 2004; Fig. 1D) in February 2011. One block of laminated sediments from the late 19th–early 20th centuries high-stand (ZA11B2), and three blocks of laminated sediments from the Hellenistic-early Roman high-stand (ZA11B3R, ZA11B4L, ZA11B5L) were collected (Fig. 1D). Sampling of individual, mm-scale laminae was done at the sedimentology laboratory of the University of Haifa using a scalpel. Only consecutive detrital and aragonite laminae with no suspicion of contamination or mixing with the upper and lower layers were considered. Overall, 65 detrital-aragonite couplets (130 samples) were analysed: 13 in block ZA11B2 (couplets 1 to 13), 11 in block ZA11B3R (couplets 14 to 24), 17 in block ZA11B4L (couplets 25 to 41) and 24 in block ZA11B5L (couplets 42 to 65) (Supplementary Table S2).
Figure 1d
Sedimentary scheme of the Ze'elim outcrop profile and radiocarbon chronology (modified from Bookman (Ken-Tor) et al., 2004). ZA11B2 sediment block represent the late 19th e early 20th centuries high-stand. ZA11B3R, ZA11B4L and ZA11B5L sediment blocks represent the Hellenistic-early Roman high-stand. Aragonite crusts were deposited in a coastal to terrestrial environment, while the aragonite laminae (discussed in this study) were deposited in a lacustrine environment. (For interpretation of the references to colour in this figure legend, the reader is referred to the web version of this article.)
click on image to open in a new tab
López-Merino et al. (2016)
Additionally, fine mud carried in suspension in flash-floods that occurred between February 2009 and June 2012, was collected from drying puddles immediately after the events. A total of 28 flash-flood samples were analysed (Fig. 1C; Supplementary Table S3).
The siliciclastic fraction of the detrital laminae showed at least three different grain-size modes. Most samples had two grain-size modes, a first fine mode of 3–10 μm and a second coarser mode of 20–90 μm (Fig. 2). A ~10 μm mode was obtained on samples from collectors installed on a buoy on the Dead Sea surface during three years (1997–1999) (Singer et al., 2003). This grain-size distribution represents dust deposited over the Dead Sea similar to that of long-range transported Harmattan dust (Stahr et al., 1994) and is comparable to the grain-size distribution of air-borne dust in the Sde Boker area (Negev) (Offer et al., 1992). Thus, the fine grain-size mode in the detrital laminae siliciclastic fraction is consistent with fine dust largely wind-transported from medium to long range. Although a bimodal distribution is in accordance with Haliva-Cohen et al. (2012), the average grain-size measured for the second mode in this study is coarser, possibly due to the carbonate dissolution stage. Few samples included a minor third mode of 100–200 μm (Fig. 2) consistent with the contribution of loess (Haliva-Cohen et al., 2012), likely representing a local source.
Figure 2
Grain-size distribution in detrital samples from blocks ZA11B2 (A), ZA11B3R (B) and ZA11B5L (C). Grain-size distribution of detrital laminae C7 and C10 (numbers as in Supplementary Table S2) from block ZA11B2 showing upward fining pointing to graded bedding during flash-flood events are also shown (D)
Right
Figure 1d
Sedimentary scheme of the Ze'elim outcrop profile and radiocarbon chronology (modified from Bookman (Ken-Tor) et al., 2004). ZA11B2 sediment block represent the late 19th e early 20th centuries high-stand. ZA11B3R, ZA11B4L and ZA11B5L sediment blocks represent the Hellenistic-early Roman high-stand. Aragonite crusts were deposited in a coastal to terrestrial environment, while the aragonite laminae (discussed in this study) were deposited in a lacustrine environment. (For interpretation of the references to colour in this figure legend, the reader is referred to the web version of this article.)
click on either image to open in a new tab
Both images from López-Merino et al. (2016)
The general grain-size distribution measured from detrital laminae suggests it is composed of recycling of local and distal sources as demonstrated in previous studies (e.g. Belmaker et al., 2014). Additionally, grain-size distribution within thicker detrital laminae shows graded bedding that suggests sediment deposition during flash-flood events. This phenomenon was shown with upward fining of the grain-size distribution in specific laminae (Fig. 2D) and was also described in petrographic thin-slides (Haliva-Cohen et al., 2012). The understanding that the detrital laminae consist of both air-borne particles and recycled local (mostly Quaternary sequences) material leads to the conclusion that the palynological analysis should separate air-borne from reworked pollen. This approach is practiced in the Dead Sea sediments at a very fine detail here for the first time.
[76] Historical documentation is mostly reliable in the last two millennia. Some archeological and paleoseismic evi- dence for the events is given in the footnotes. A location map of many of the sites mentioned in Table A1 is given in Appendix B.
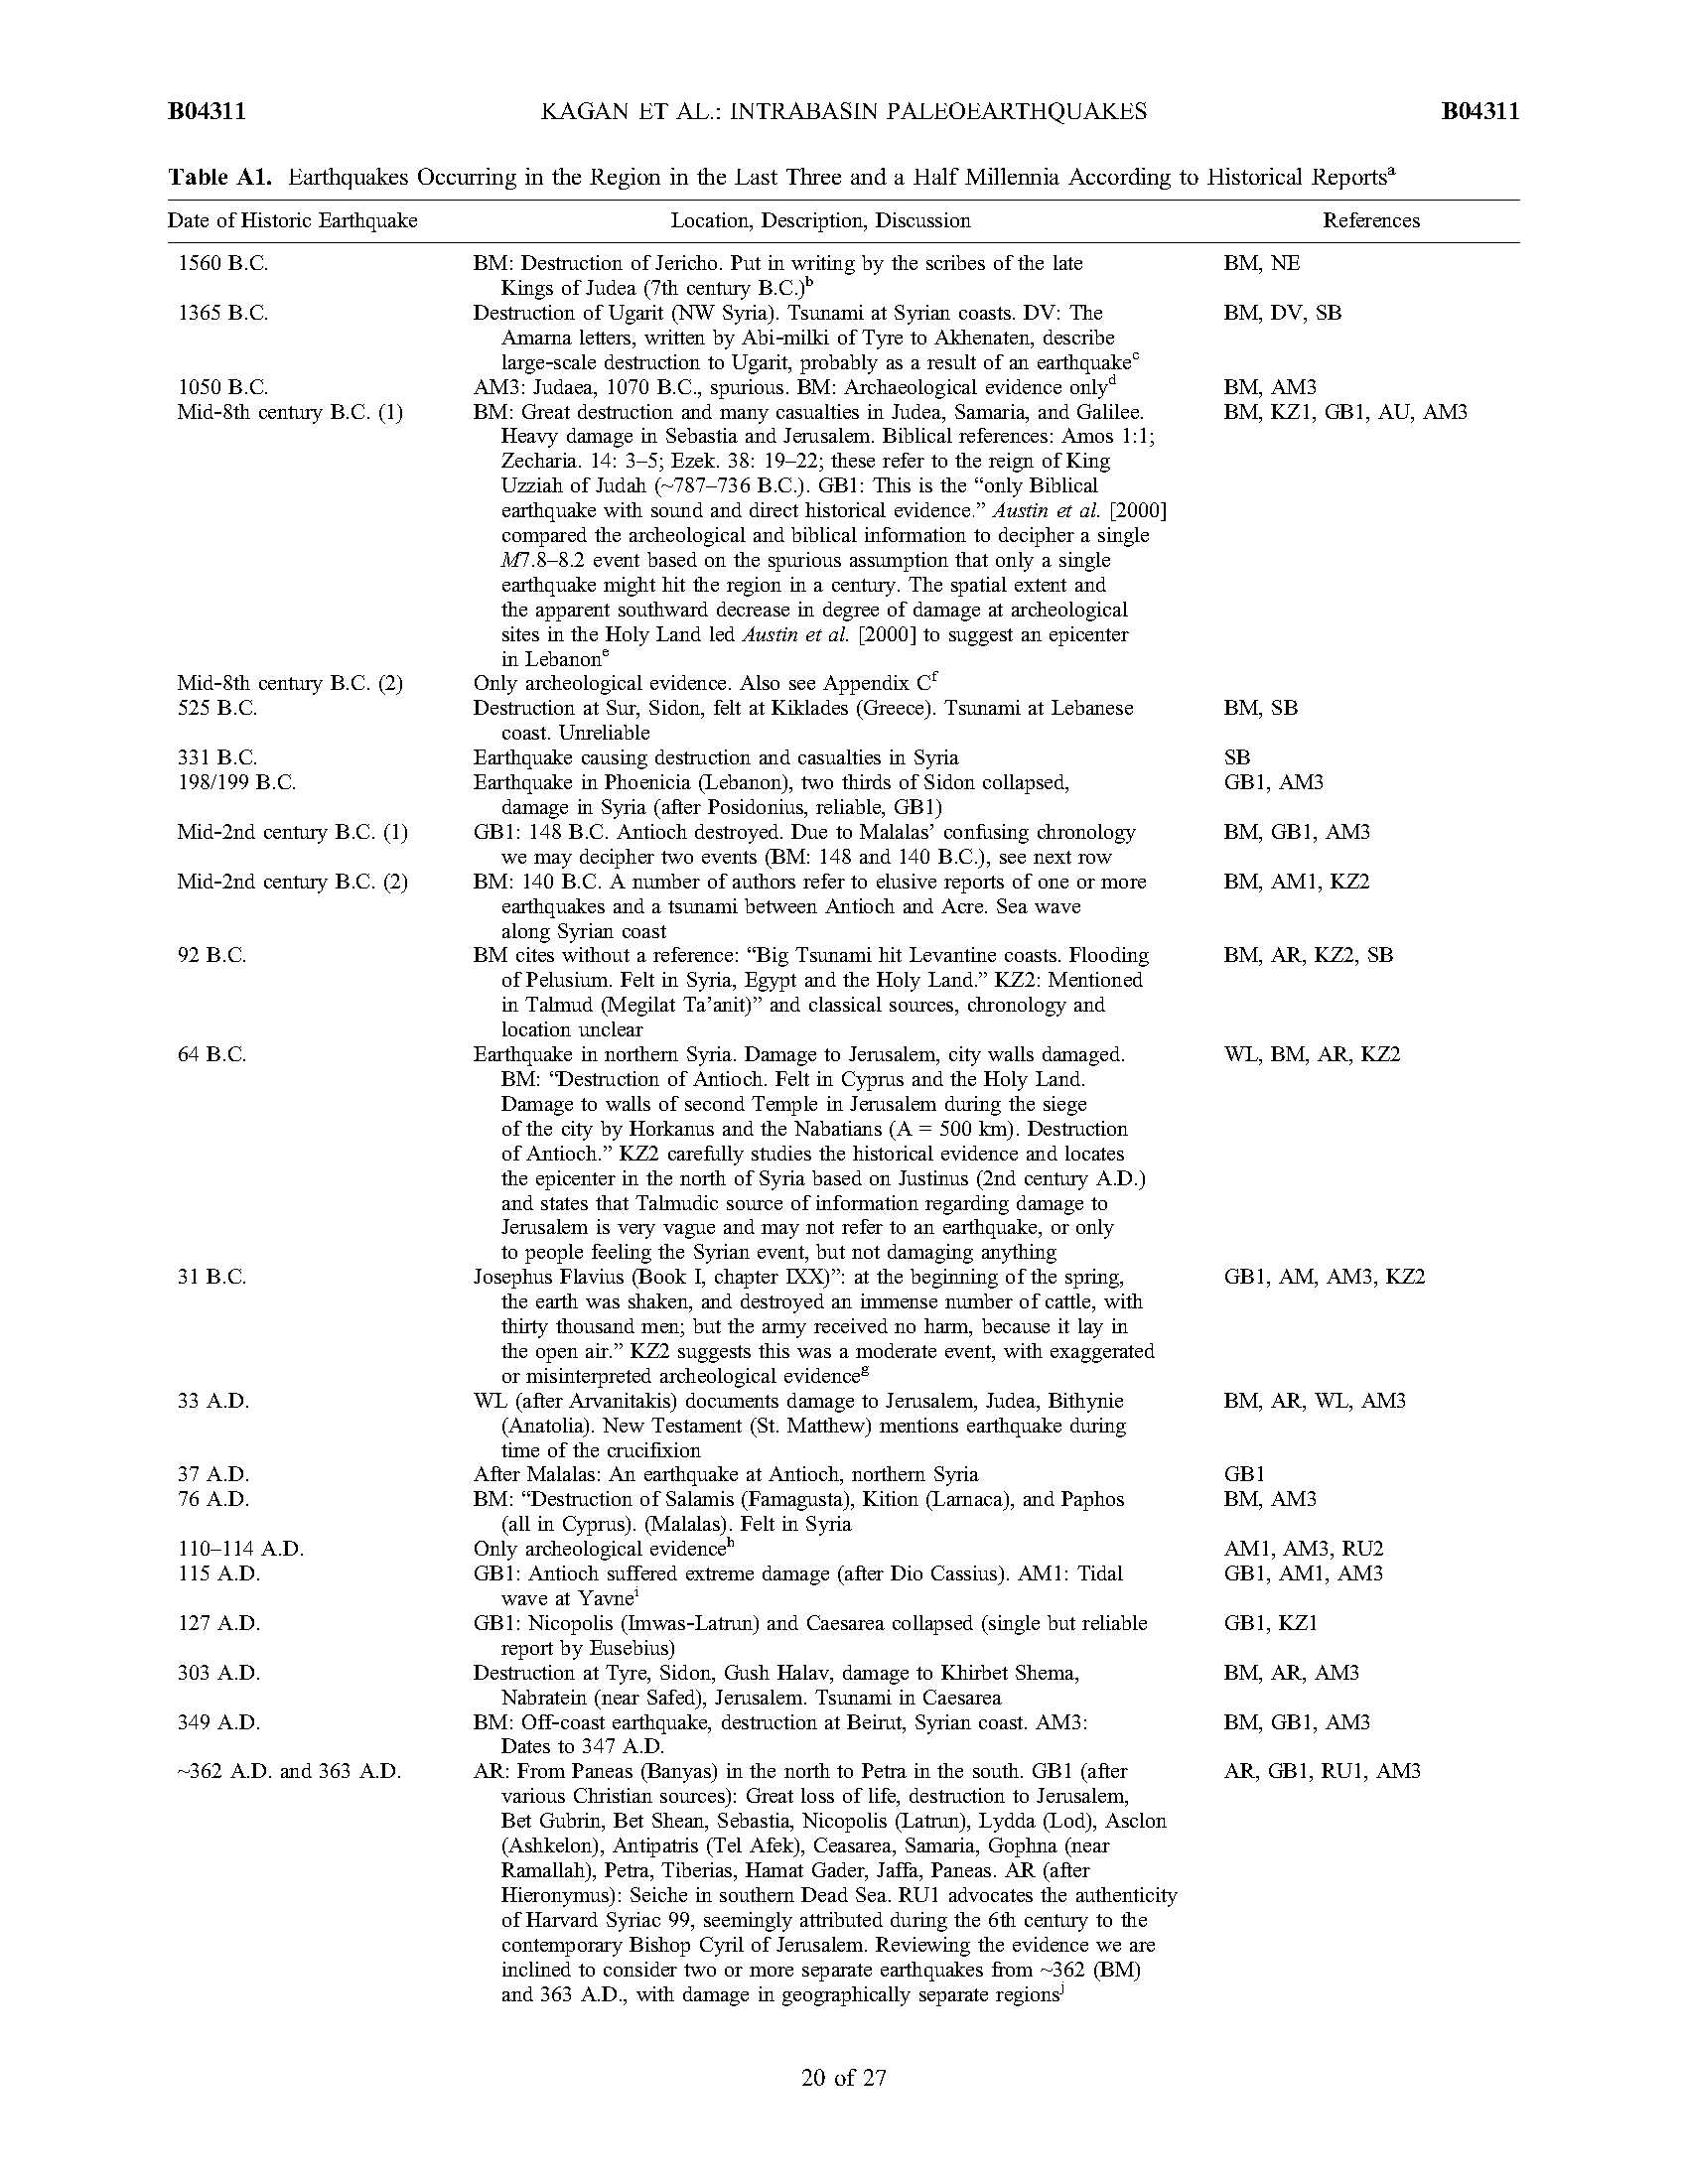
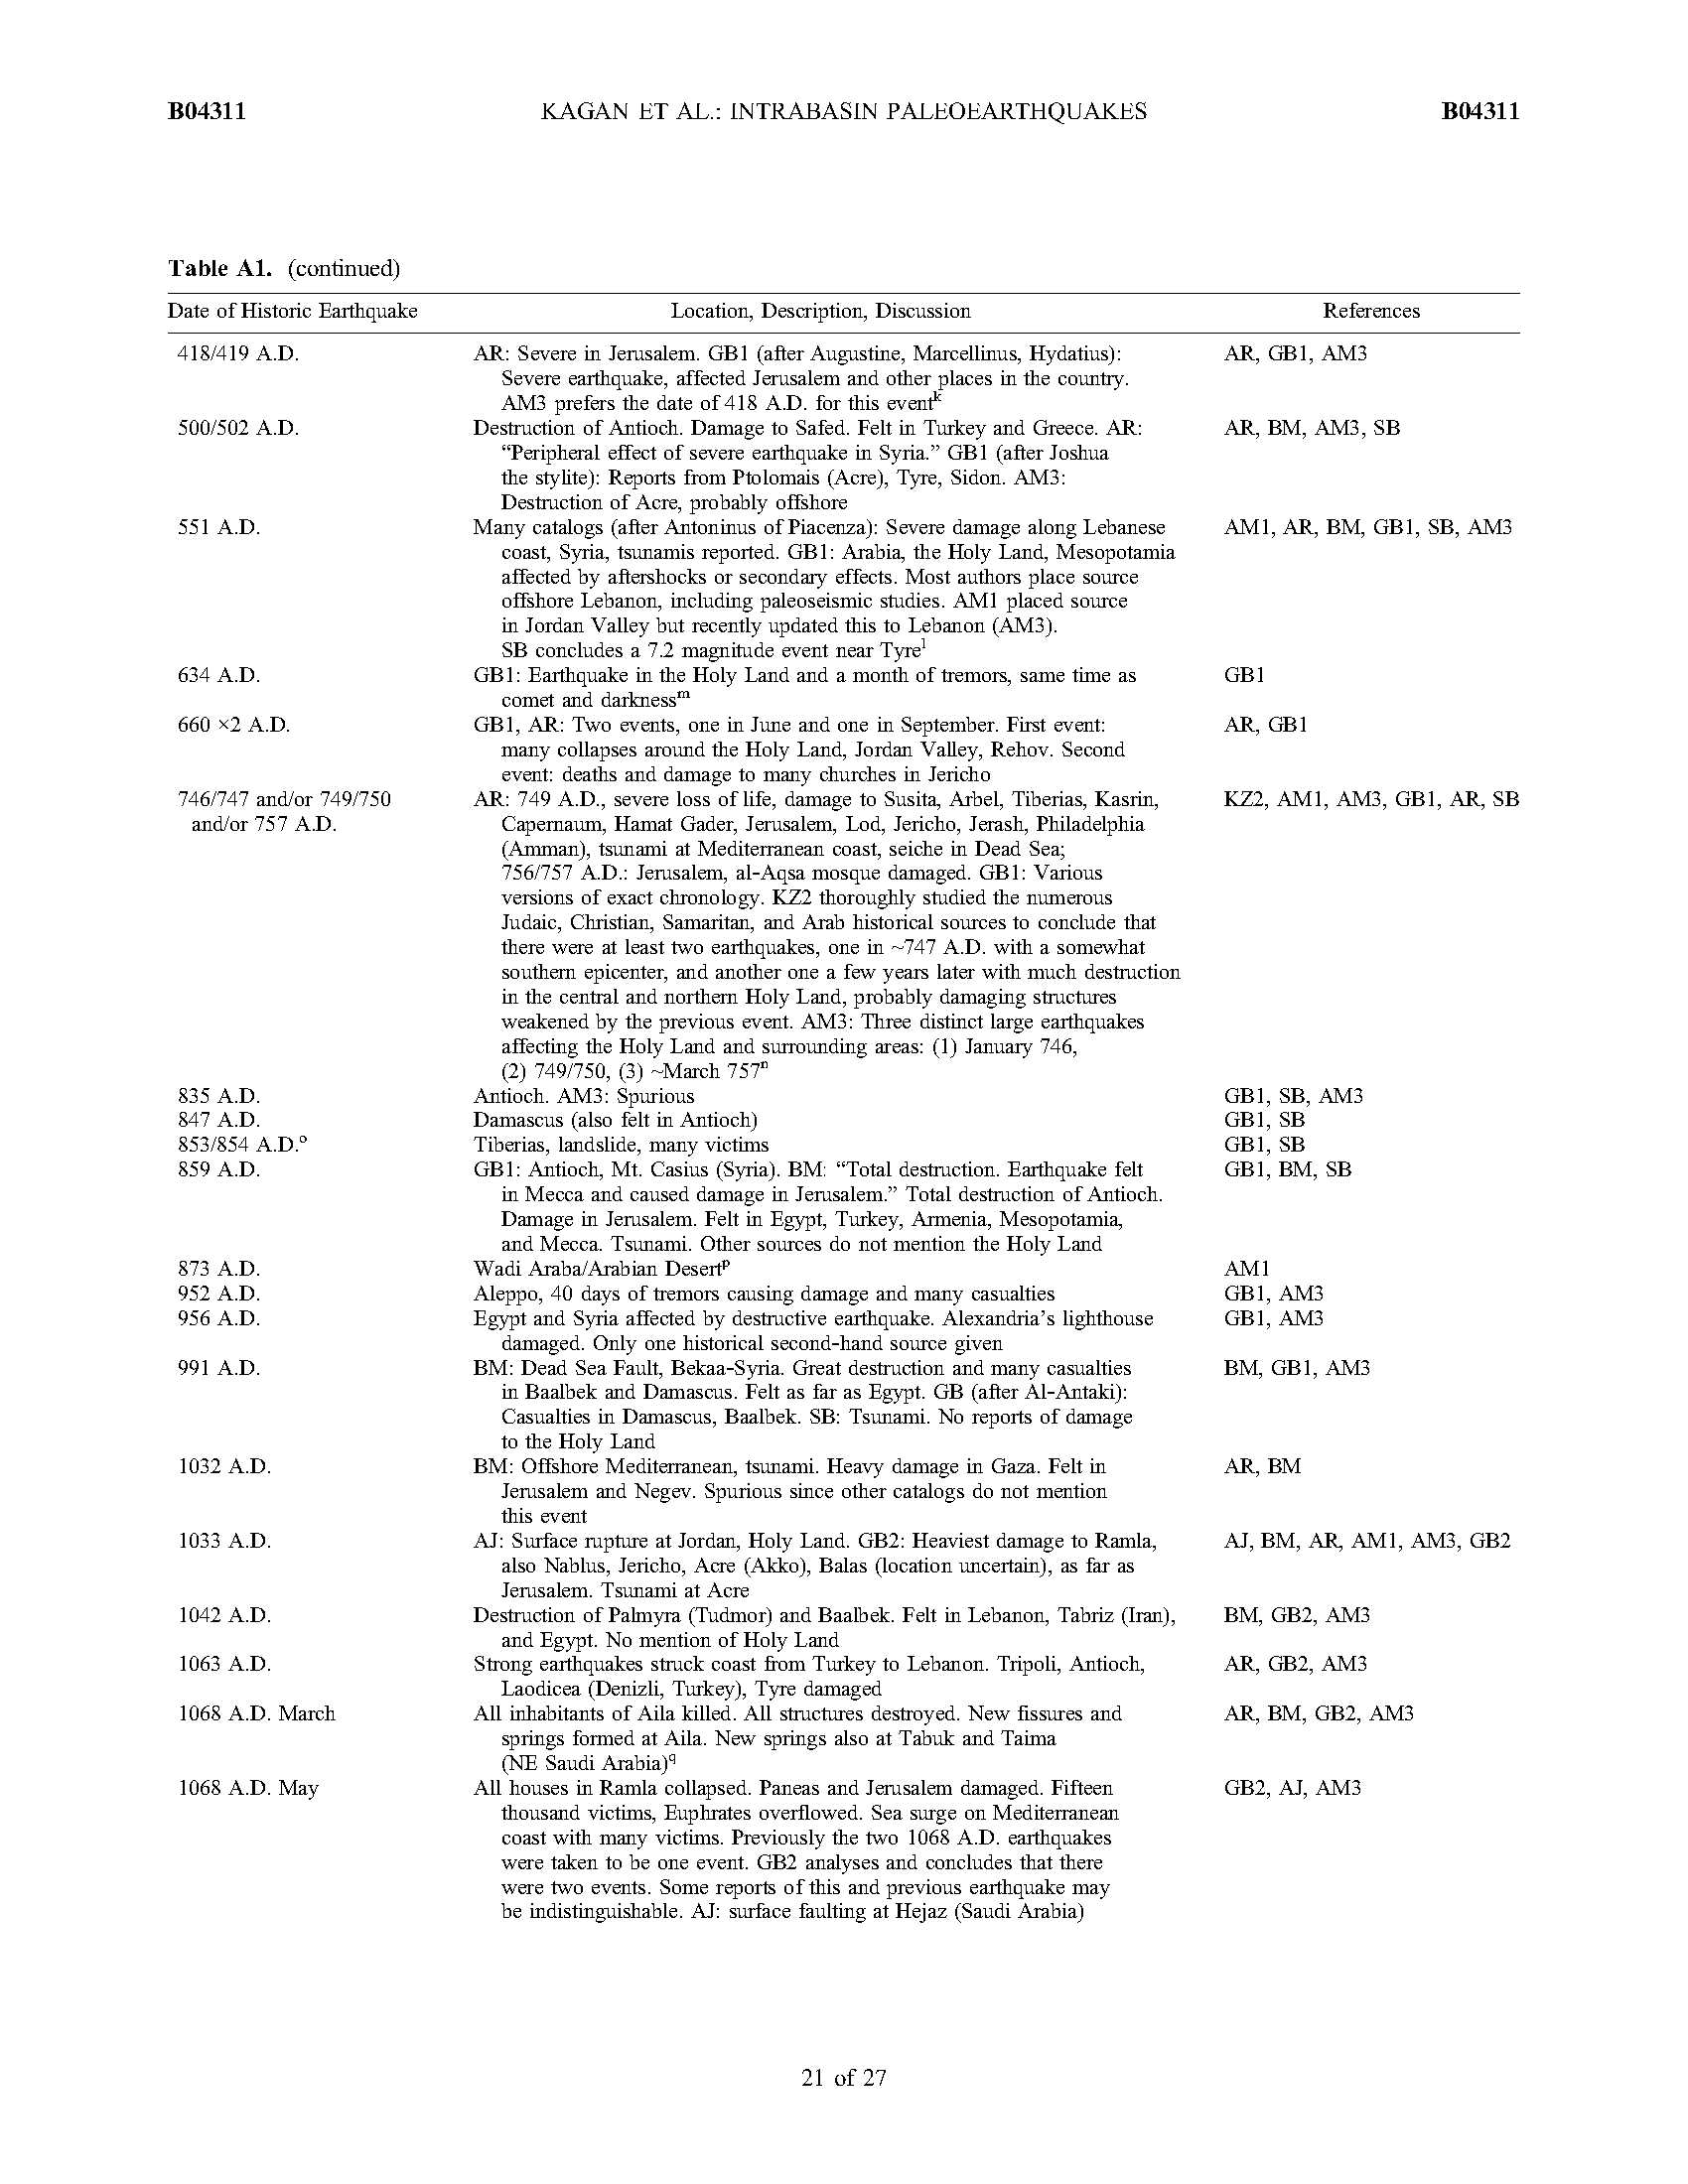
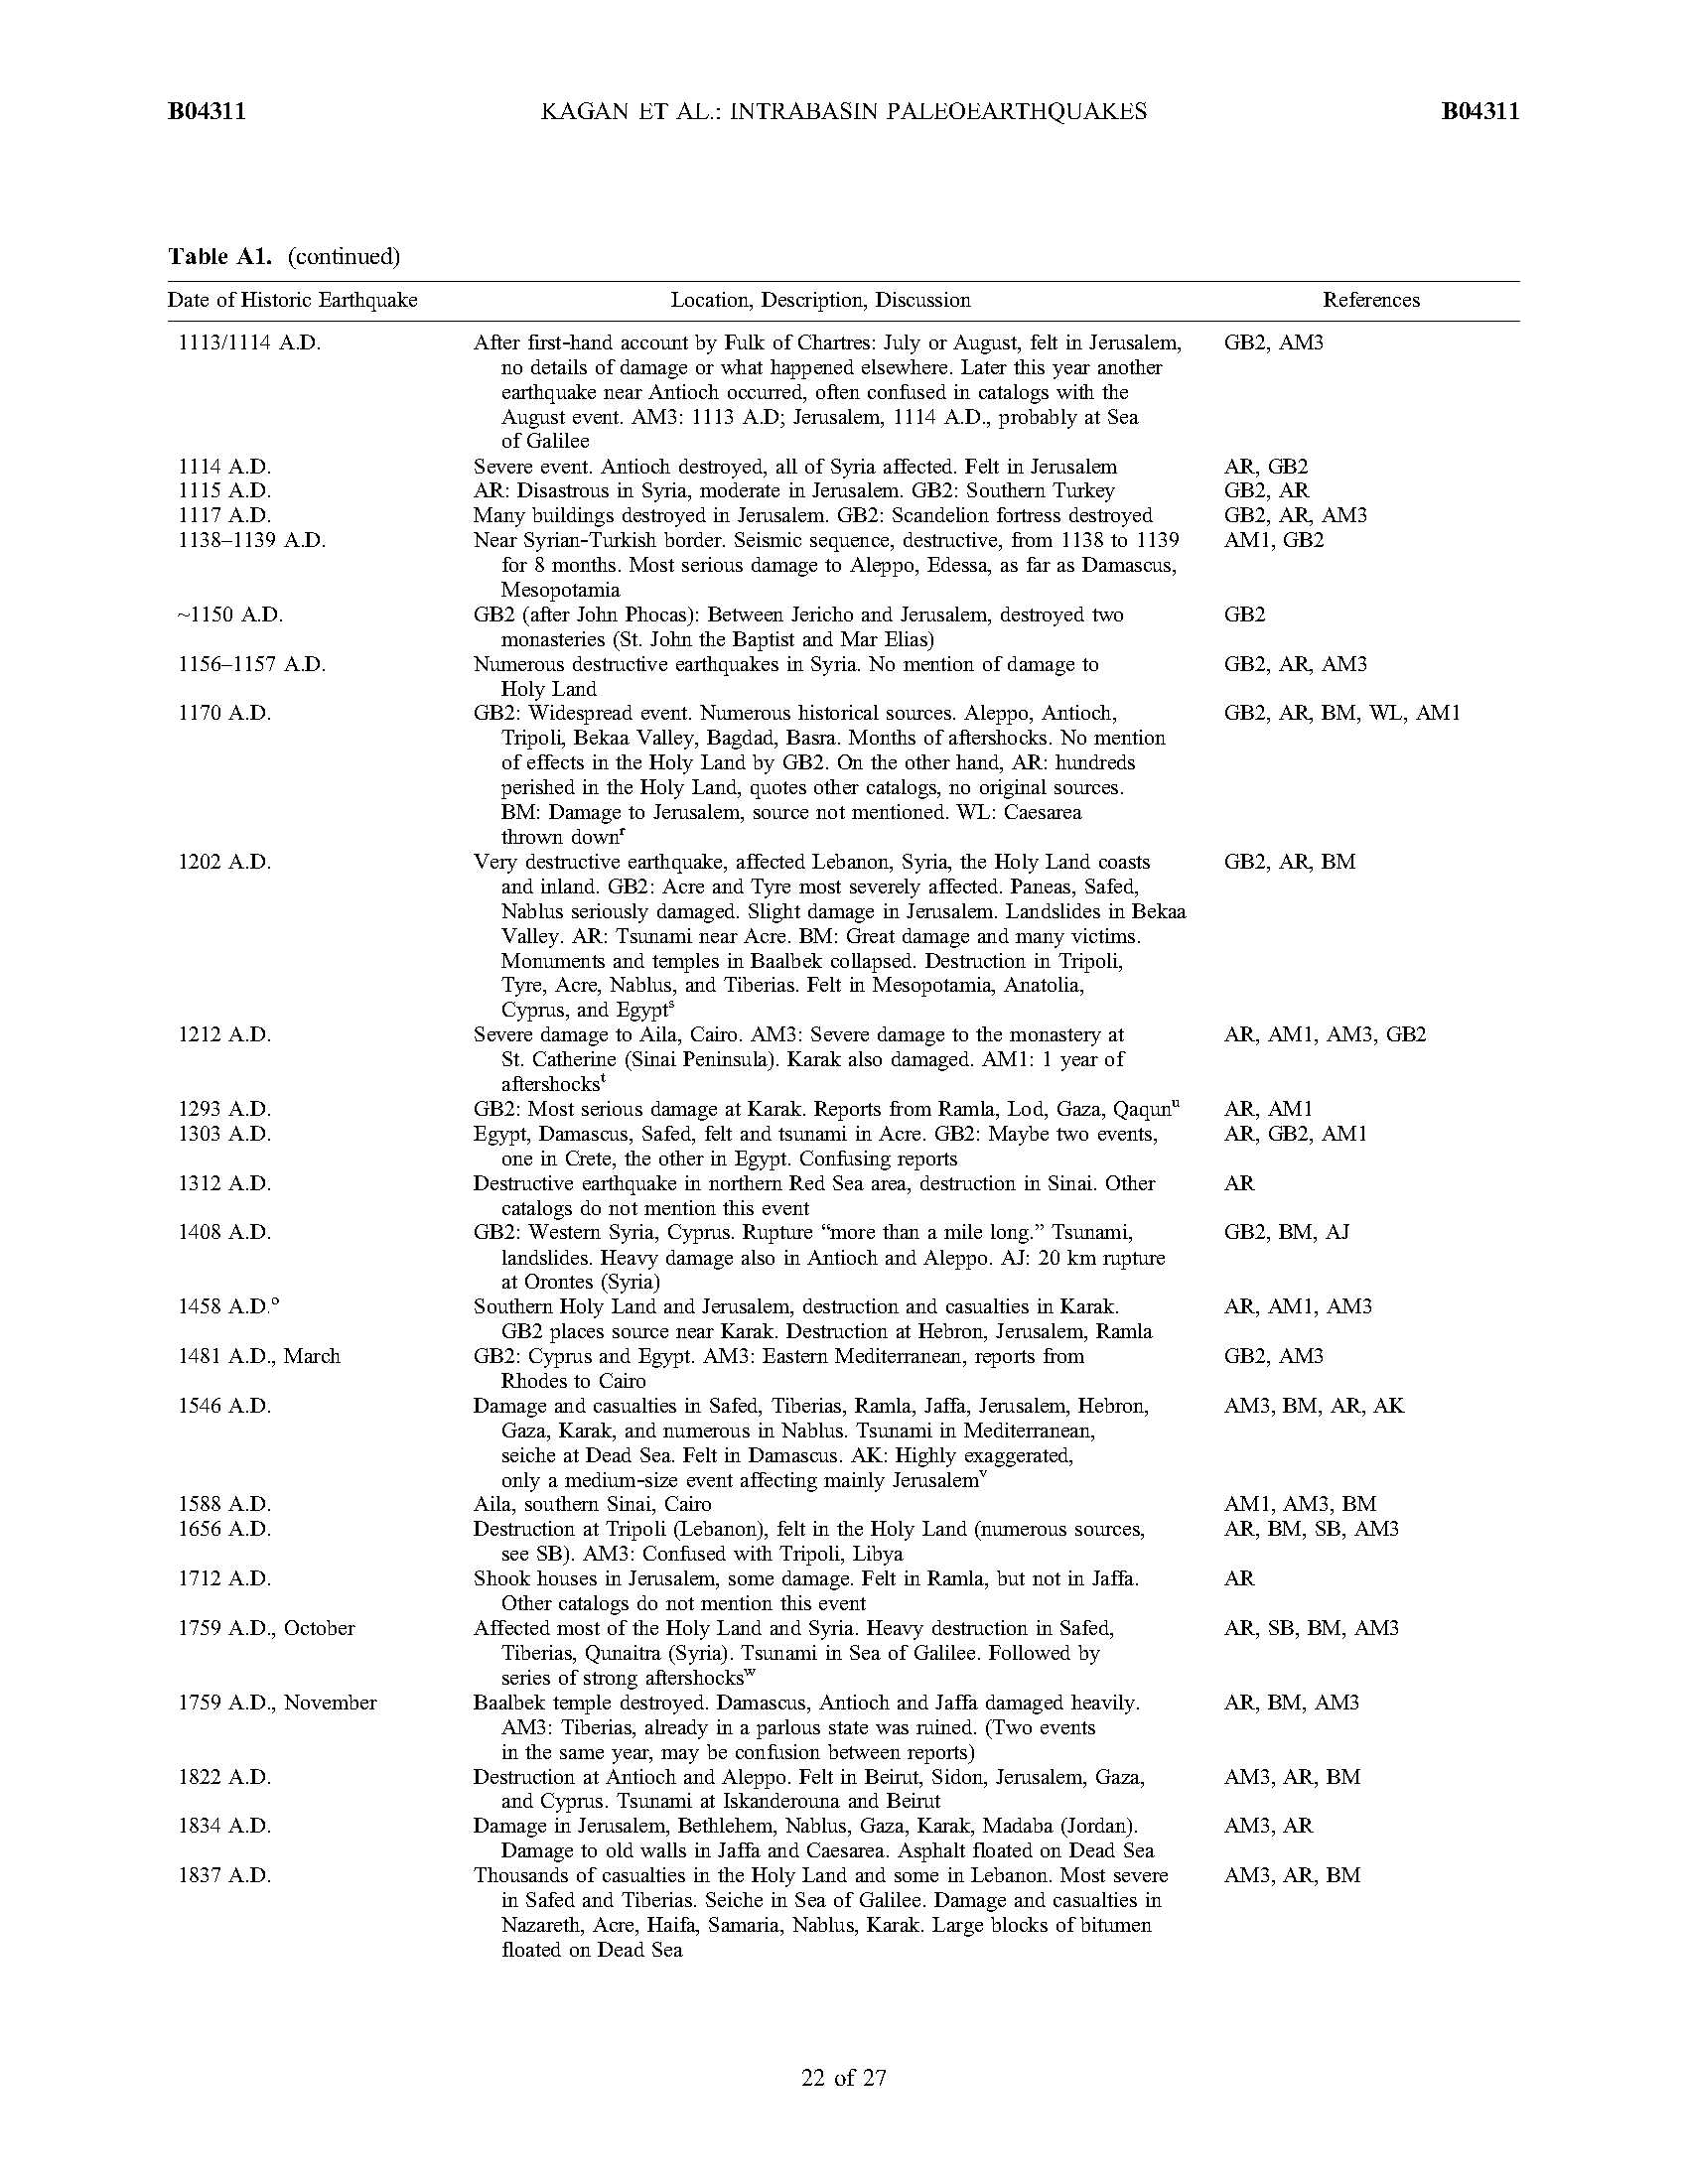
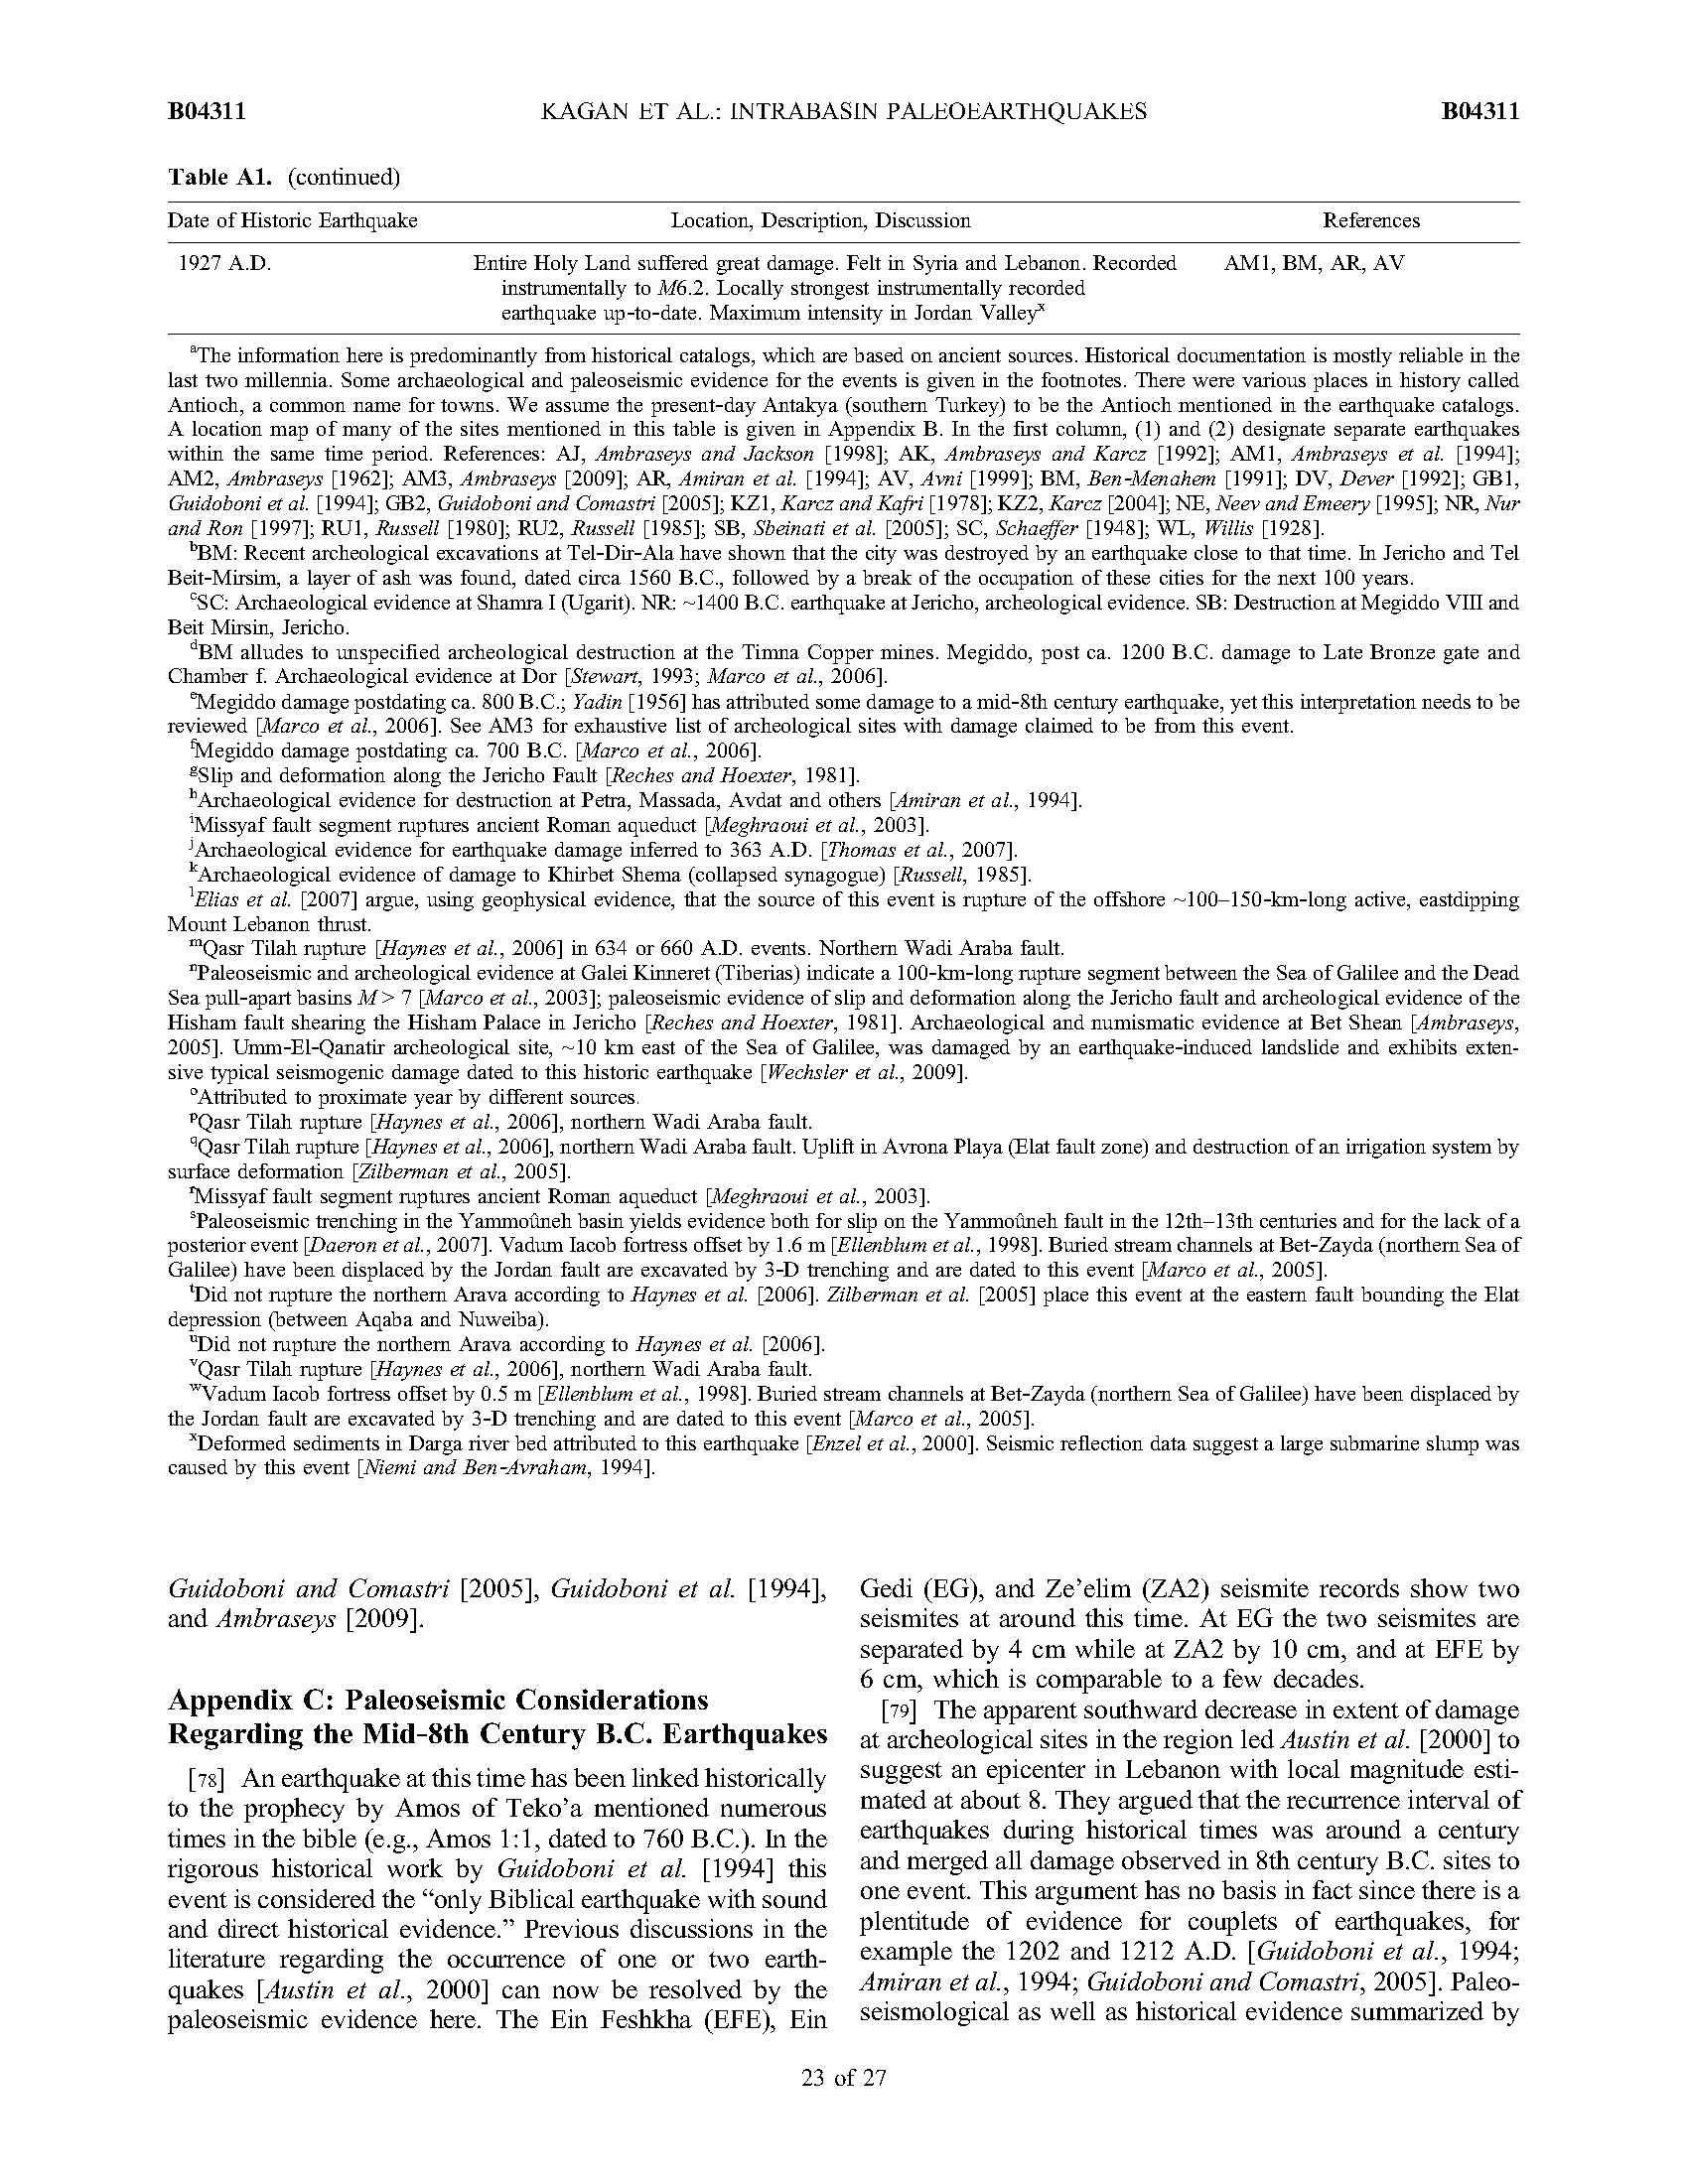
[77] Figure B1 provides a map of historical locations mentioned in the manuscript and in Appendix A, based on Google Earth (http://www.google.com/earth/index.html), Guidoboni and Comastri [2005], Guidoboni et al. [1994], and Ambraseys [2009].
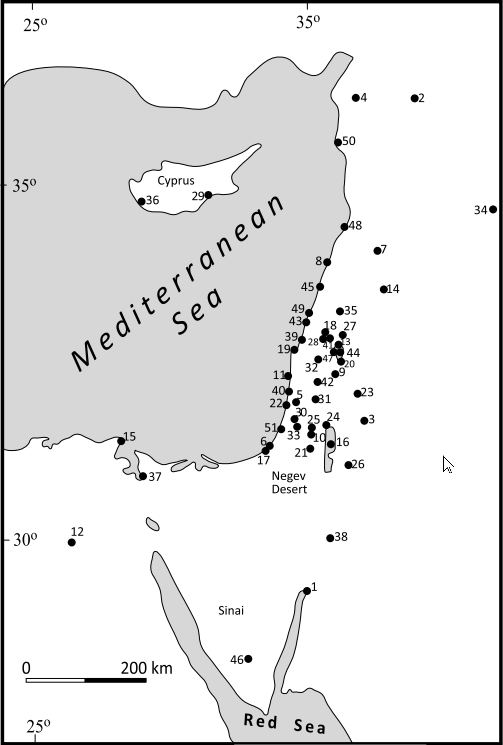
Key to map numbers; modern location names are given in parentheses:
- Aila (Aqaba)
- Aleppo (Halab)
- Amman (Philadelphia)
- Antioch
- Antipatris (Tel Afek)
- Asclon (Ashkelon)
- Baalbek
- Beirut
- Bet Shean
- Bethlehem
- Caesarea
- Cairo
- Capernaum
- Damascus
- Damietta
- Dead Sea
- Gaza
- Gush Halav–Jish
- Haifa
- Hamat Gader
- Hebron
- Jaffa
- Jerash
- Jericho
- Jerusalem
- Karak
- Kasrin (Qatzrin)
- Khirbet Shema
- Kition (Larnaca)
- Lydda (Lod) (Ramla is adjacent to Lydda)
- Nablus
- Nazareth
- Nicopolis (Imwas‐Latrun)
- Palmyra (Tudmor)
- Paneas (Banyias)
- Paphos
- Pelusium
- Petra
- Ptolemais (Acre‐Akka‐Akko)
- Qaqun (Netanya)
- Safed
- Samaria
- Scandelion (Iskandarouna)
- Sea of Galilee
- Sidon
- St. Catherine monastery (Sinai)
- Tiberias
- Tripoli
- Tyre (Sur)
- Ugarit
- Yavne
click on image to open in a new tab
Kagan et al. (2011)