Kazzab Trench
 Fig. DR2
Satellite image of Yammoûneh paleolake (ancient shoreline dashed). Main strand of Yammoûneh fault (bold white line) cuts across lacustrine deposits. There is little evidence of current strike-slip motion on either side of the basin, where the sedimentary fill abuts the limestone edges. Resistivity measurements were previously interpreted to indicate that the Yammoûneh fault cuts across the basin, offsetting vertically the underlying bedrock (Besançon, 1968).
click on image to open in a new tab
Daëron et al (2005) Supplemental
- Fig. 1 Tectonic Map from
Daeron et al (2007)
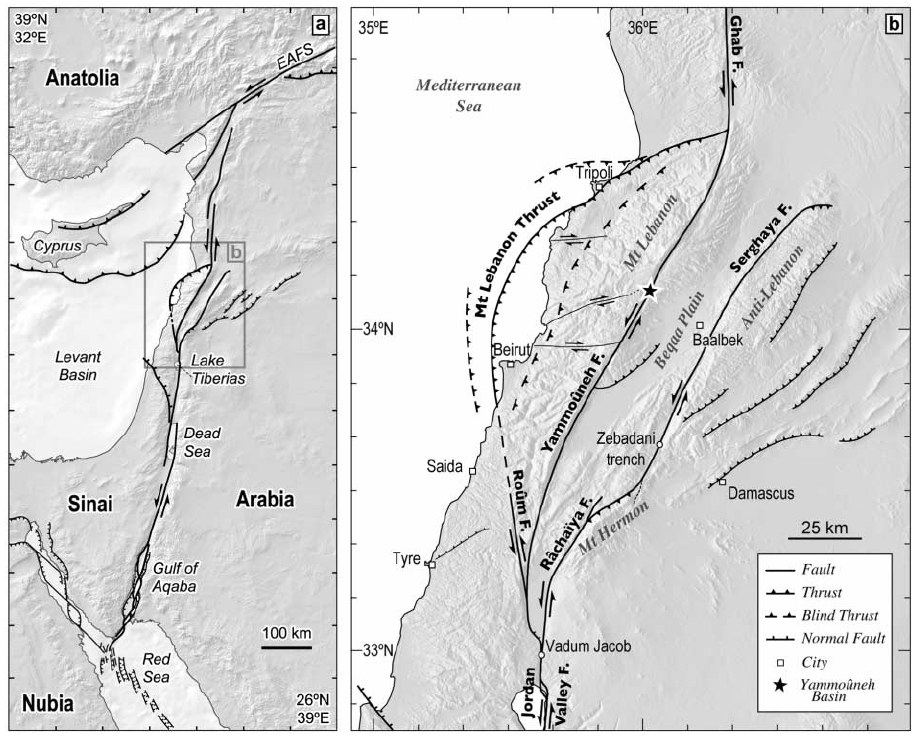 Figure 1
Regional tectonic setting.
- Map of the Levant fault system.
- Active faults of the Lebanese restraining bend.
Daeron et al (2007) - Fig. 1 Quake Rupture Lengths from
Daeron et al (2005)
 Figure 1
Schematic map of main active faults of Lebanese restraining bend: bold colored lines show maximum rupture lengths of large historical earthquakes in past 1000 yr, deduced from this study and historical documents (see discussion in text). Bold dashed lines enclose areas where intensities ≥VIII were reported in A.D. 1202 (red) and November 1759 (green) according to Ambraseys and Melville (1988) and Ambraseys and Barazangi (1989). Open symbols show location of cities (squares) and sites (circles) cited in text. Black dots mark location of field photographs shown in Figure DR1 (see footnote 1). (Inset: Levant transform plate boundary.)
Daeron et al (2005) - Fig. 4 Yammouneh basin from
Daeron et al (2005)
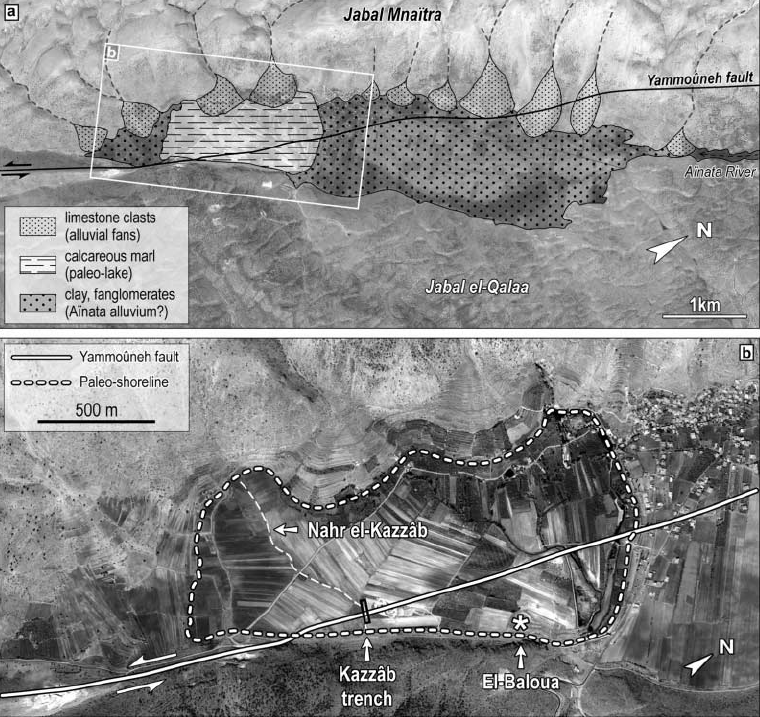 Figure 4
Maps of the Yammouneh basin.
- Quaternary geology of the basin.
- The trench (black rectangle) parallels the channel of the Nahr el-Kazzab stream (thin dashed line) where it crosses the fault (solid white line). A white star marks the location of the main karstic sinkhole (el-Baloua), where the exploratory pit of Figure 5a was excavated.
Daeron et al (2007) - Fig. 6 Geologic Map of
Lebanon from Daeron et al (2005)
 Figure 6
Geological map of Lebanon, modified from Dubertret [1955a] Active faults (in red) are discussed further in this chapter (section 1.2). Dashed line (AA’) shows the location and orientation of the cross-section of figure 21.
Daeron (2005)
- Fig. 1 Tectonic Map from
Daeron et al (2007)
Figure 1
Regional tectonic setting.
- Map of the Levant fault system.
- Active faults of the Lebanese restraining bend.
Daeron et al (2007) - Fig. 1 Quake Rupture Lengths from
Daeron et al (2005)
Figure 1
Schematic map of main active faults of Lebanese restraining bend: bold colored lines show maximum rupture lengths of large historical earthquakes in past 1000 yr, deduced from this study and historical documents (see discussion in text). Bold dashed lines enclose areas where intensities ≥VIII were reported in A.D. 1202 (red) and November 1759 (green) according to Ambraseys and Melville (1988) and Ambraseys and Barazangi (1989). Open symbols show location of cities (squares) and sites (circles) cited in text. Black dots mark location of field photographs shown in Figure DR1 (see footnote 1). (Inset: Levant transform plate boundary.)
Daeron et al (2005) - Fig. 4 Yammouneh basin from
Daeron et al (2005)
Figure 4
Maps of the Yammouneh basin.
- Quaternary geology of the basin.
- The trench (black rectangle) parallels the channel of the Nahr el-Kazzab stream (thin dashed line) where it crosses the fault (solid white line). A white star marks the location of the main karstic sinkhole (el-Baloua), where the exploratory pit of Figure 5a was excavated.
Daeron et al (2007) - Fig. 6 Geologic Map of
Lebanon from Daeron et al (2005)
Figure 6
Geological map of Lebanon, modified from Dubertret [1955a] Active faults (in red) are discussed further in this chapter (section 1.2). Dashed line (AA’) shows the location and orientation of the cross-section of figure 21.
Daeron (2005)
- Fig. 2 Overview of Yammouneh basin
from Daeron et al (2007)
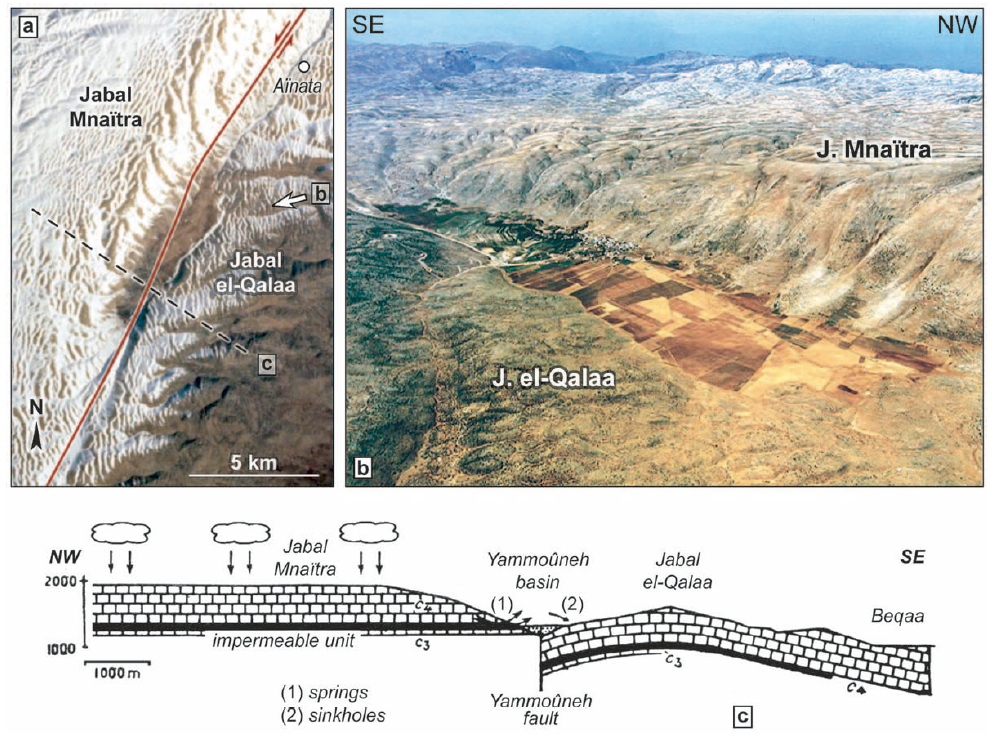 Figure 2
Overview of the Yammouneh basin.
- Satellite image of the basin,between the Mnaitra plateau and the Qalaa hills. The white arrow indicates the viewpoint of (b), and the red line marks the active trace of the Yammouneh fault. The location of the town of Ainata is marked by a white circle.
- West-southwest-looking,oblique aerial photograph of the basin.
- Simplified geological cross section, modified from Dubertret (1975, Baalbek sheet).
Daeron et al (2007) - Fig. 2 Active fault traces
north and south of Yammouneh basin from Daeron et al (2007)
 Figure 3
Active fault trace south and north from the Yammouneh basin.
- south-looking view of the paleolake (darker infill area). The active trace of the fault (white arrows) runs along the west flank of a limestone ridge aligned with the east margin of the basin.
- south-looking view of the Yammouneh fault above the village of Ainata. Cumulative slip has formed several asymmetric, scarp-bounded, limestone shutter ridges (white arrows). Distance between the arrows is 400 m.
Daeron et al (2007) - Fig. DR1 Fault scarplets on
Yammoûneh, Serghaya, and Râchaïya faults from Daëron et al (2005:Supplemental)
 Fig. DR1
Comparison of weathered seismic scarplet (highlighted by white arrows) on Yammoûneh fault (A) with fresher seismic scarplet on Serghaya fault (B,C) and well-preserved mole-tracks on Râchaïya fault (D). (locations on Fig. 1)
Daëron et al (2005) Supplemental - Location of Kazzab Trench
in Google Earth
 Location of Kazzab Trench (in magenta)
click on image to explore this site on a new tab in Google Earth
- Fig. 2 Overview of Yammouneh basin
from Daeron et al (2007)
Figure 2
Overview of the Yammouneh basin.
- Satellite image of the basin,between the Mnaitra plateau and the Qalaa hills. The white arrow indicates the viewpoint of (b), and the red line marks the active trace of the Yammouneh fault. The location of the town of Ainata is marked by a white circle.
- West-southwest-looking,oblique aerial photograph of the basin.
- Simplified geological cross section, modified from Dubertret (1975, Baalbek sheet).
Daeron et al (2007) - Fig. 2 Active fault traces
north and south of Yammouneh basin from Daeron et al (2007)
Figure 3
Active fault trace south and north from the Yammouneh basin.
- south-looking view of the paleolake (darker infill area). The active trace of the fault (white arrows) runs along the west flank of a limestone ridge aligned with the east margin of the basin.
- south-looking view of the Yammouneh fault above the village of Ainata. Cumulative slip has formed several asymmetric, scarp-bounded, limestone shutter ridges (white arrows). Distance between the arrows is 400 m.
Daeron et al (2007) - Fig. DR1 Fault scarplets on
Yammoûneh, Serghaya, and Râchaïya faults from Daëron et al (2005:Supplemental)
Fig. DR1
Comparison of weathered seismic scarplet (highlighted by white arrows) on Yammoûneh fault (A) with fresher seismic scarplet on Serghaya fault (B,C) and well-preserved mole-tracks on Râchaïya fault (D). (locations on Fig. 1)
Daëron et al (2005) Supplemental
Figure 4Maps of the Yammouneh basin.
- Quaternary geology of the basin.
- The trench (black rectangle) parallels the channel of the Nahr el-Kazzab stream (thin dashed line) where it crosses the fault (solid white line). A white star marks the location of the main karstic sinkhole (el-Baloua), where the exploratory pit of Figure 5a was excavated.
The Kazzab trench is located in a paleolake in the Yammouneh basin on the eastern flank of Mount Lebanon. Daëron et al (2005:530) described the location as follows:
The floor of [the] closed pull-apart basin used to be flooded each year by meltwater from karstic resurgences (Besancon, 1968). The lake was artificially dried 70 yr ago, and is now a cultivated plain. Aerial photographs and high-resolution satellite images show that the trace of the active strike-slip fault shortcuts the pull-apart (Fig. DR2). This geometry is clear from changes in soil color and vegetation, as well as inflections or offsets of gullies. Trenching on the east side of the paleolake (Fig. DR2) confirmed the location of the main fault, which cuts a finely stratified, subtabular sequence of lake bedsDaëron et al (2007) identified 10-13 seismic events extending back more than ~12kyr.
Fig. DR2Satellite image of Yammoûneh paleolake (ancient shoreline dashed). Main strand of Yammoûneh fault (bold white line) cuts across lacustrine deposits. There is little evidence of current strike-slip motion on either side of the basin, where the sedimentary fill abuts the limestone edges. Resistivity measurements were previously interpreted to indicate that the Yammoûneh fault cuts across the basin, offsetting vertically the underlying bedrock (Besançon, 1968).
Daëron et al (2005) Supplemental
 Figure 7
Log of wall K. The corresponding photomosaic is shown in Plate 1. White labels indicate the stratigraphic levels of event horizons. White corners in the deeper fault zone correspond to the outline of Figure 9c. White star marks the location of similar star in Plate 1 and Figure 9a,b.
click on image to open in a new tab
Daeron et al (2007)
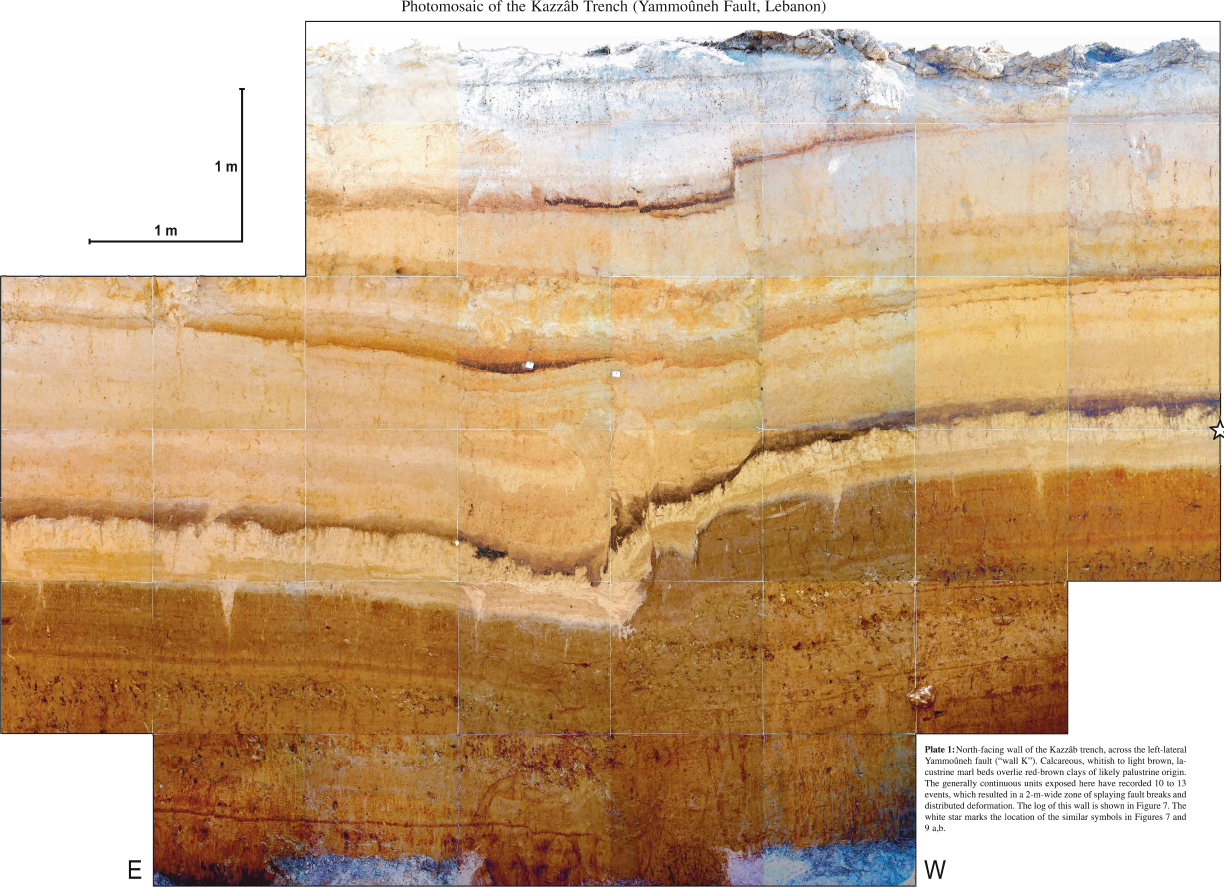 Plate 1
Photomosaic of the Kazzab Trench (Yammouneh Fault, Lebanon)
North facing wall of the Kazzab trench, across the left lateral Yammouneh fault ('wall K'). Calcareous, whitish to light brown, lacustrine marl beds overlie red-brown clays of likely palustrine origin. The generally continuous units exposed here have recorded 10 to 13 events, which resulted in a 2 m wide zone of splaying fault breaks and distributed deformation. The log of this wall is shown in Figure 7. The white star marks the location of the similar symbols in Figures 7 and 9 a,b.
click on image to open in a new tab
Daeron et al (2007)
 Figure 8
Wall G.
- Photograph of trench wall G.
- Corresponding log, with labels marking the stratigraphic levels of event horizons. The shaded area in the lower part of the log corresponds to backfill and rough parts of the wall.
click on image to open in a new tab
Daeron et al (2007)
 Figure 6
Stratigraphic log of the Kazzab sediments, east (E) and west (W) of the fault zone, with vertical positions of dated samples and event horizons. The main sedimentary sequences (I–VII) are shown left of the stratigraphic columns, as well as a plot of the calibrated ages of radiocarbon samples versus depth (cf. Table 4).
Daeron et al (2007)
 Table 3
Detailed Stratigraphic Units
Daeron et al (2007)
 Table 4
Radiocarbon Dates
click on imagw top open in a new tab
Daeron et al (2007)
 Figure 10
“Historical” series of events. Time probability distributions (TPDs) in light gray are calibrated using terrestrial curve IntCal04 (Reimer et al., 2005). Dark-grayTPDs are modeled using OxCal 4β3 (Bronk Ramsey, 1995, 2001), according to the Bayesian model discussed in the text, and the resulting TPD of events S1–3 are plotted in black.Horizontal bars correspond to 95.4% confidence limits.
Daeron et al (2007)
 Figure 11
“Prehistoric” series of events. Time probability distributions (TPDs) in light gray are calibrated using terrestrial curve IntCal04 (Reimer et al., 2005). Dark-gray TPDs are modeled using OxCal 4β3 (Bronk Ramsey, 1995, 2001), according to the Bayesian model discussed in the text, with subsequences displayed as rectangles, and phases (unordered groups) as rounded boxes. The resulting TPDs of events S7–12 are plotted in black. Horizontal bars correspond to 95.4% confidence limits.
Daeron et al (2007)
 Figure 13
Seismic return intervals. Time probability distributions (TPDs) of the various intervals elapsed between consecutive events in the Kazzab record are plotted in gray. The narrower, black TPD is that of the mean return time at this site between ~12 and ~6.4 ka. The uncertainty on this mean return time does not reflect variability in the length of individual seismic cycles. Horizontal bars correspond to 95.4% confidence limits. Dashed line indicates the 804 yr currently elapsed since the latest event (A.D.1202).
Daeron et al (2007)
 Table 5
Stratigraphic and Chronological Constraints on Event Ages.
Daeron et al (2007)
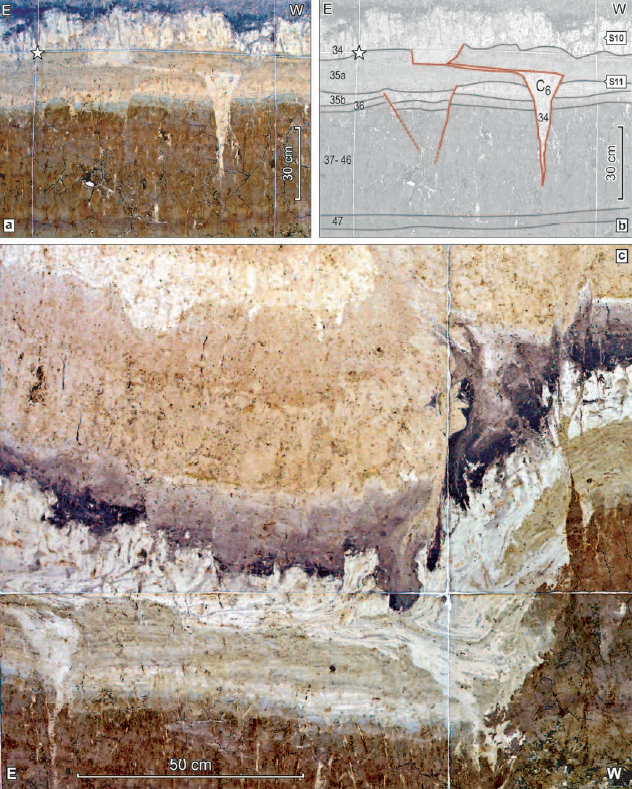 Figure 9
Examples of coseismic deformation.
(a, b) One of several bayonet-shaped cracks that systematically open in L35, taper down to L44–45, and are filled with L34 (see discussion in text). Note the shallow decollement in L35a. The dark bioturbation marks in L34 appear to be unaffected by the crack. The white star shows the location of the similar stars in Plate 1 and Figure 7.
(c) Pre-existing bioturbation marks record east-directed flow of whitish marl (L34) in the fault zone. The outline of this photograph is shown as white corners in Figure 7.
Daeron et al (2007)
 Figure 5 b and c
Exposures in Kazzab trench.
(b) Marl/clay interface
(c) calcareous nodules
Daeron et al (2007)
In order to summarize the events recorded in the Kazzabˆ trench, here is a series of sketches outlining the succession of sedimentation and coseismic deformation that we propose
- Daëron (2005)


Table 5 summarizes the stratigraphic constraints relevant to each event described previously. S1, ?S2, and S3 are well constrained by six radiocarbon dates from sequence I (Fig. 10). K23 and G3 were sampled in units unambiguously postdating S1. We interpret L3b2 as a postseismic colluvial wedge derived from L3c material, implying that G1 predates S1. Event ?S2, in turn, predates G1 and postdates K64. Sample G4 is clearly out of sequence, being older than K64 and similar in age to G5, which are located 16 and 40 cm below it, respectively (cf. Table 4 and Fig. 6). Event S3 predates K64 and postdates both samples G5 and K29. Figure 10 displays the output of an OxCal Bayesian model for this sequence:
K29 > G5 > S3 > K64 > ?S2 > G1 > S1 > G3 > K23,
where the > sign denotes “is older than.” The age bounds predicted by the model are listed in Table 5.
The events recorded between layers L10 and L19b can only be very loosely constrained to have occurred between 2.0 and 6.4 cal kyr B.P., due to the scarcity of radiocarbon data. Until the sedimentary history of sequence II is elucidated, one cannot assume that our record of events is complete in this section of the trench. Moreover, the ambiguous evidence for ?S5 and ?S6 further detracts from an estimate of the total number of events between 6.4 and 2.0 ka. Because the sedimentary sequence between L10 and L11 appears to be continuous, one could argue that a reasonable age estimate for S4 can be obtained from extrapolating the sedimentation rate in sequence I to the base of L10 (cf. Fig. 6). Doing so would place S4 some time around 2.5–3.0 ka.
The timing of the events recorded in sequences III–V, by contrast, is constrained by numerous dated samples. Excluding samples K43 and K120, which are out of stratigraphic order (cf. Fig. 6), the stratigraphic relationships between event horizons and radiocarbon samples can be summarized as:

where parenthesized groups represent phases (unordered sets of dates) and the ≈ symbol denotes similar ages. As noted earlier, we interpret S7 to be roughly coeval with layer L19b, where samples K111, K13a, and K13a were collected. Similarly, the stratigraphic position of sample K93 corresponds roughly to that of the S12 horizon. In the absence of an older sample that would allow for a more robust dating of S12, we use the age of K93 as our best estimate of the timing of S12. The corresponding OxCal model is displayed in Figure 11, and resulting age bounds are reported in Table 5.
Finally, the S13 horizon lies more than 1 m below the oldest dated sample, K93, and as a result its timing can only be constrained to be significantly older than ~12 ka.
- Fig. DR1 Fault scarplets on
Yammoûneh, Serghaya, and Râchaïya faults from Daëron et al (2005:Supplemental)
Fig. DR1
Comparison of weathered seismic scarplet (highlighted by white arrows) on Yammoûneh fault (A) with fresher seismic scarplet on Serghaya fault (B,C) and well-preserved mole-tracks on Râchaïya fault (D). (locations on Fig. 1)
Daëron et al (2005) Supplemental - Fig. 1 Location Map
from Daëron et al (2005)
Figure 1
Schematic map of main active faults of Lebanese restraining bend: bold colored lines show maximum rupture lengths of large historical earthquakes in past 1000 yr, deduced from this study and historical documents (see discussion in text). Bold dashed lines enclose areas where intensities ≥VIII were reported in A.D. 1202 (red) and November 1759 (green) according to Ambraseys and Melville (1988) and Ambraseys and Barazangi (1989). Open symbols show location of cities (squares) and sites (circles) cited in text. Black dots mark location of field photographs shown in Figure DR1 (see footnote 1). (Inset: Levant transform plate boundary.)
Daeron et al (2005) - Fig. DR2 Satellite
image of Yammoûneh paleolake from Daëron et al (2005:Supplemental)
Fig. DR2
Satellite image of Yammoûneh paleolake (ancient shoreline dashed). Main strand of Yammoûneh fault (bold white line) cuts across lacustrine deposits. There is little evidence of current strike-slip motion on either side of the basin, where the sedimentary fill abuts the limestone edges. Resistivity measurements were previously interpreted to indicate that the Yammoûneh fault cuts across the basin, offsetting vertically the underlying bedrock (Besançon, 1968).
Daëron et al (2005) Supplemental - Table DR3: Radiocarbon
dates from Daëron et al (2005:Supplemental)
 Table DR3: Radiocarbon dates
Most of the catchments around the paleolake being steep and short (less than 4 km), it is unlikely that the dated charcoals were stored for very long before deposition. AMS measurements were made at Van de Graaff laboratory of Utrecht University (‘G’ samples) and at CAMS of Lawrence Livermore National Laboratory (‘K’ samples); ages were calibrated using OxCal 3.9 (Bronk Ramsey, 1995; 2001) and calibration curve INTCAL98 (Stuiver et al., 1998); calibrated ages exclude ranges with probability less than 2%, and bold ages represent most likely range (at least 80%); (*) means d13C was assumed but not measured; [r] is for reworked samples
Daëron et al (2005) Supplemental
- Fig. DR1 Fault scarplets on
Yammoûneh, Serghaya, and Râchaïya faults from Daëron et al (2005:Supplemental)
Fig. DR1
Comparison of weathered seismic scarplet (highlighted by white arrows) on Yammoûneh fault (A) with fresher seismic scarplet on Serghaya fault (B,C) and well-preserved mole-tracks on Râchaïya fault (D). (locations on Fig. 1)
Daëron et al (2005) Supplemental - Fig. 1 Location Map
from Daëron et al (2005)
Figure 1
Schematic map of main active faults of Lebanese restraining bend: bold colored lines show maximum rupture lengths of large historical earthquakes in past 1000 yr, deduced from this study and historical documents (see discussion in text). Bold dashed lines enclose areas where intensities ≥VIII were reported in A.D. 1202 (red) and November 1759 (green) according to Ambraseys and Melville (1988) and Ambraseys and Barazangi (1989). Open symbols show location of cities (squares) and sites (circles) cited in text. Black dots mark location of field photographs shown in Figure DR1 (see footnote 1). (Inset: Levant transform plate boundary.)
Daeron et al (2005) - Fig. DR2 Satellite
image of Yammoûneh paleolake from Daëron et al (2005:Supplemental)
Fig. DR2
Satellite image of Yammoûneh paleolake (ancient shoreline dashed). Main strand of Yammoûneh fault (bold white line) cuts across lacustrine deposits. There is little evidence of current strike-slip motion on either side of the basin, where the sedimentary fill abuts the limestone edges. Resistivity measurements were previously interpreted to indicate that the Yammoûneh fault cuts across the basin, offsetting vertically the underlying bedrock (Besançon, 1968).
Daëron et al (2005) Supplemental
Daëron et al (2005:529-530) discuss how surface faulting evidence may distinguish fault breaks of 1202 vs. 1759
The areas of maximum destruction of the 1202 and November 1759 events overlap, covering an elongated, 150–200-km-long, south southwest–trending zone centered on the Beqaa plain (Fig. 1). Historical accounts of damage thus imply that the events originated on the Yammouneh or Serghaya fault. Macroseismic isoseismal contours tend to be biased toward populated areas: here, the fertile Beqaa Plain. It is therefore impossible to use such data alone to discriminate between the two faults.
The identification and localization of surface faulting associated with the 1202 and 1759 events provides additional clues to determine the faults involved. Archeological and paleoseismic investigation (Ellenblum et al., 1998)1 showed that the 1202 earthquake caused 1.6 m of left-lateral displacement of fortification walls at Vadum Jacob (Fig. 1). A later 0.5 m offset may correspond either to the October 1759 event or to the last large regional event of 1 January 1837 (Ambraseys, 1997). The castle at Vadum Jacob is located south of the junction between the Yammouneh and Rachaıya-Serghaya faults, so the question of which fault took up slip to the north during either event remains open. On the Serghaya fault, in the southern Zebadani valley in Syria Gomez et al. (2001)2 described evidence of recent faulting in the form of a persistent free face 0.5 m high on a scarp cutting soft lacustrine sediments. Trenching in this area, Gomez et al. (2003) exposed a colluvial wedge with modern 14C ages, implying that the latest seismic event postdates A.D. 1650. They interpreted this event to be one of two eighteenth century earthquakes (A.D. 1705 or 1759), but could not discriminate between the two.
Historical sources concerning surface disruption witnessed at the time of the earthquakes are ambiguous. The 1202 Mount Lebanon rock falls3 might hint at stronger shaking on the west side of the Beqaa, hence on the Yammouneh fault, but comparable shaking to the east might have gone unreported [JW: Most translations of most authors just say ]. Ambraseys and Barazangi (1989, p. 4010) mentioned 100-km-long surface ruptures in the Beqaa in November 1759, but stated thatthe exact location and attitude of (these ruptures) is [sic] not possible to ascertain today.Nevertheless, they inferred the Yammouneh fault to be the most likely candidate. Building on this inference, Ellenblum et al. (1998) referred to Ambraseys and Barazangi (1989) as quoting a description of ground breaks on the Yammouneh fault by the French ambassador in Beirut. Our own investigation of the French sources cited by Ambraseys and Barazangi (1989, p. 4010) yielded only a second-hand account by the French consul in Saida:One claims that [ . . . ] on the Baalbek side (or possibly: near Baalbek) pulling toward the plain the earth cracked open by more than [~6 m] and that this crack extends for over twenty leagues (~80 km) (Archives Nationales, Paris, B1/1032/1959-60).The wording suggests that this rupture took place on one side of the Beqaa, and the mention of Baalbek points to the east side, thus to the Serghaya fault.
The inference that the 1759 earthquakes might be due to slip on the Rachaıya-Serghaya fault and the 1202 event on the Yammouneh fault is qualitatively supported by comparing the preservation of scarps and mole tracks along the two faults. Data Repository Figure DR14 [JW: see above] shows the freshest seismic surface breaks we studied in the field. On the east side of the Marj Hıne basin, the Yammouneh fault juxtaposes Cretaceous limestones with Quaternary colluvial limestone fanglomerates. The surface trace of the fault is marked by a classic coseismic scarplet (fault ribbon: e.g., Armijo et al., 1992; Piccardi et al., 1999) that is fairly weathered (Fig. DR1A). North of Serghaya, one strand of the Serghaya fault shows a scarplet of comparable origin, between limestone and limestone colluvium, but with a relatively unaltered surface and lighter color (Fig. DR1B). This scarplet marks the base of a prominent slope break many kilometers long, at places only tens of meters above the valley floor, hence not due to landsliding. On the Rachaıya fault, we found fresh mole tracks in unconsolidated limestone scree (Fig. DR1D), while none are preserved on the Yammouneh fault. The fault ribbon north of Serghaya, which testifies to down-to-the-west normal faulting, fits well the French consul’s description. Such evidence complements that of Gomez et al. (2001) at Zebadani, implying that the latest earthquakes on the Rachaıya-Serghaya fault are younger than on the Yammouneh fault (Tapponnier et al., 2001).