En Gedi
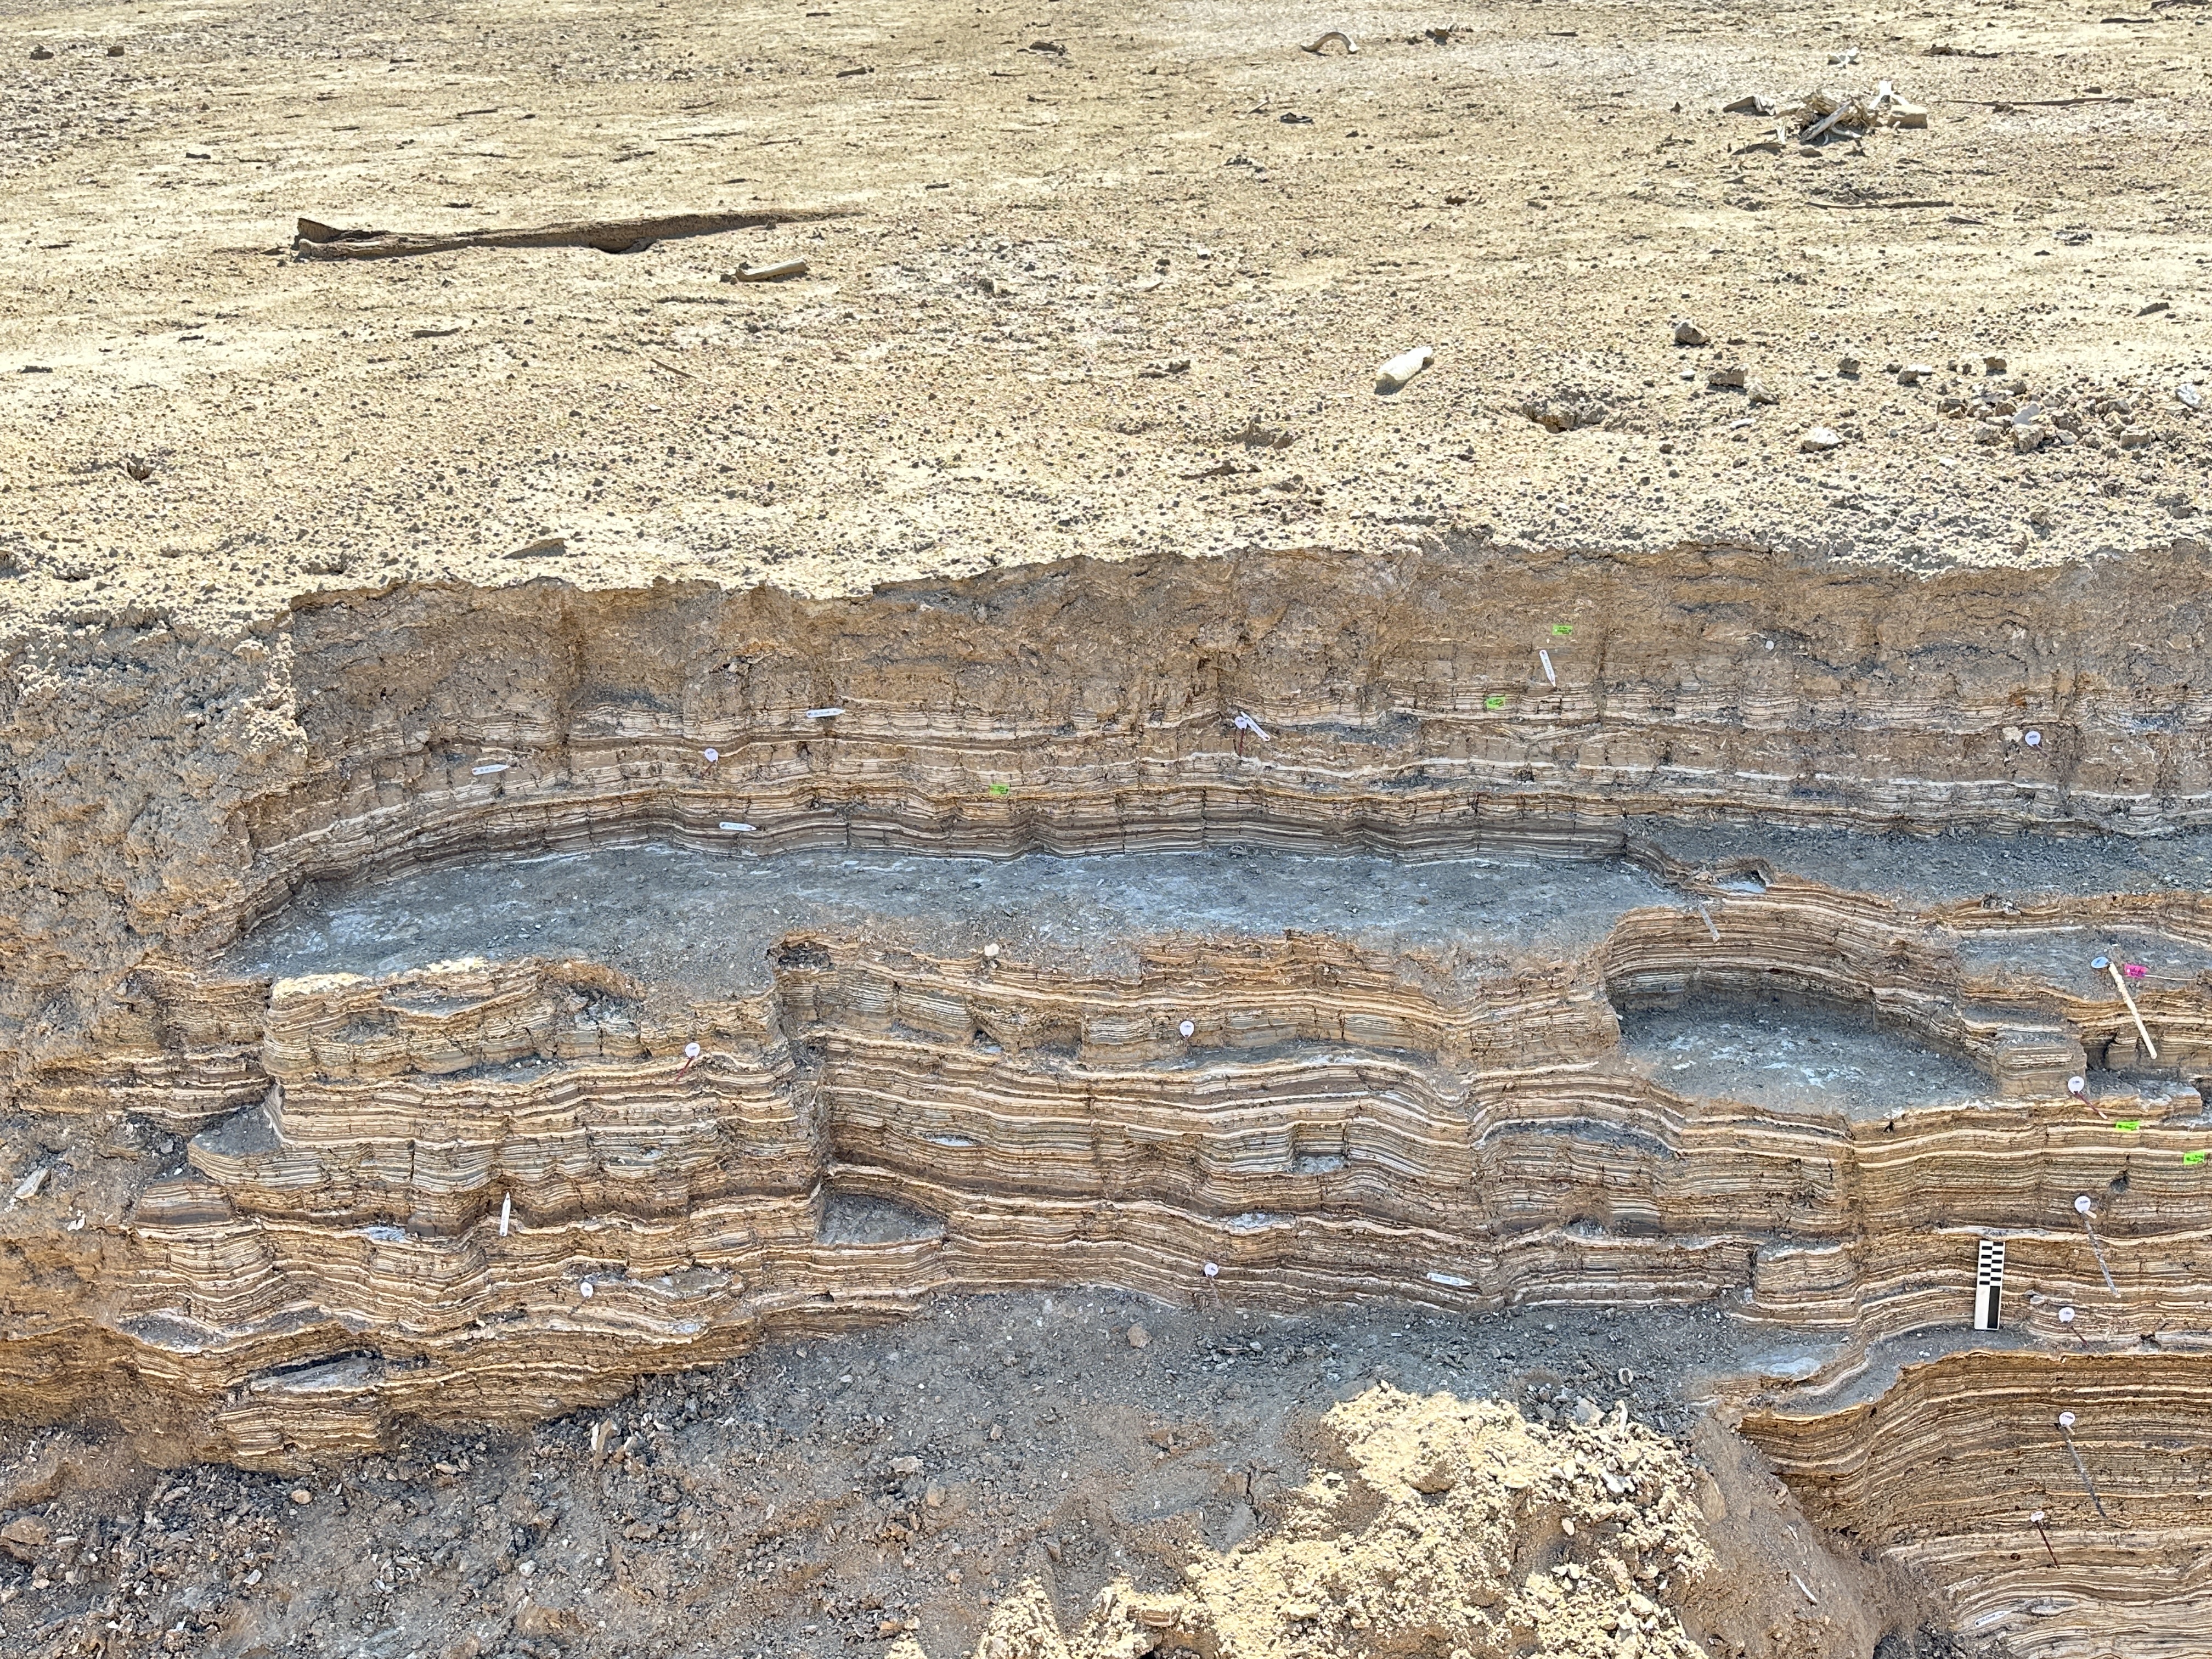
 Aerial shot of En Gedi Trench from the east
Click on Image for high resolution magnifiable image
Drone Photo by Jefferson Williams 11 Feb. 2023
| Transliterated Name | Source | Name |
|---|---|---|
| En Gedi | ||
| Ein Gedi | Hebrew | עֵין גֶּדִי |
| Ein Gedi | Arabic | عين جدي |
- Locations of En Gedi Core and Trench
in Google Earth
 Locations of En Gedi Core and Trench
click on image to explore this site on a new tab in Google Earth - Locations of En Gedi Core and Trench
on govmap.gov.il
 Locations of En Gedi Core and Trench
Trenches are described as being east of the Dir Hagla monastery
click on image to explore this site on a new tab in govmap.gov.il
 Orthophoto En Gedi Trench
Click on Image for high resolution magnifiable image
Drone photos by Jefferson Williams 11 Feb. 2023
- Add 0.25 m to indicated depths in sections to match with depths of previous surveys - e.g. 2015, 2018, and DSEn (the En Gedi Core)
| Description | Image | Source |
|---|---|---|
| Entire En Gedi Trench |
 Entire En Gedi Trench - cleaned a bit more than on 16 Feb. 2023
Photo by Jefferson Williams 17 Feb. 2023 |
Jefferson Williams |
| Entire En Gedi Trench - closer in |
 Entire En Gedi Trench
Photo by Jefferson Williams 16 Feb. 2023 |
Jefferson Williams |
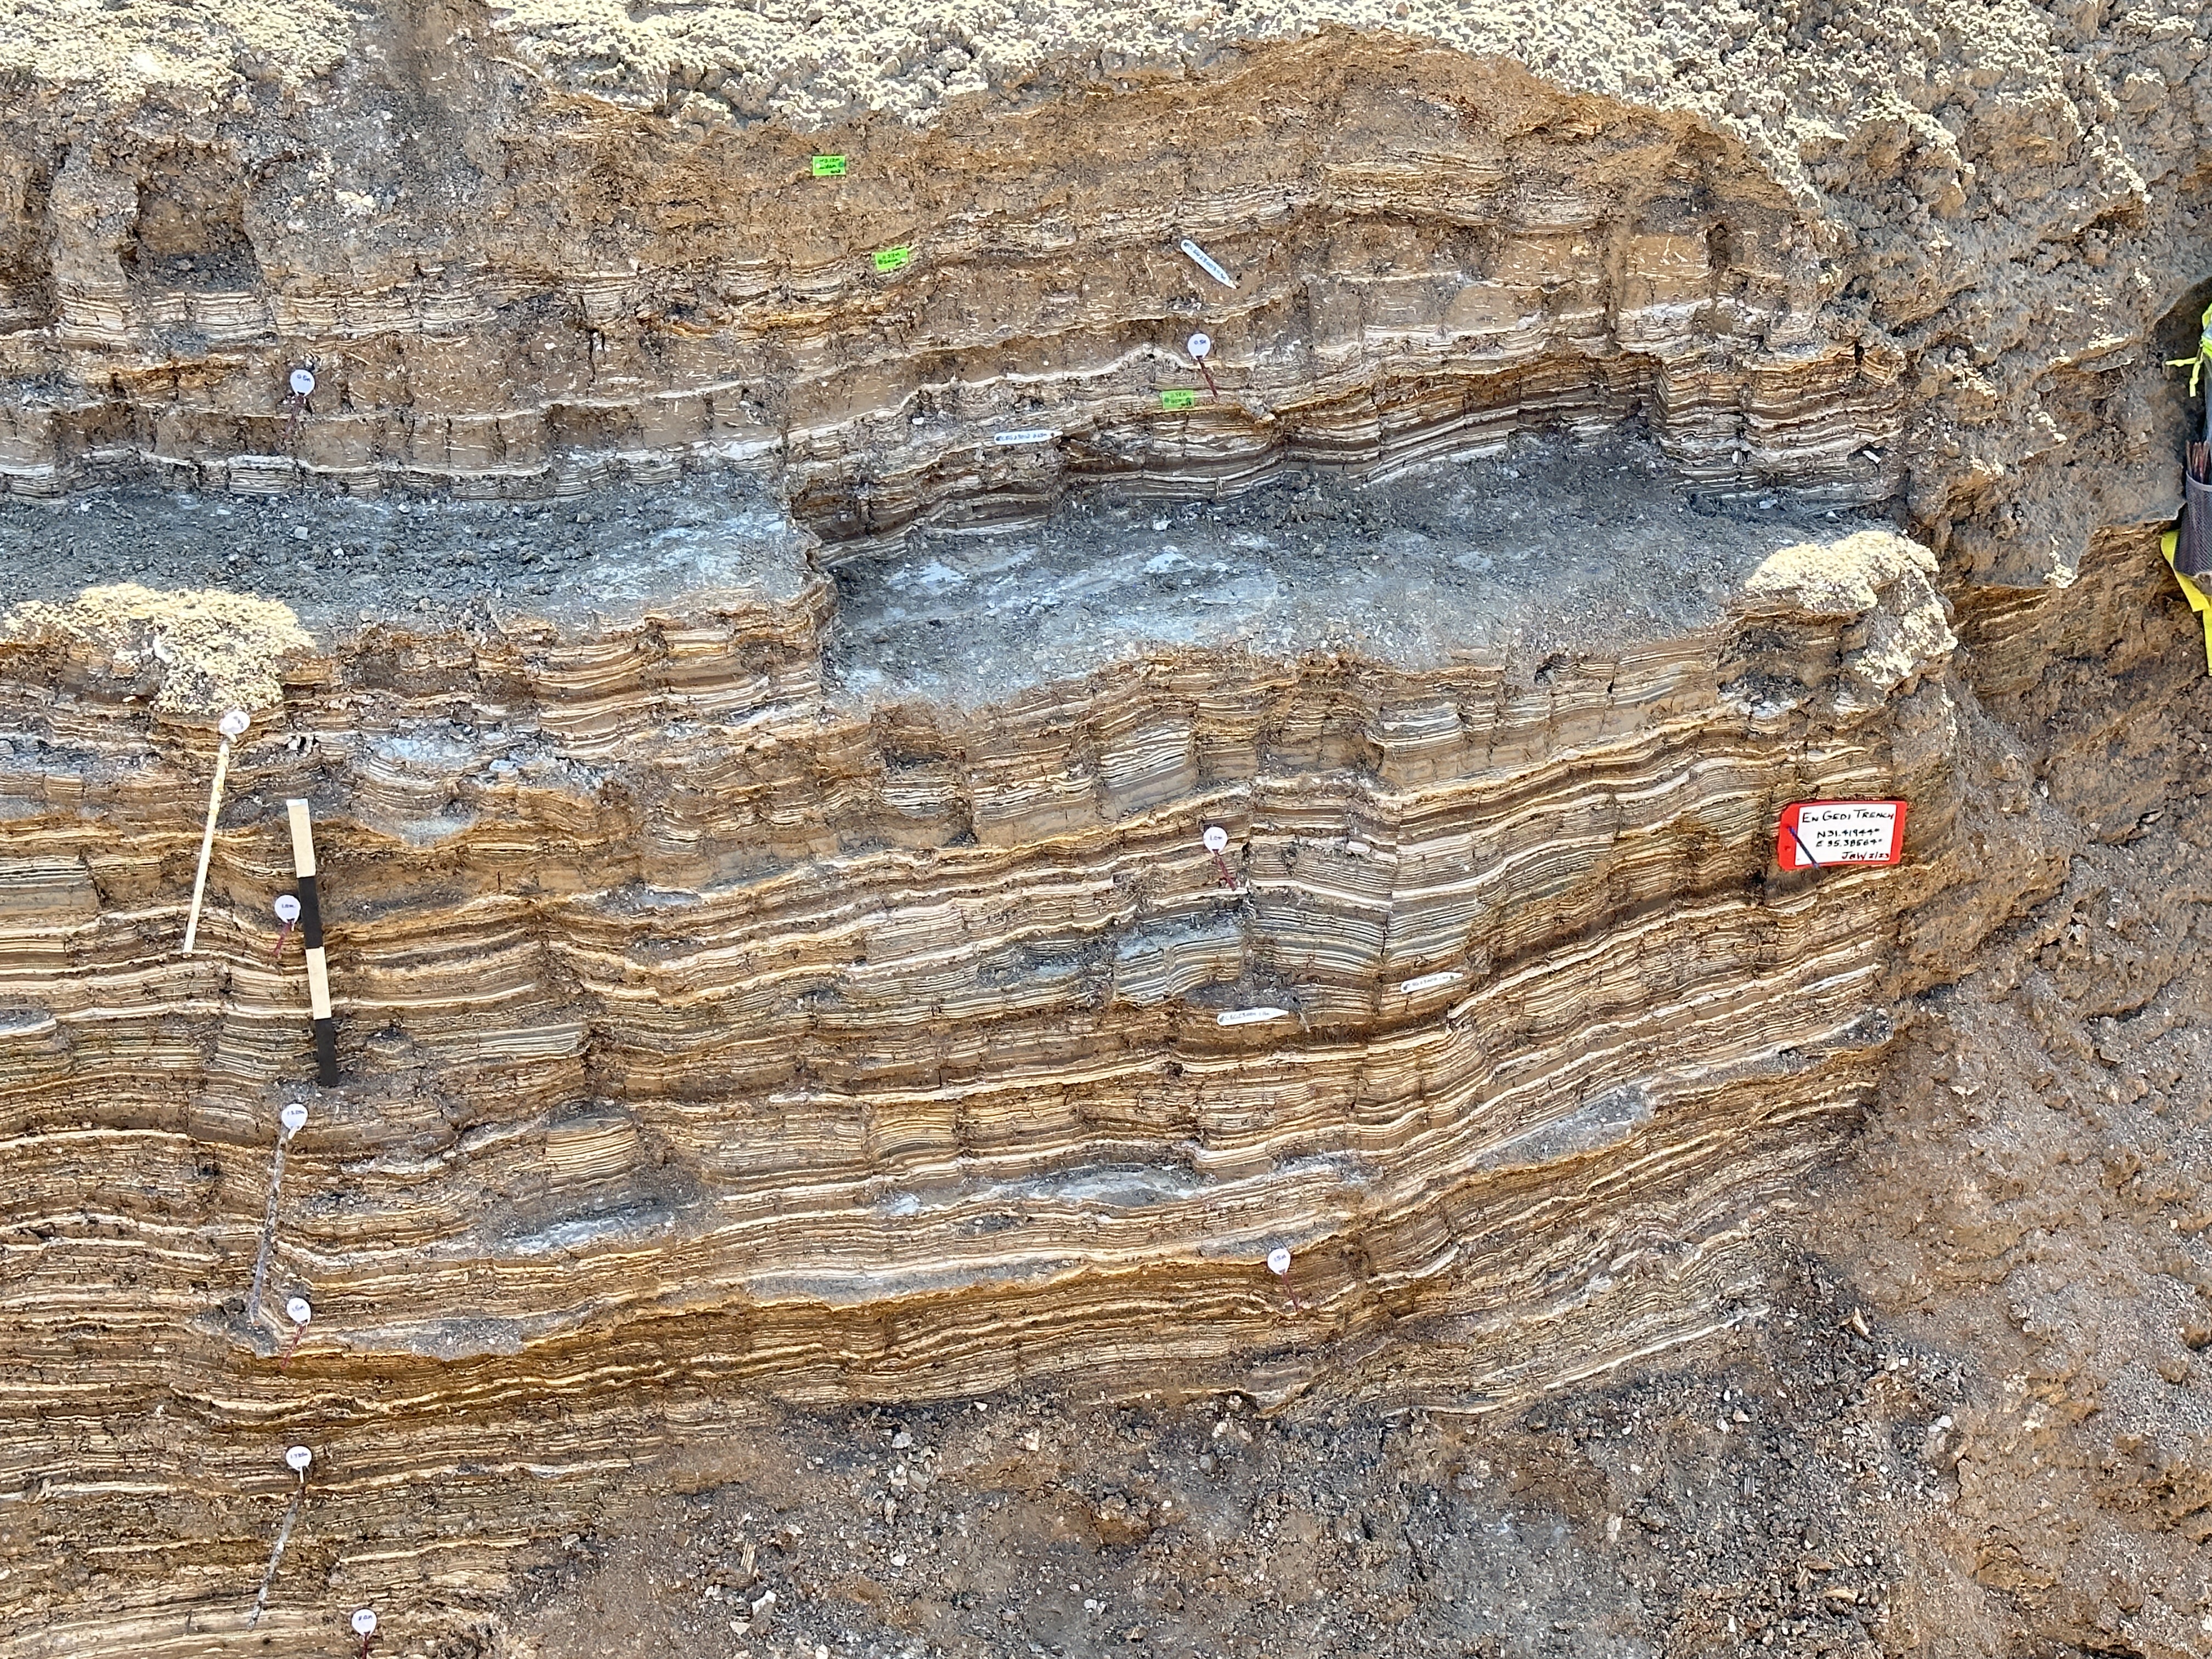
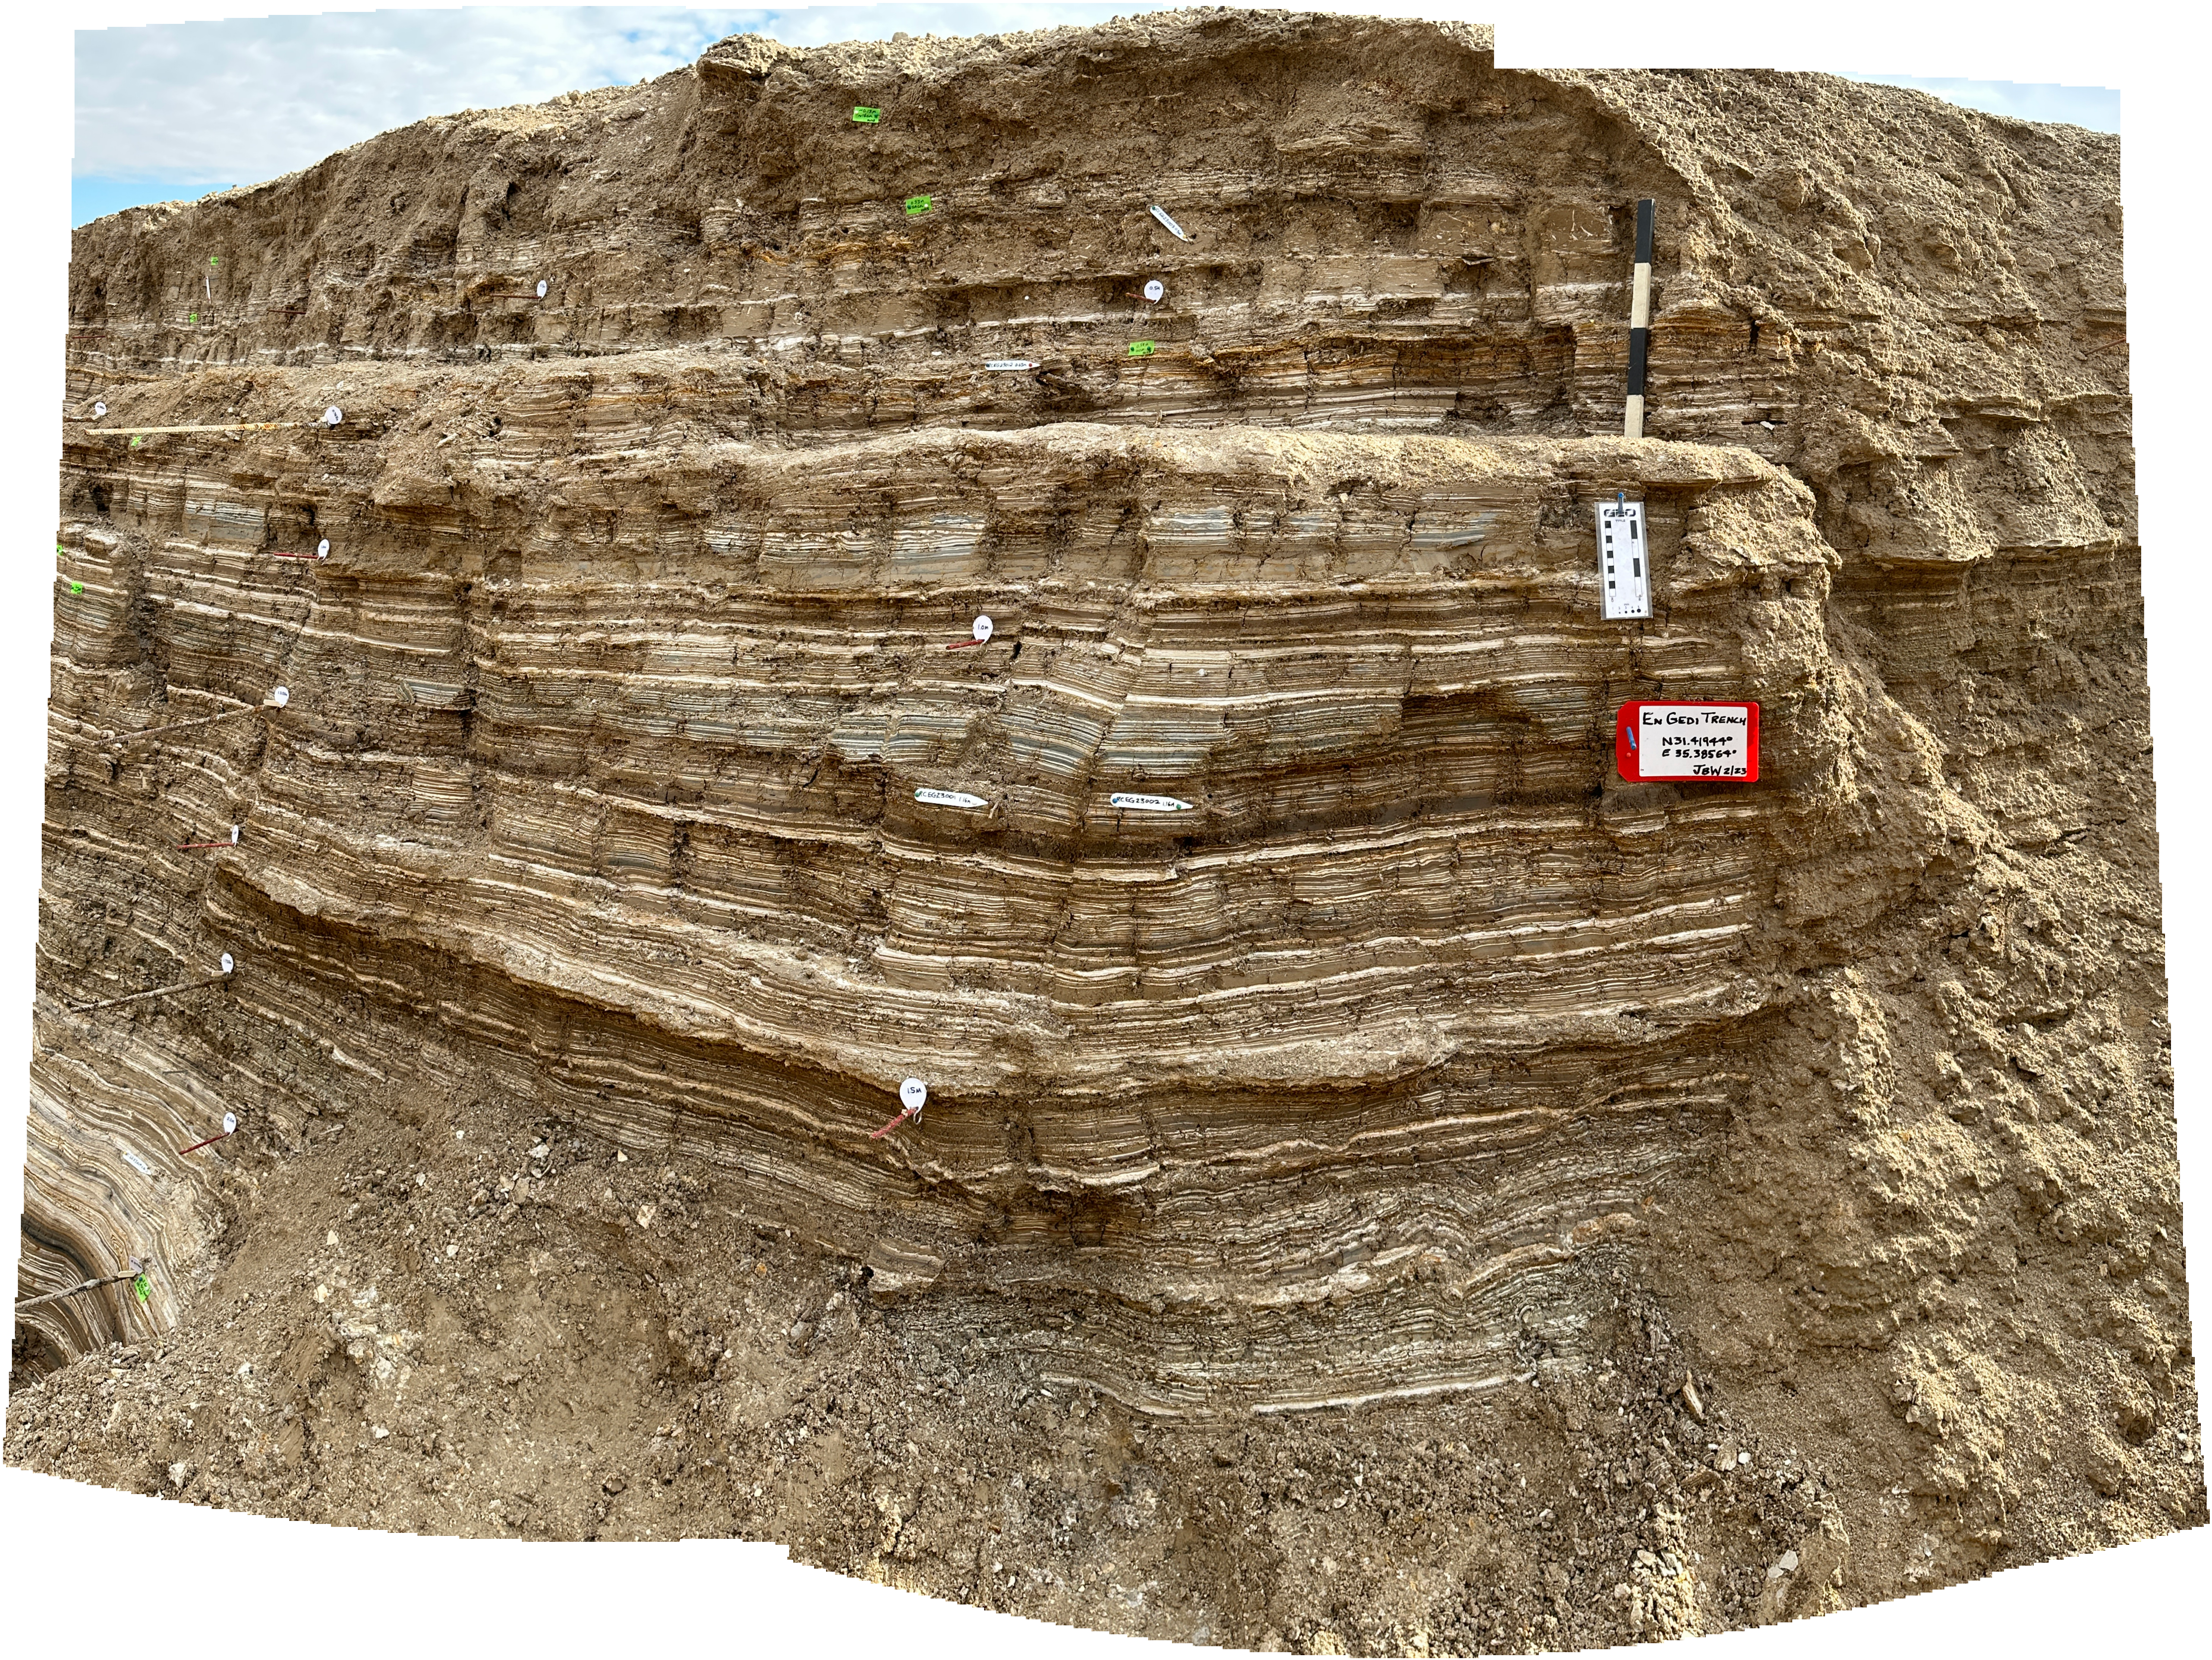
| Entire East Section of En Gedi Trench |
 Entire East Section of En Gedi Trench
Photo by Jefferson Williams 17 Feb. 2023 |
Jefferson Williams |
| Entire West Section of En Gedi Trench |
 Entire West Section of En Gedi Trench
Photo by Jefferson Williams 17 Feb. 2023 |
Jefferson Williams |
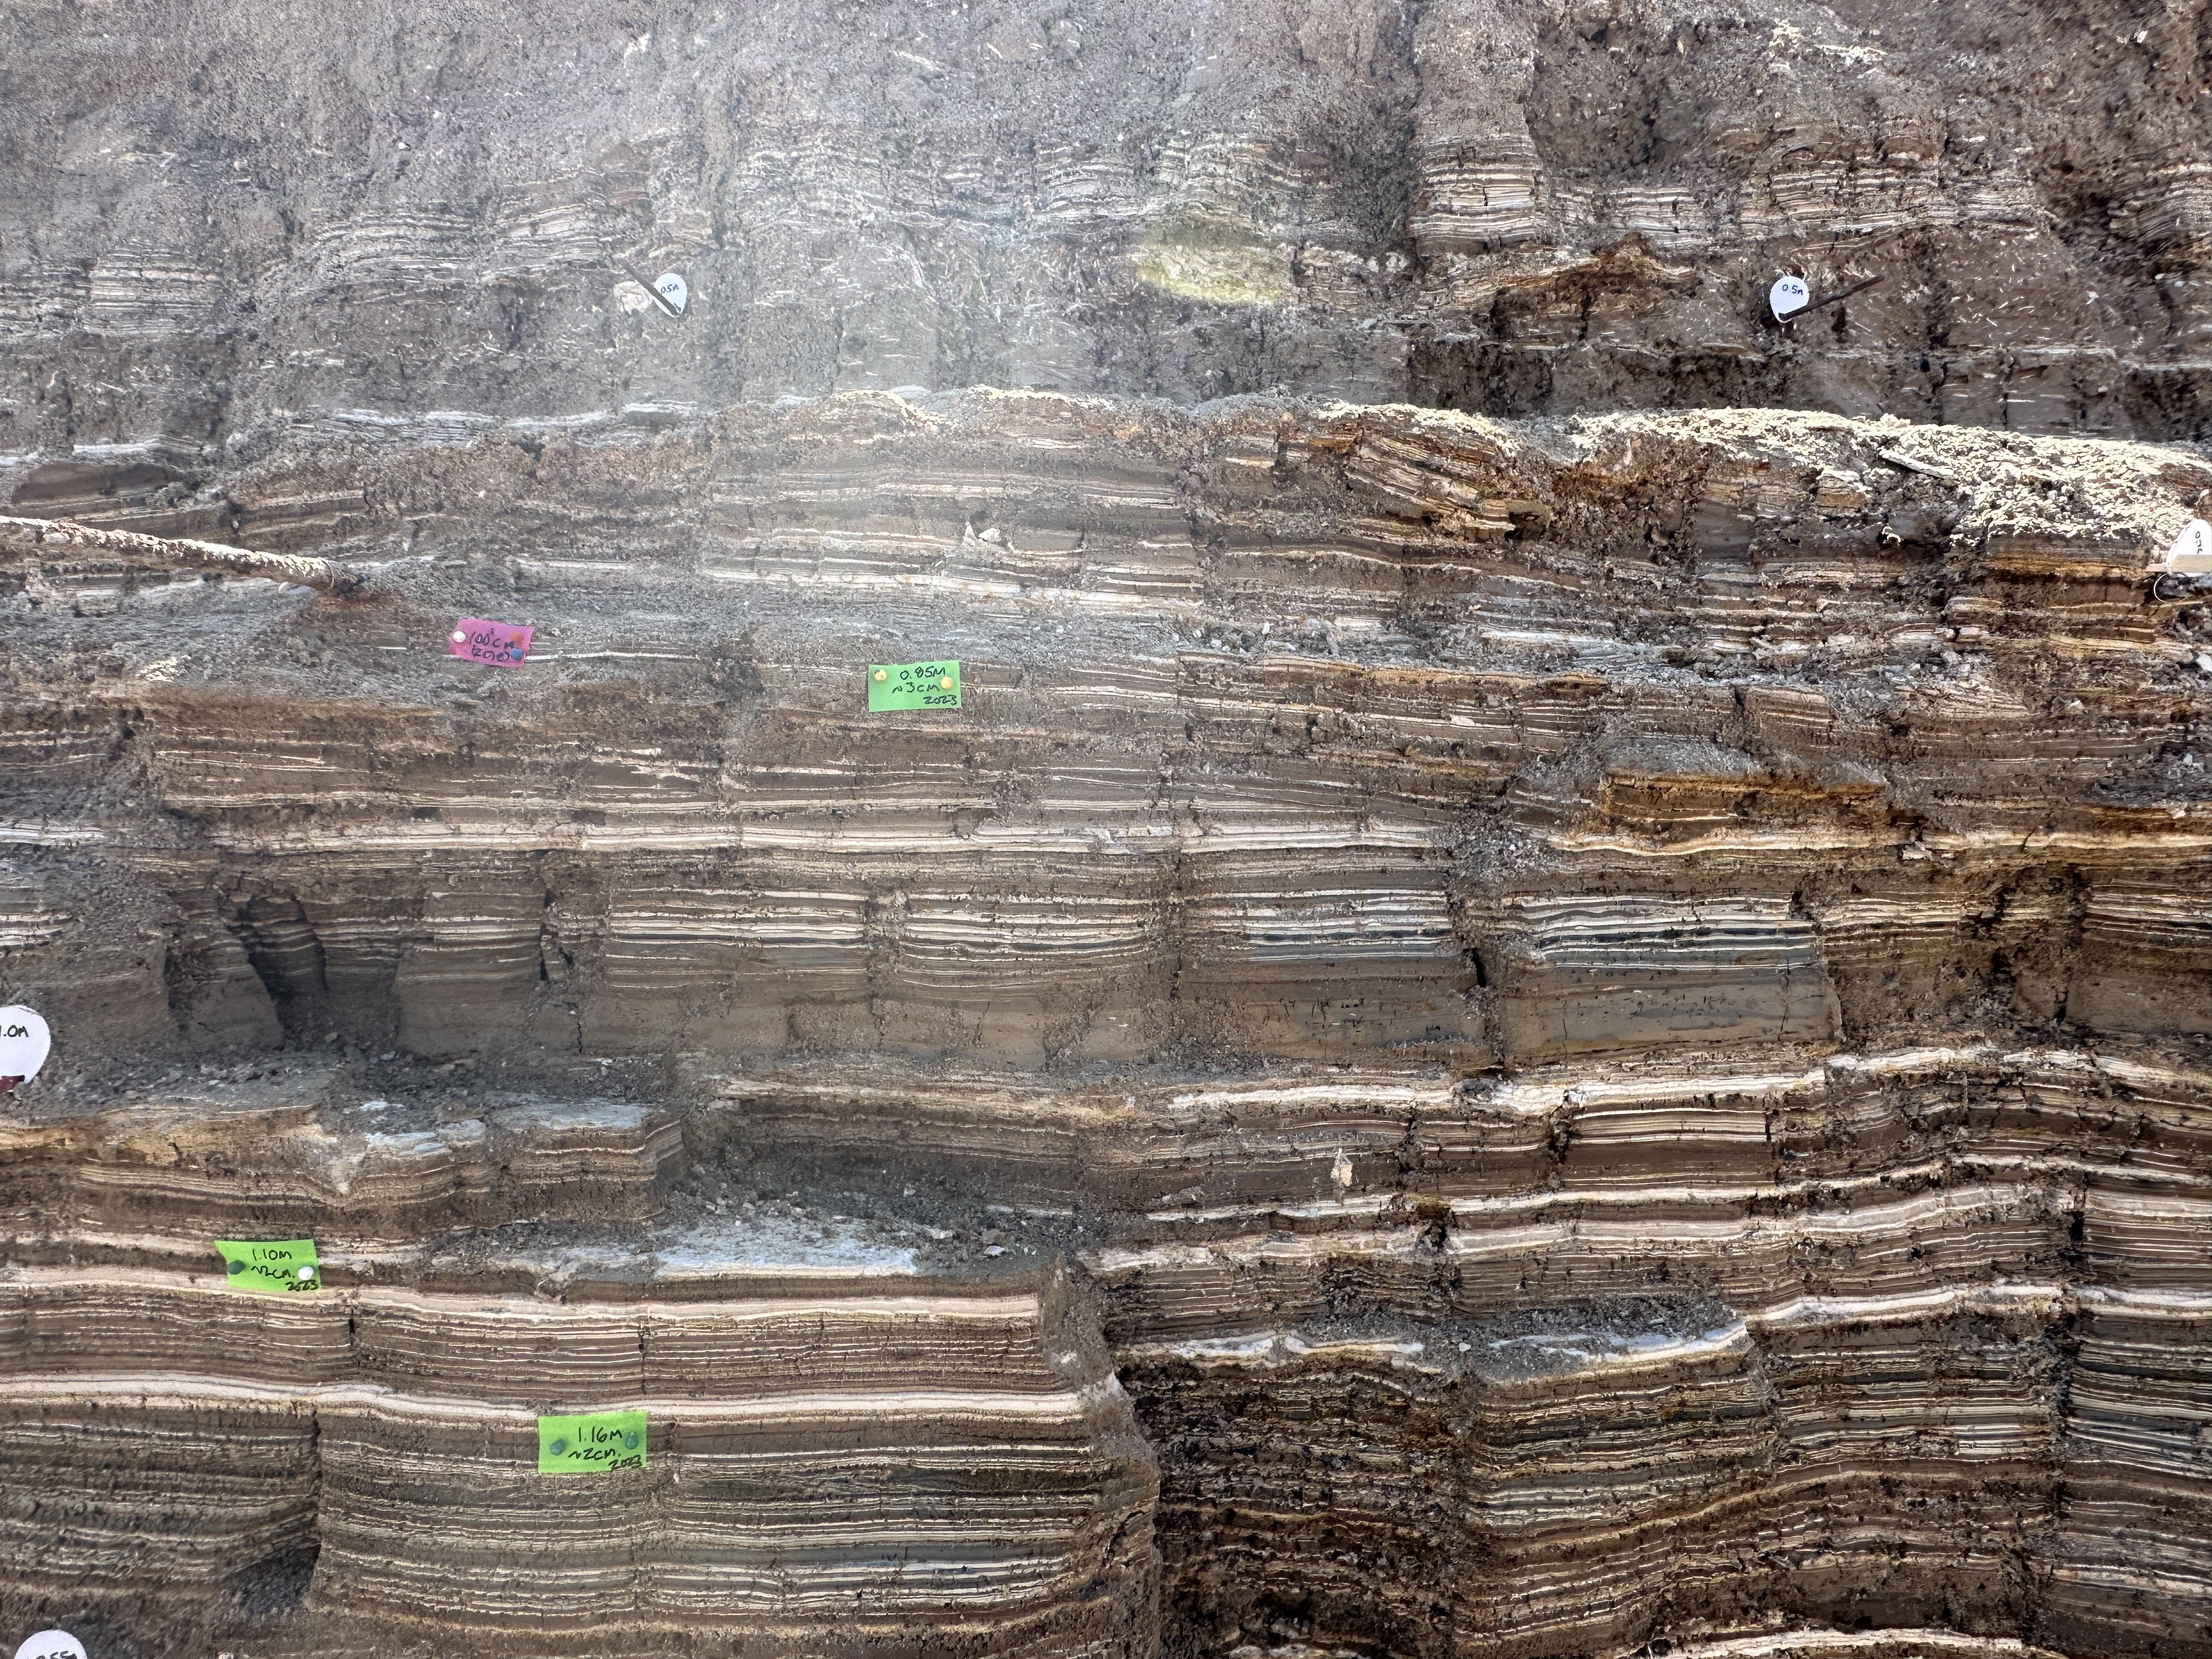
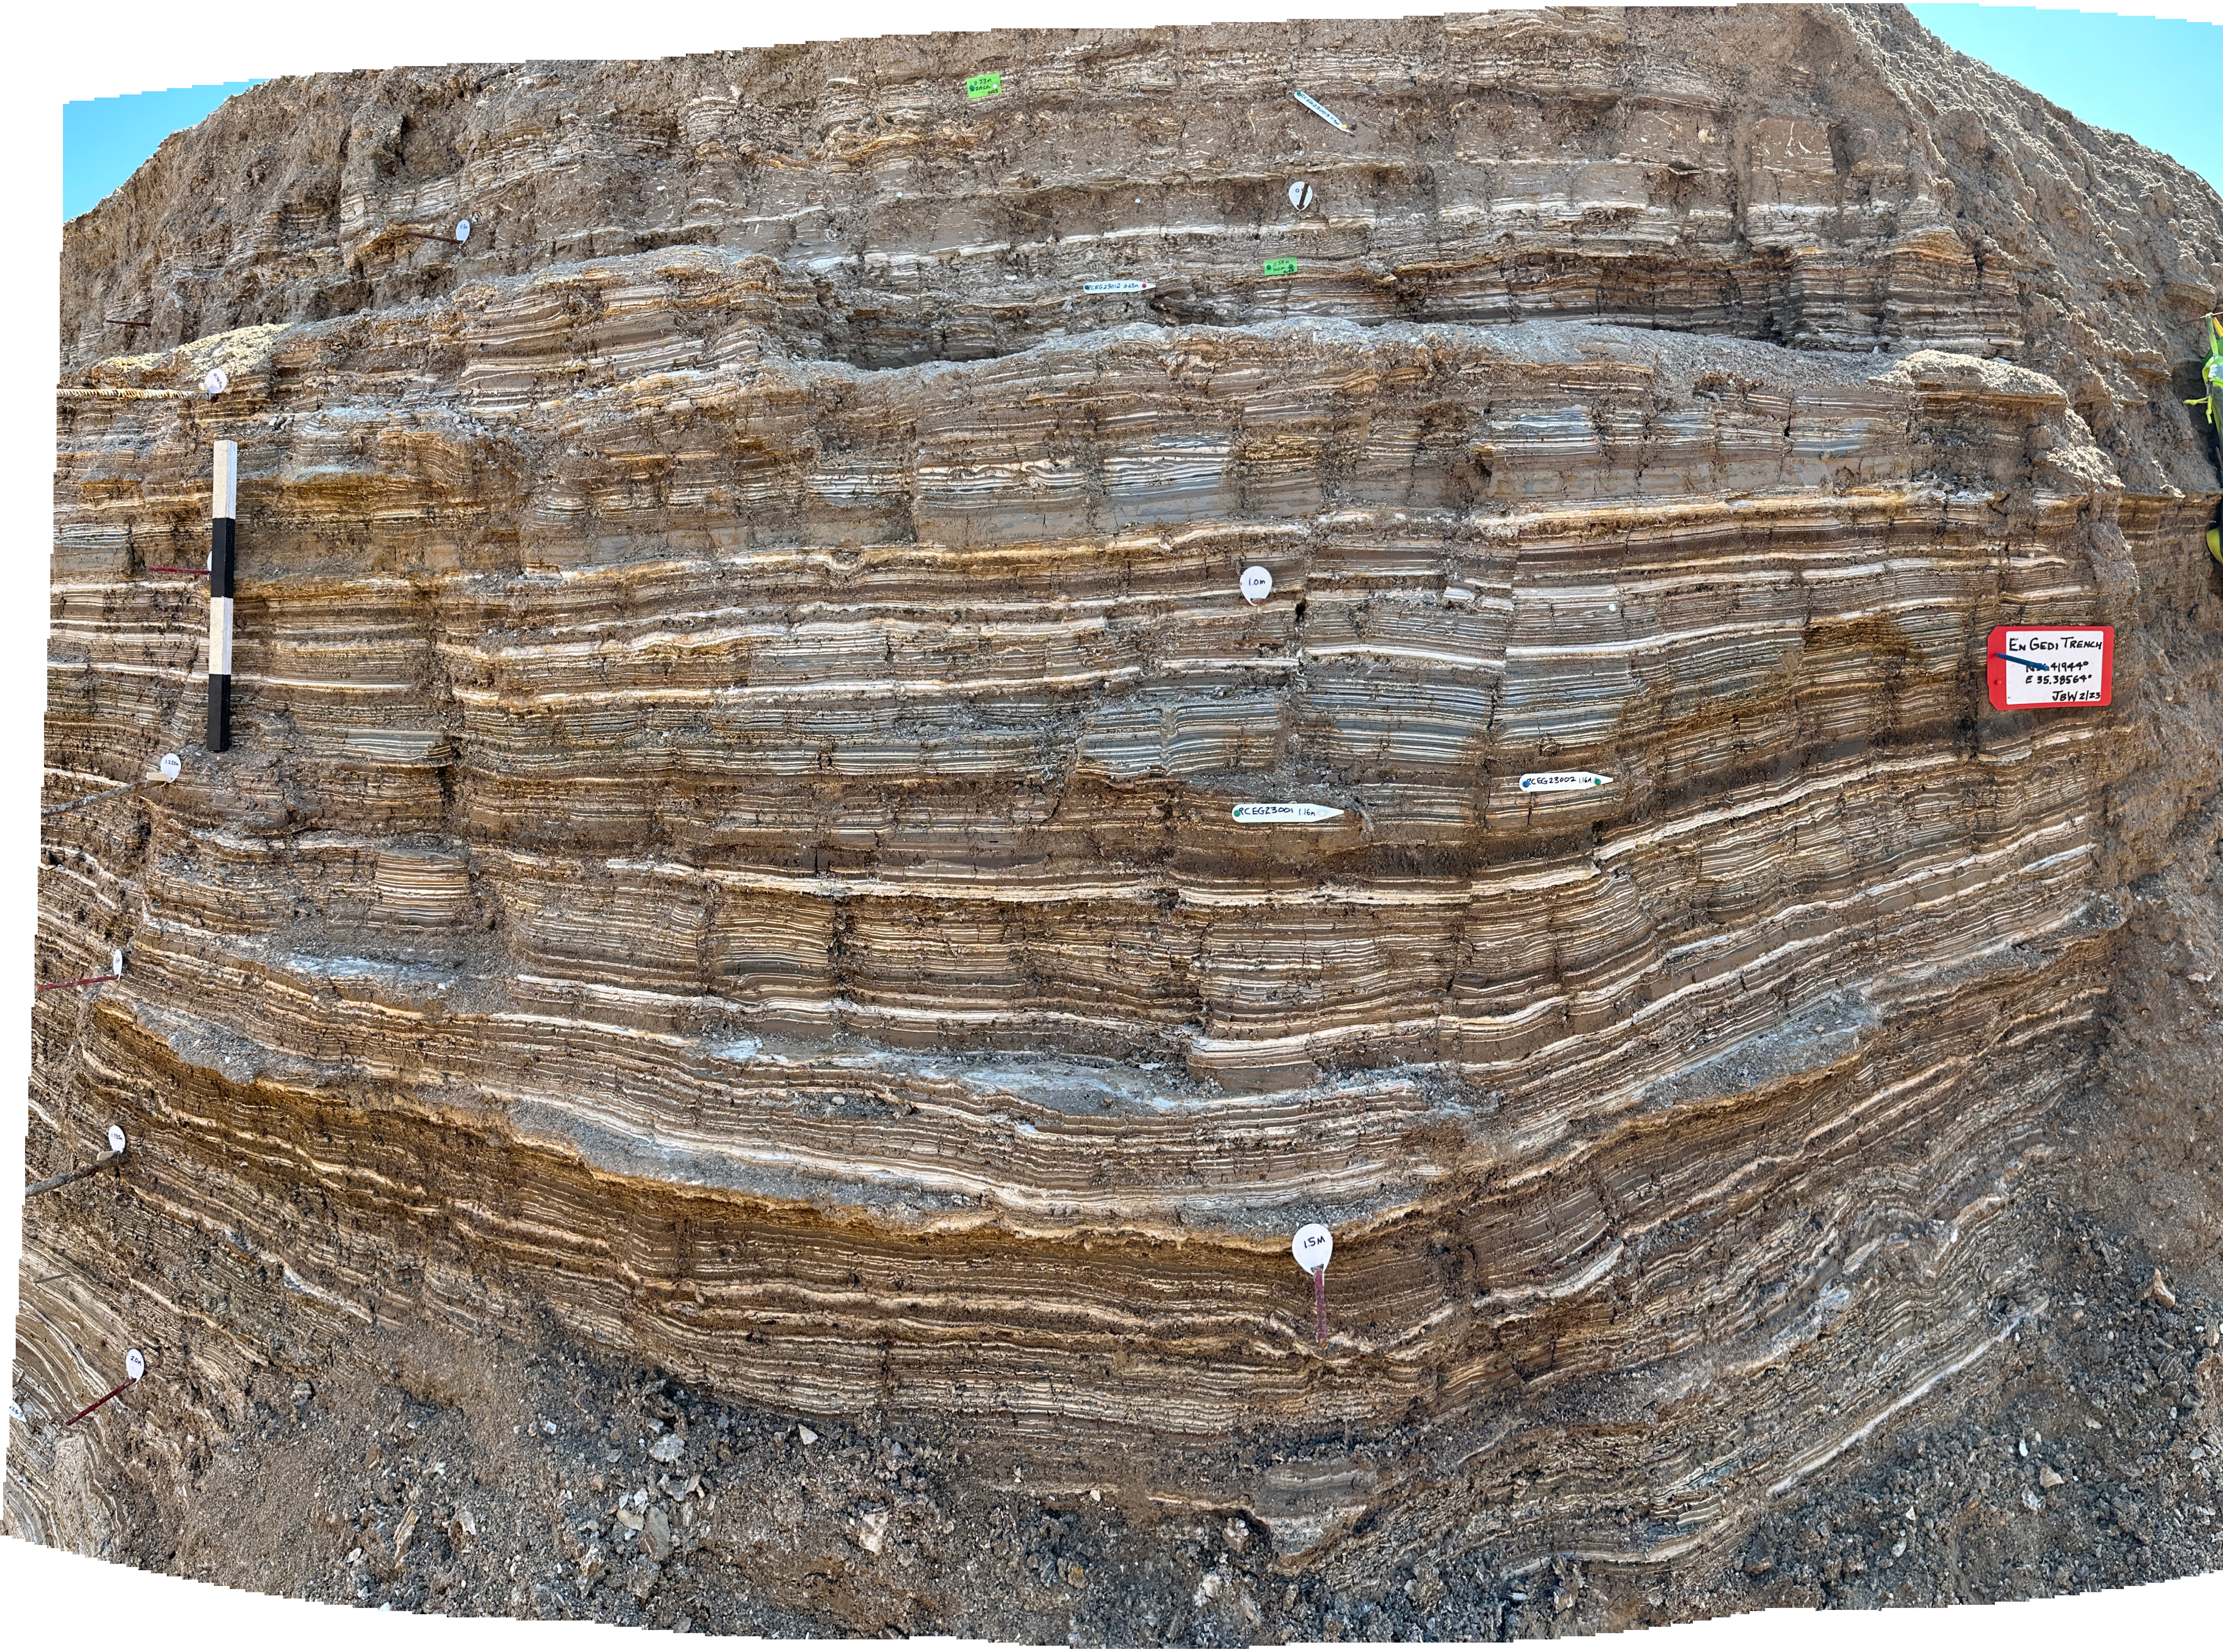
| Entire Middle Section of En Gedi Trench |
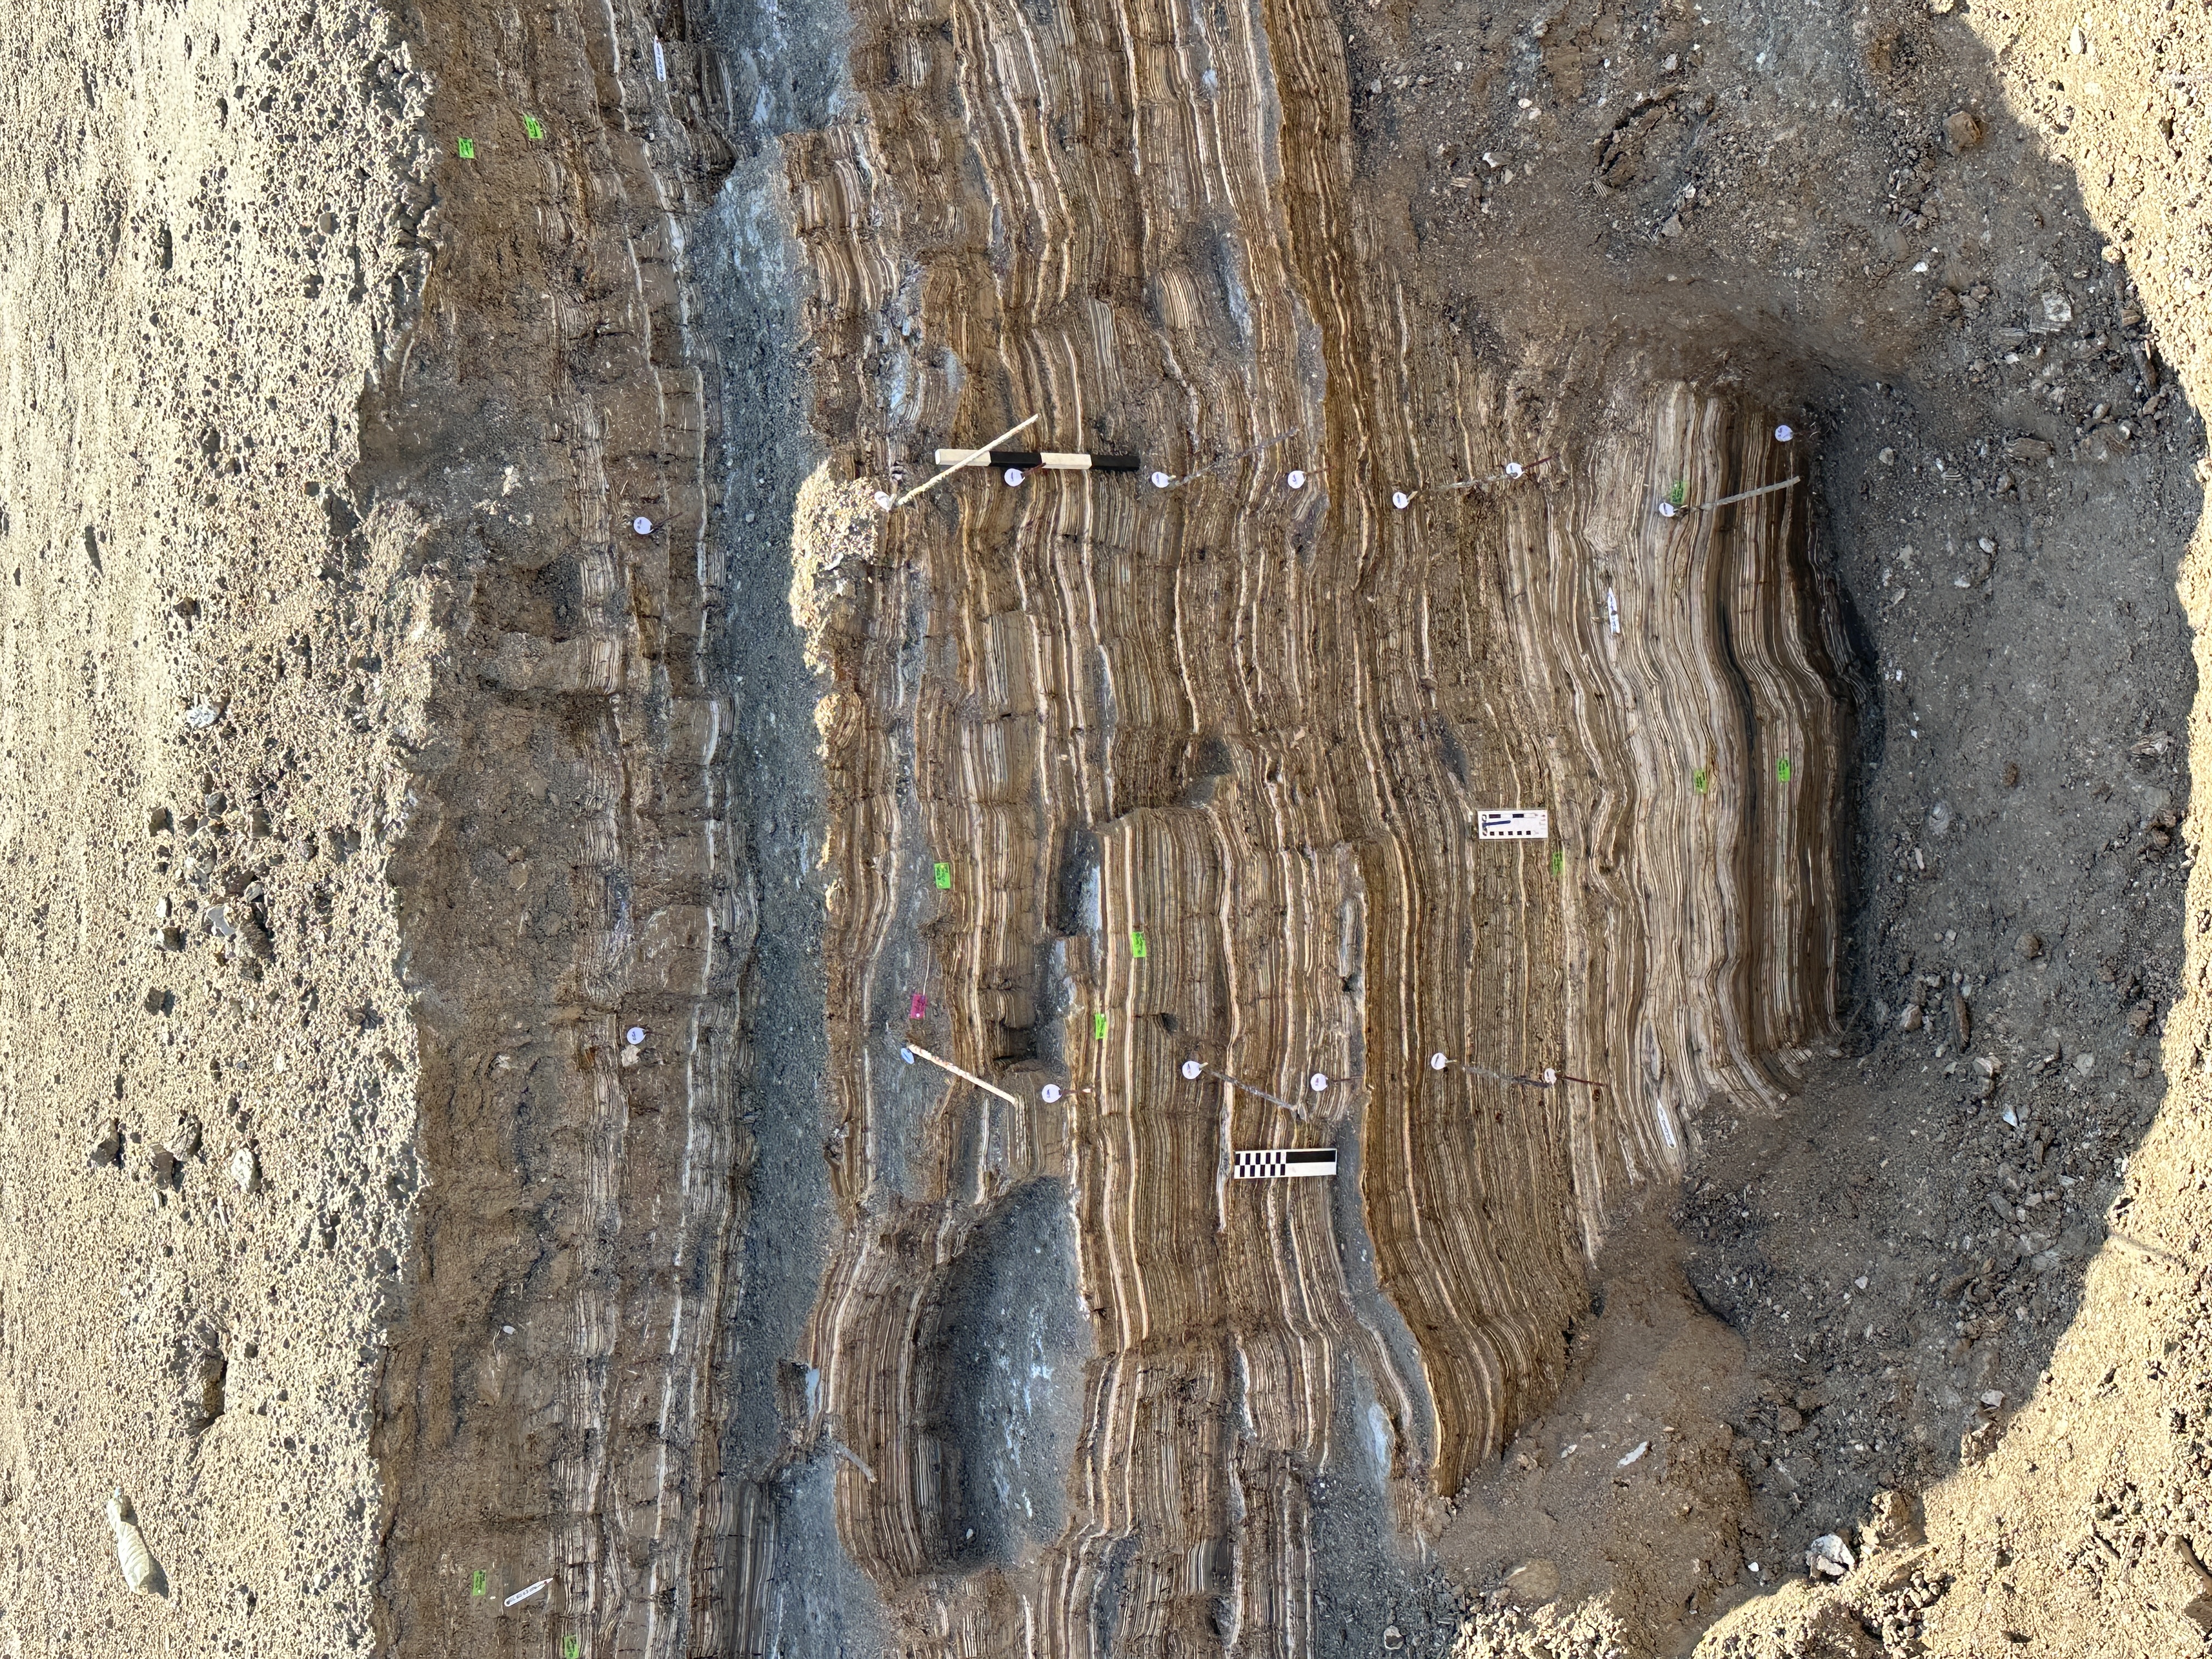 Entire Middle Section of En Gedi Trench
Photo by Jefferson Williams 17 Feb. 2023 |
Jefferson Williams |
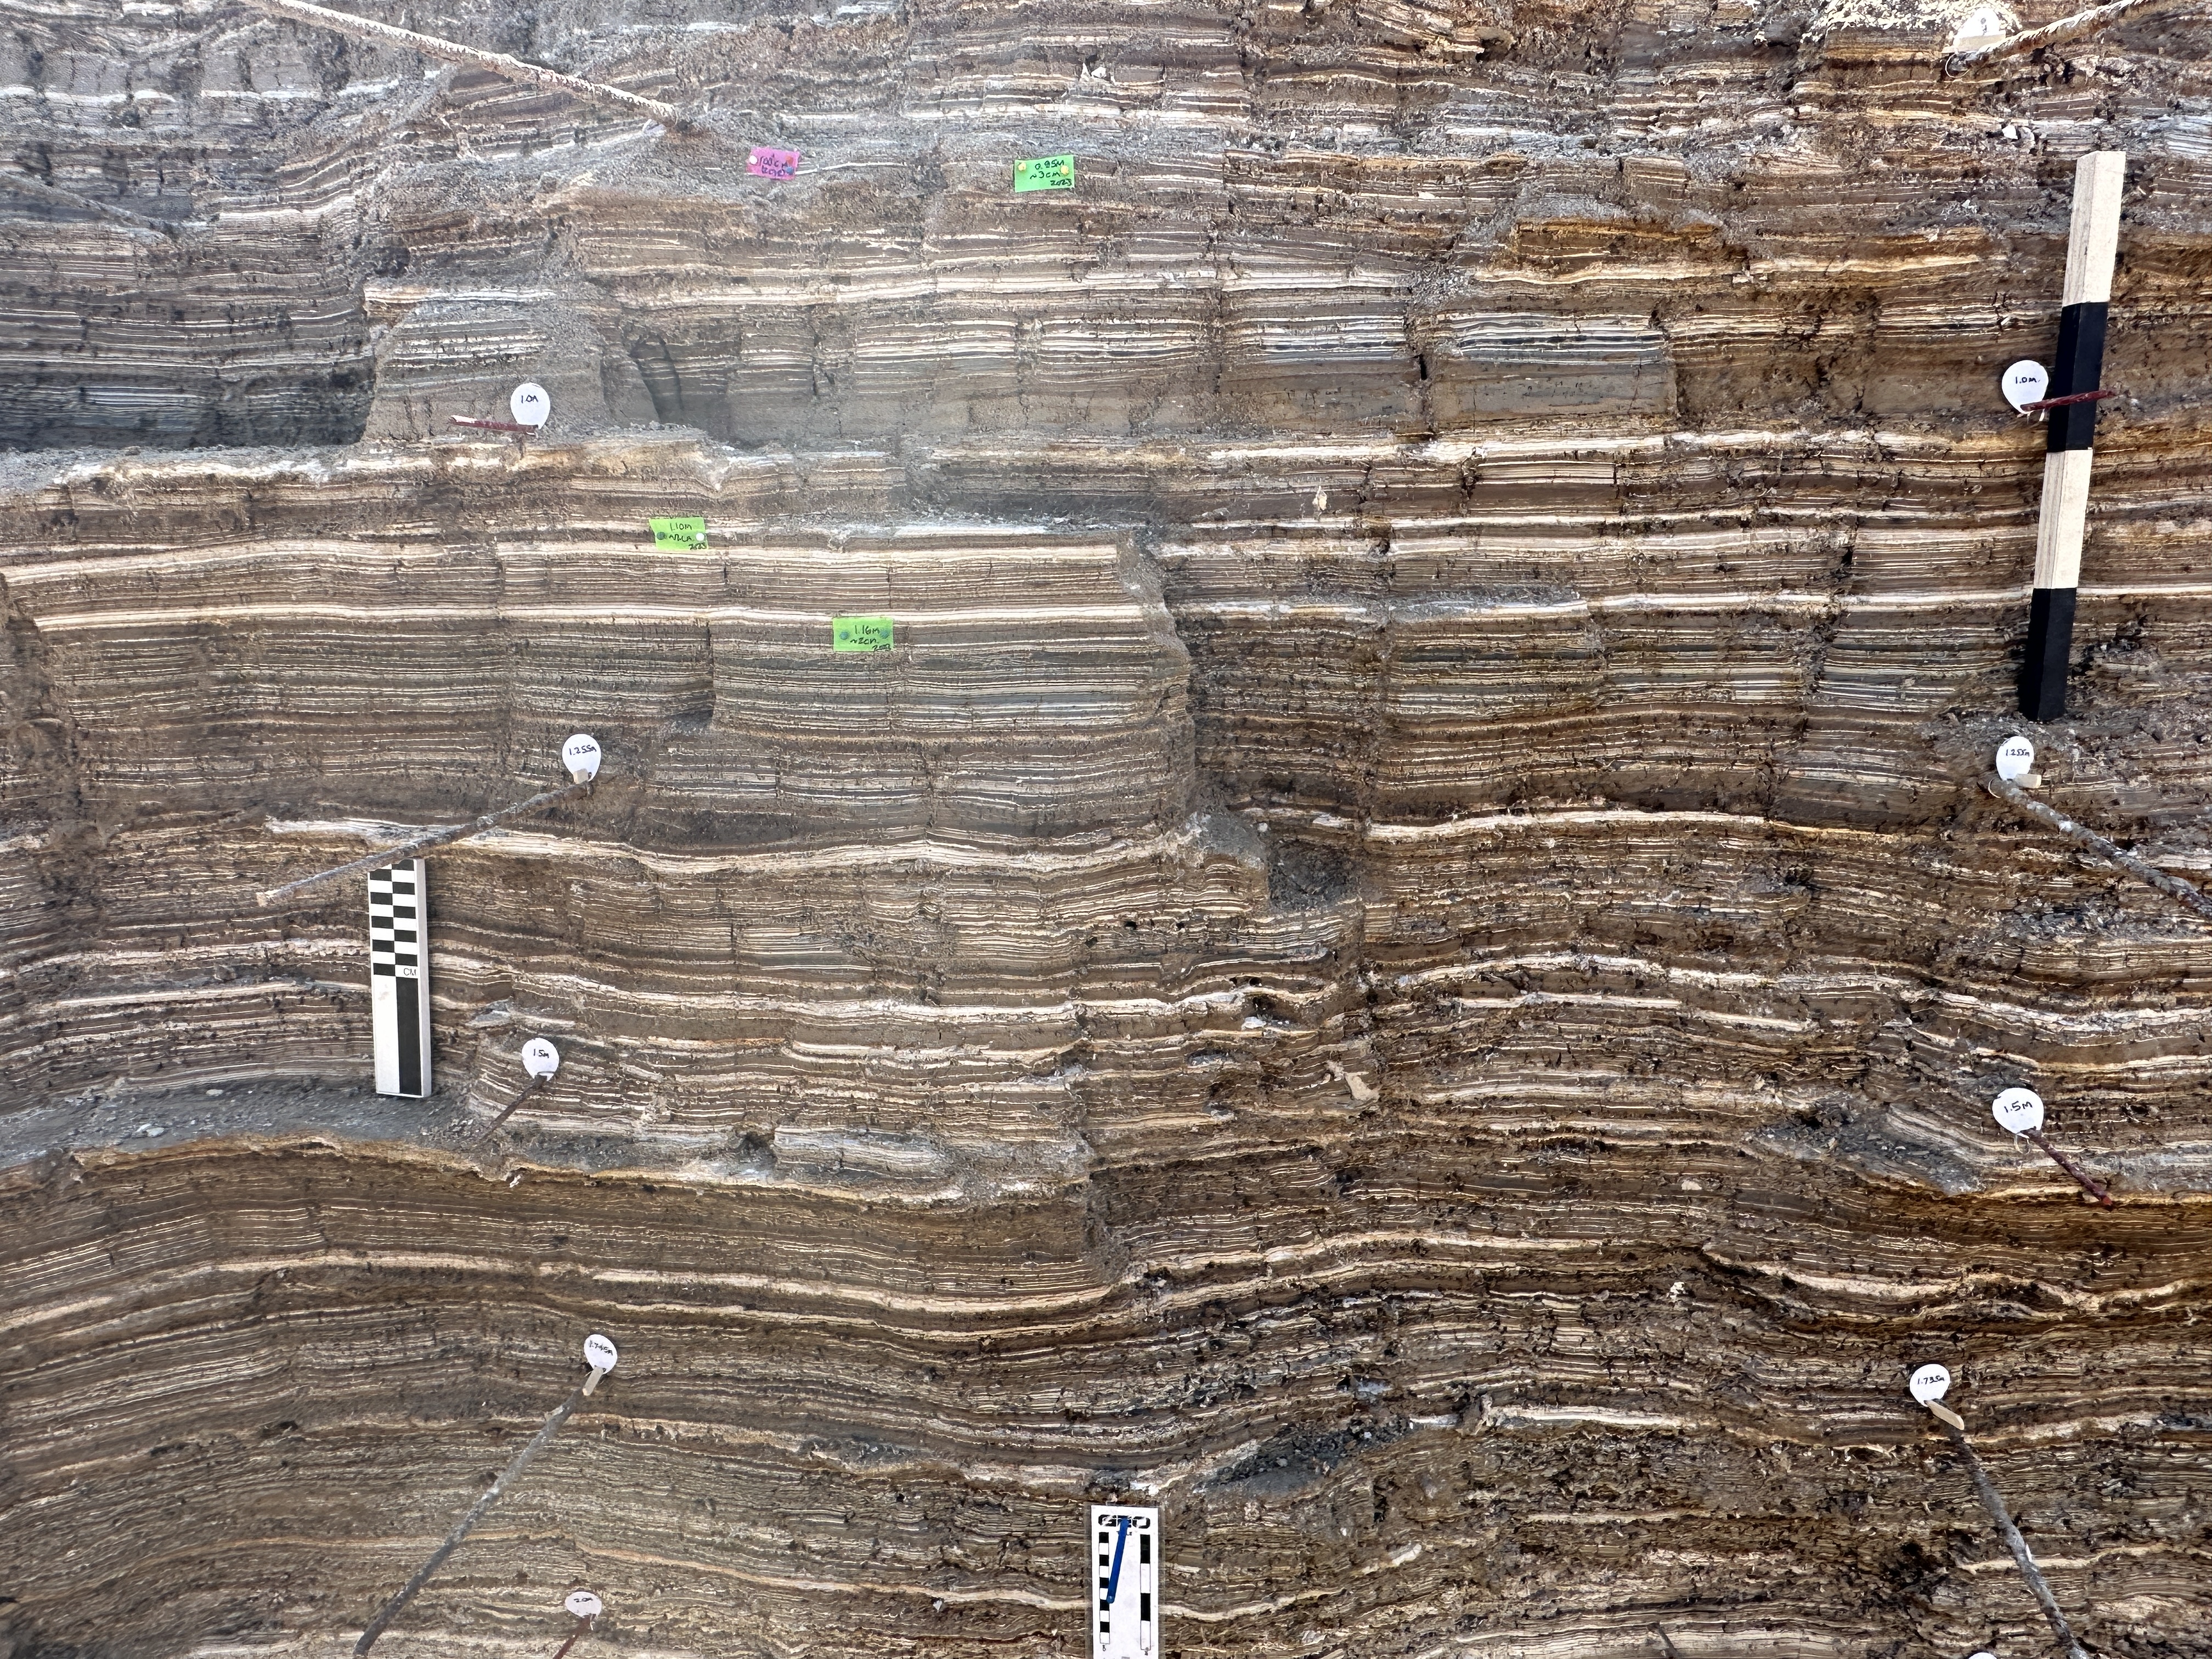
| Top of Middle Section of En Gedi Trench |
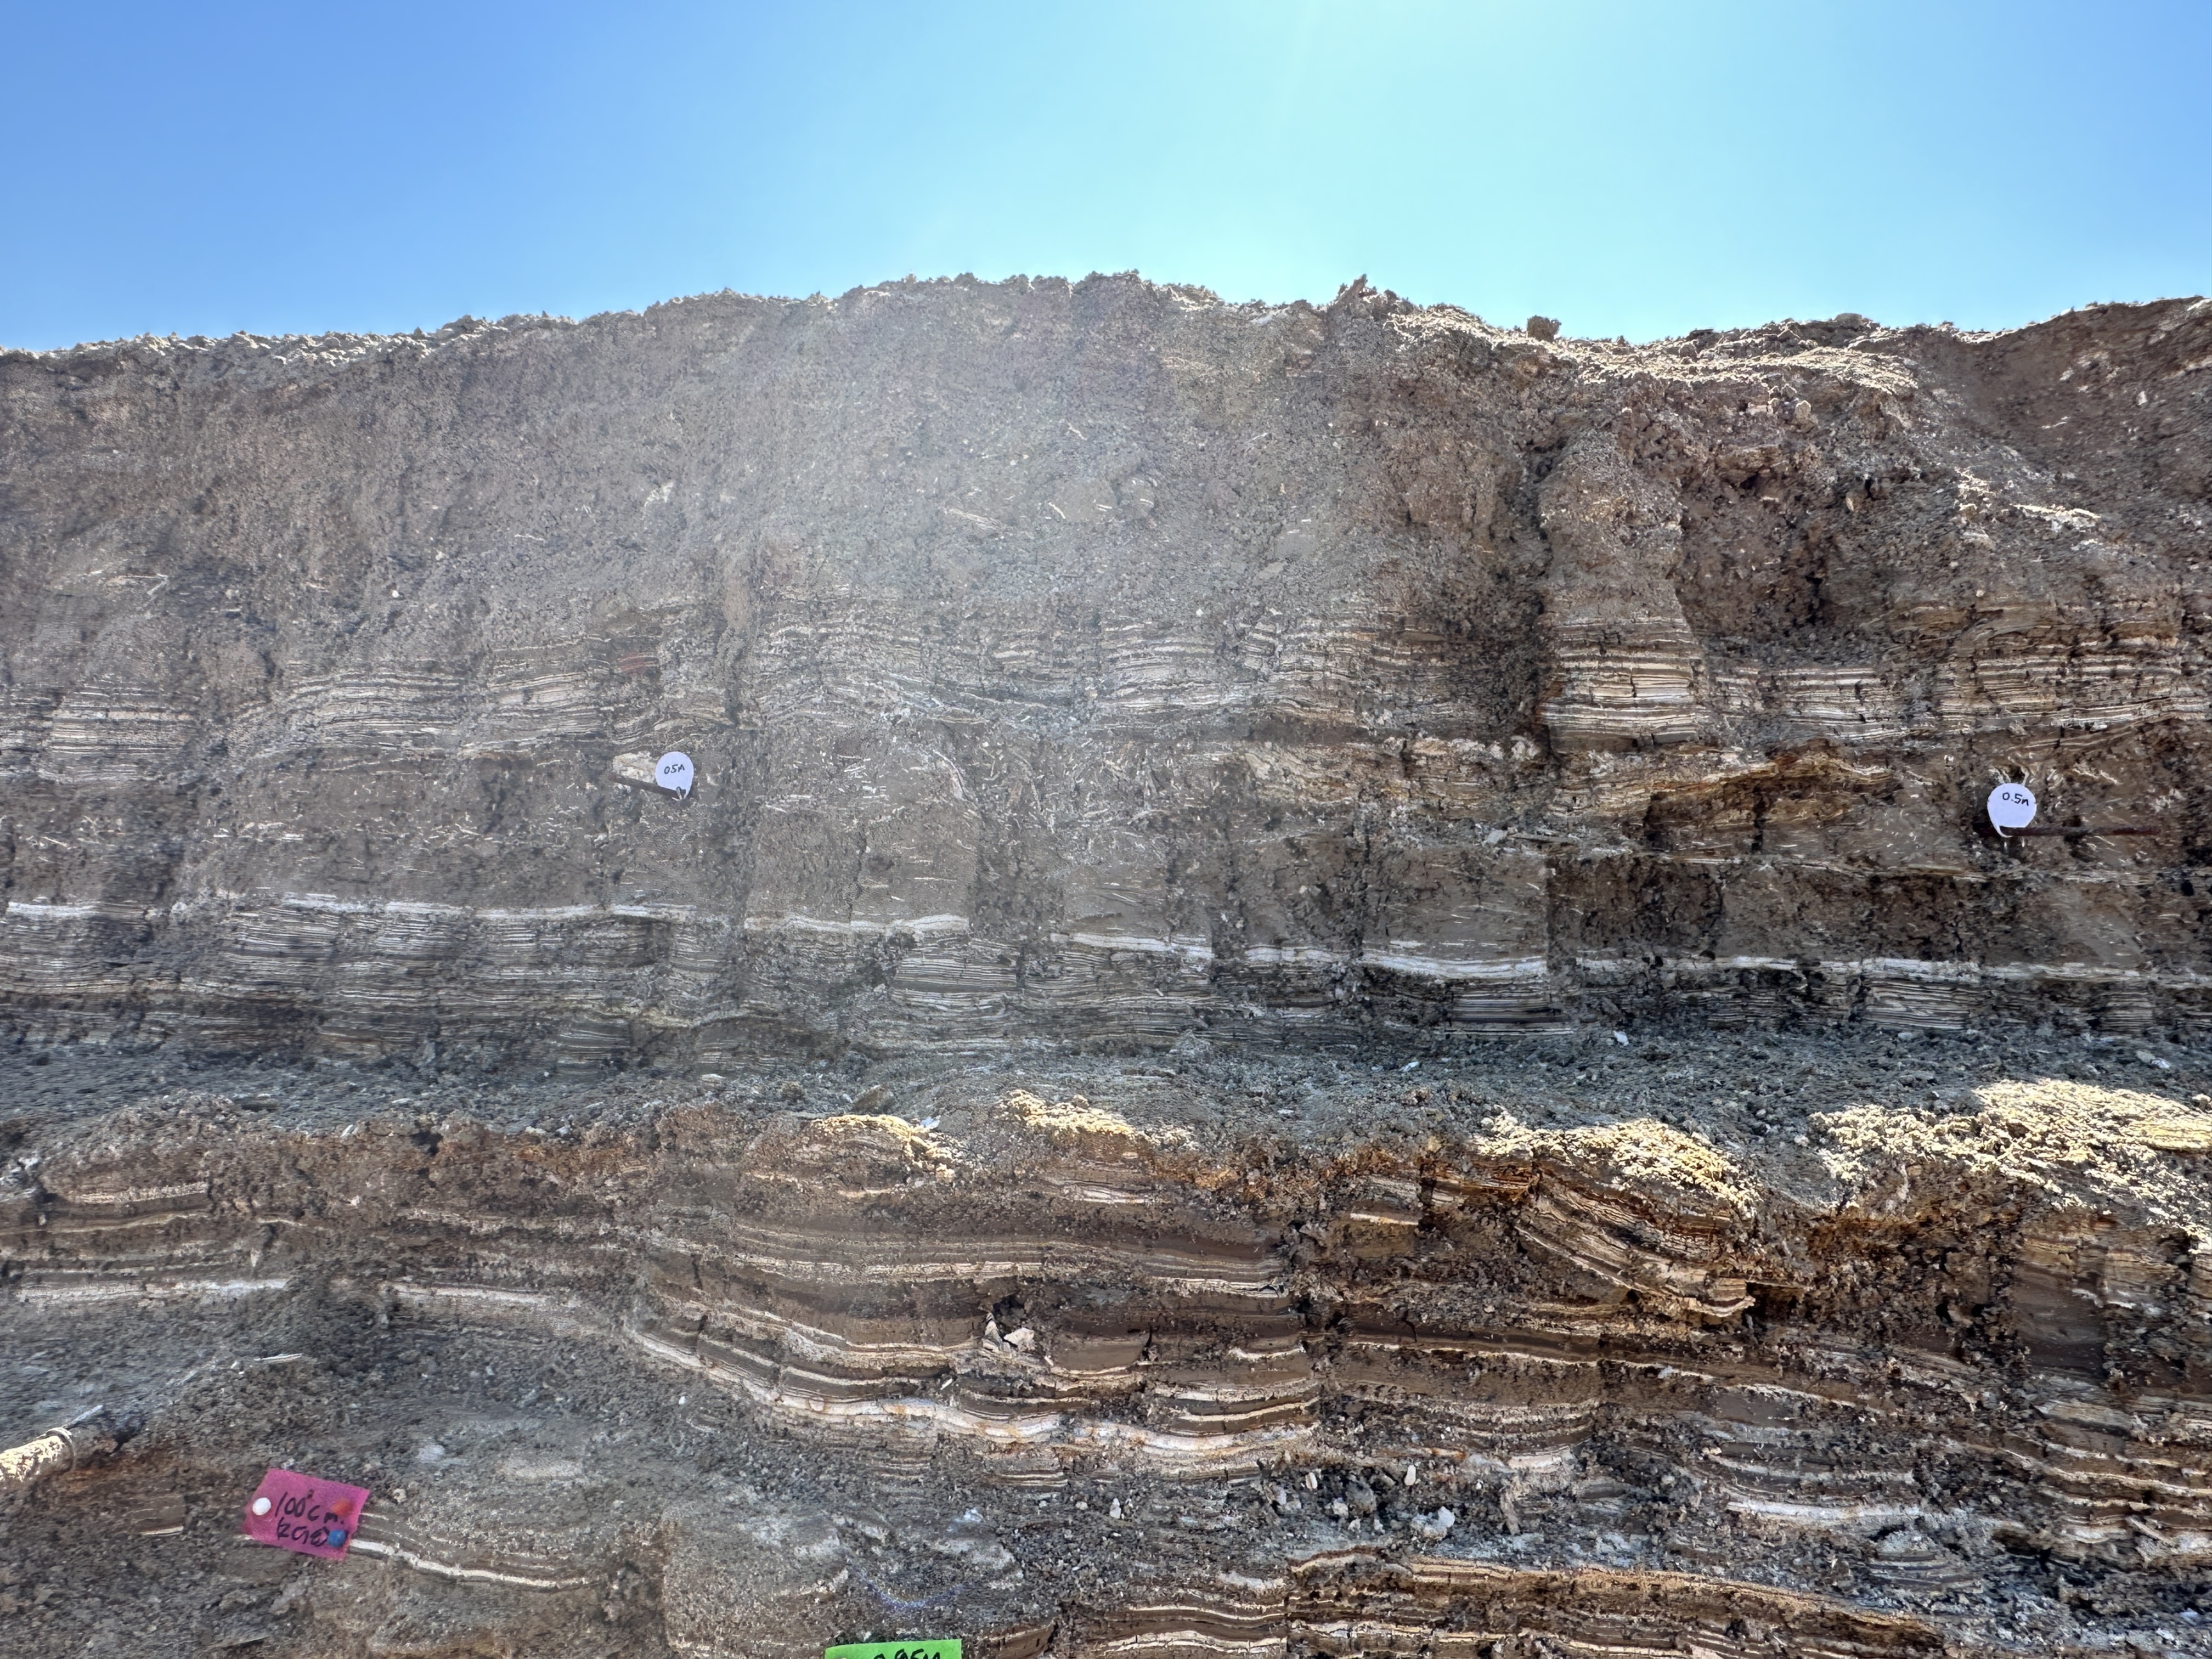 Top of Middle Section of En Gedi Trench
Photo by Jefferson Williams 17 Feb. 2023 |
Jefferson Williams |
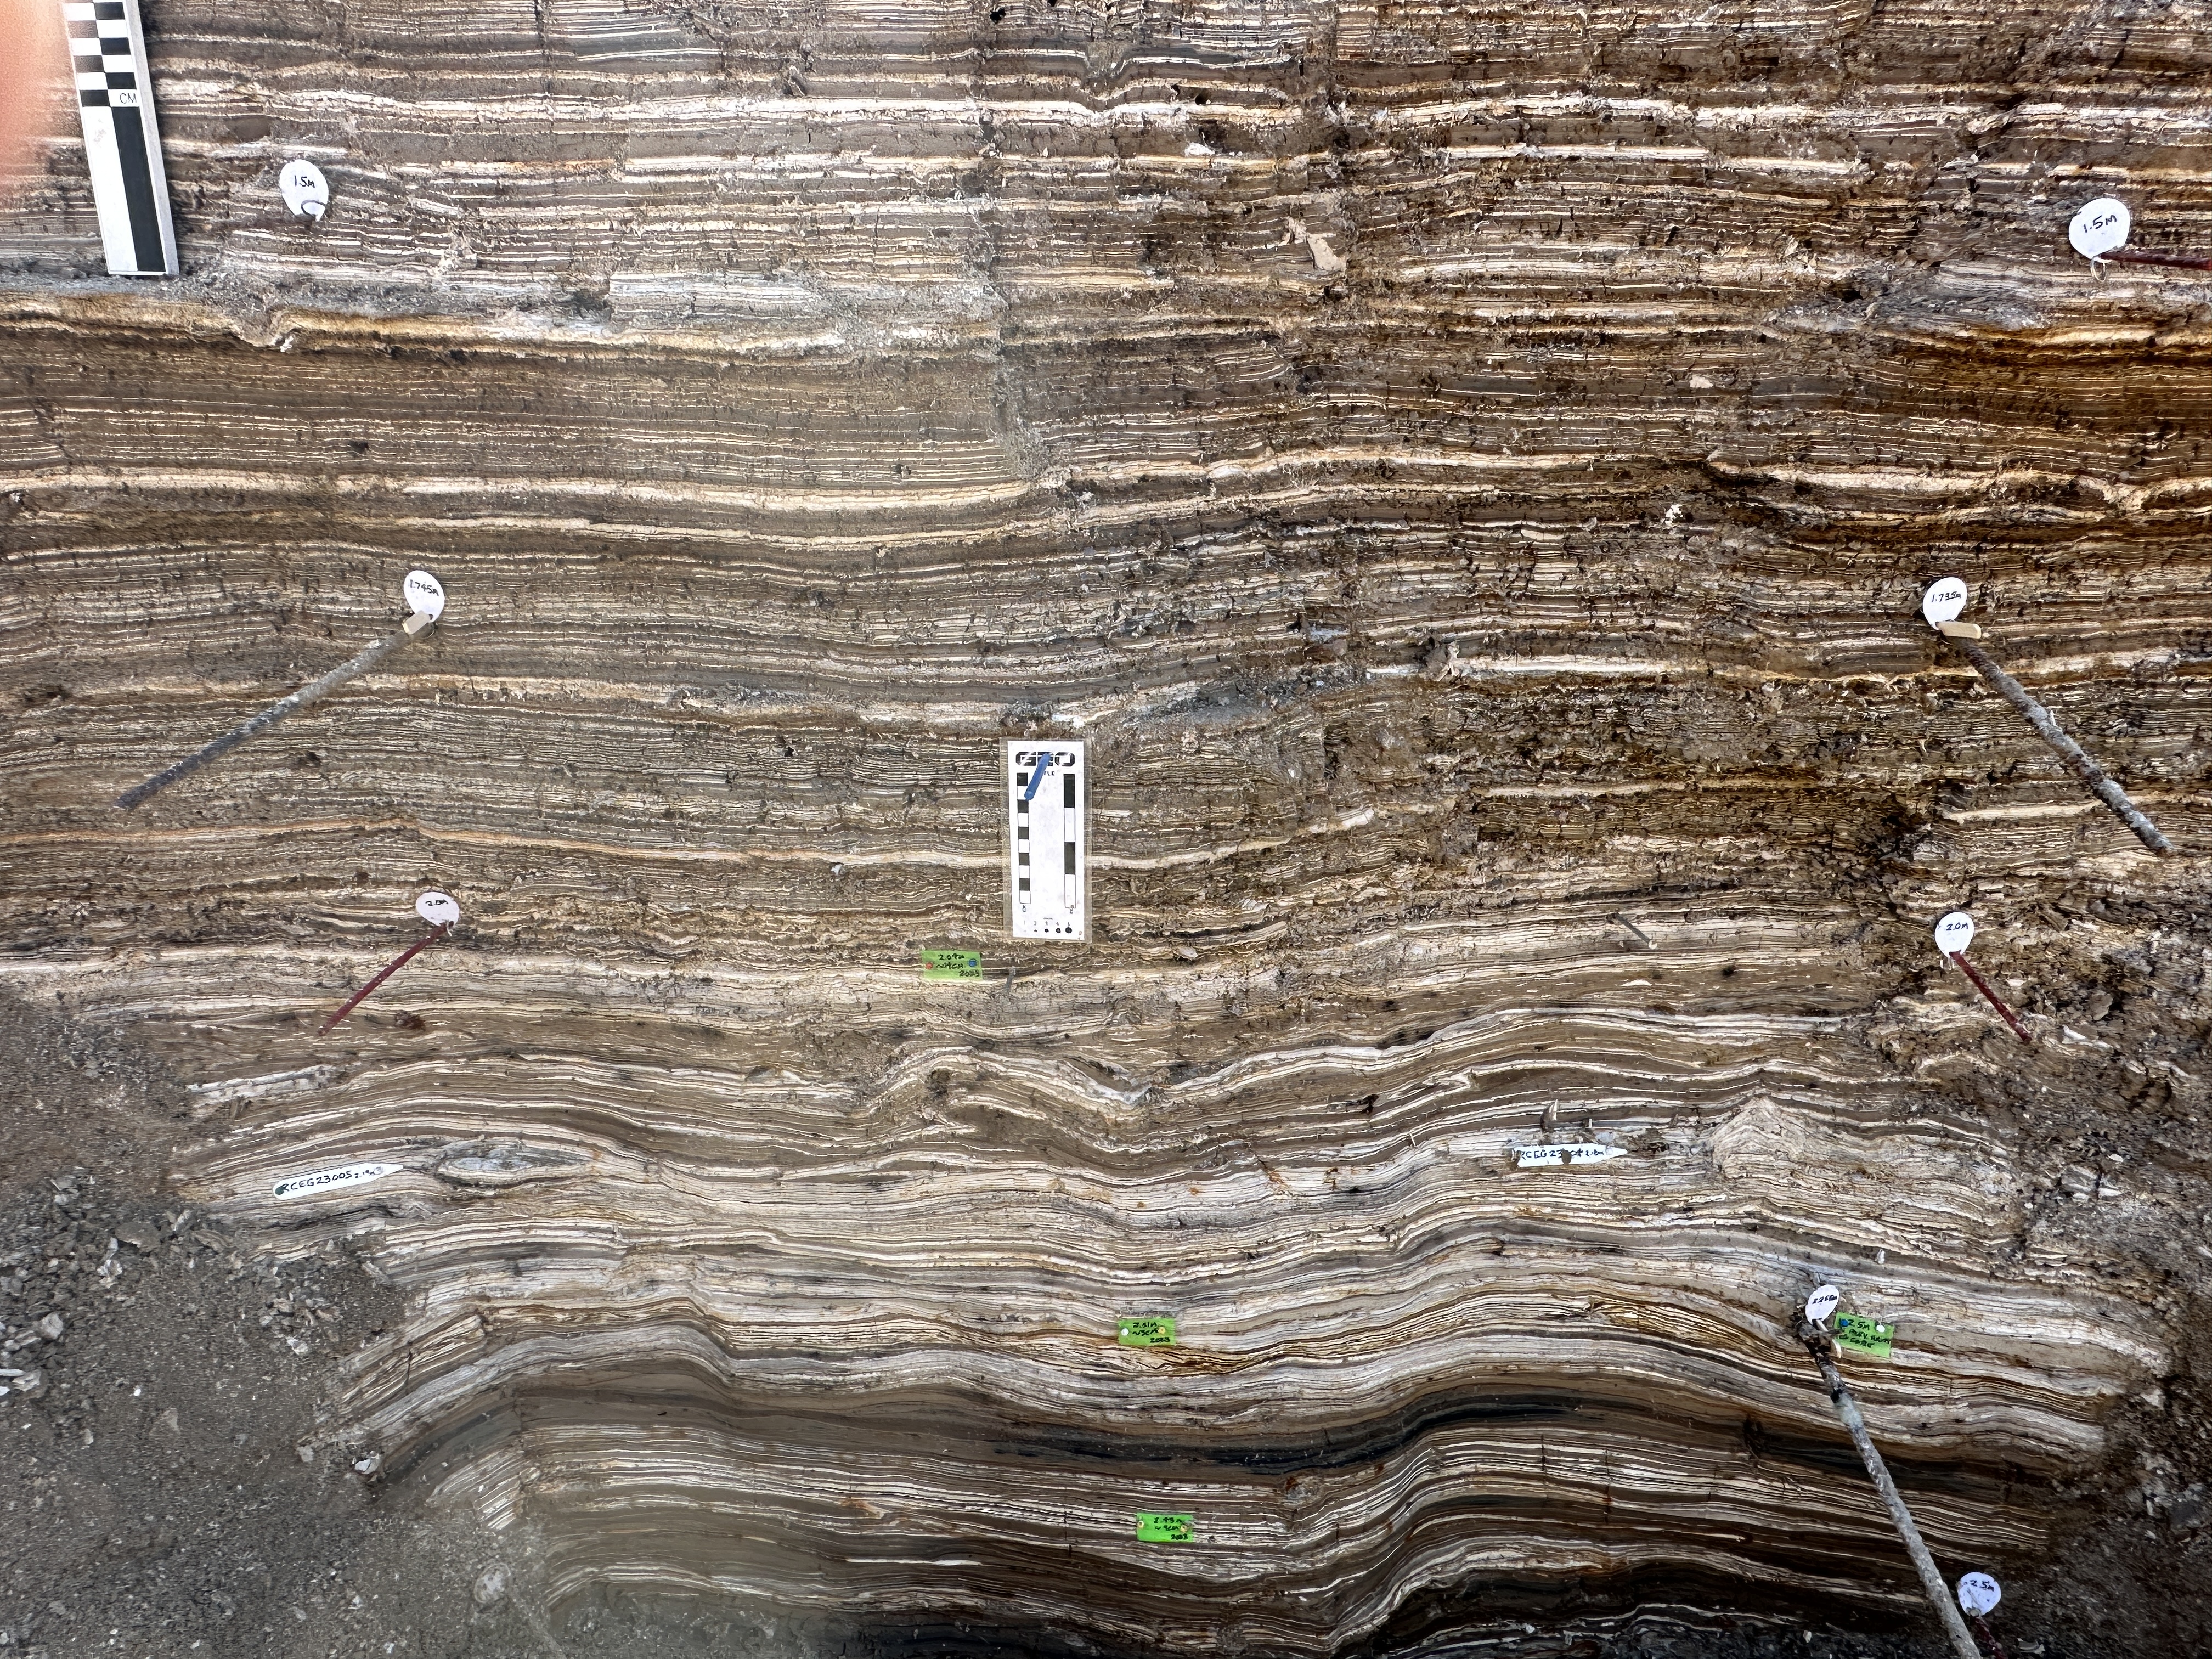
| Middle 01 of Middle Section of En Gedi Trench |
 Middle 01 of Middle Section of En Gedi Trench
Photo by Jefferson Williams 17 Feb. 2023 |
Jefferson Williams |
| Middle 02 of Middle Section of En Gedi Trench |
 Middle 02 of Middle Section of En Gedi Trench
Photo by Jefferson Williams 17 Feb. 2023 |
Jefferson Williams |
| Bottom of Middle Section (Long shot) of En Gedi Trench |
 Bottom of Middle Section (Long shot) of En Gedi Trench
Photo by Jefferson Williams 17 Feb. 2023 |
Jefferson Williams |
| Bottom of Middle Section (Medium shot) of En Gedi Trench |
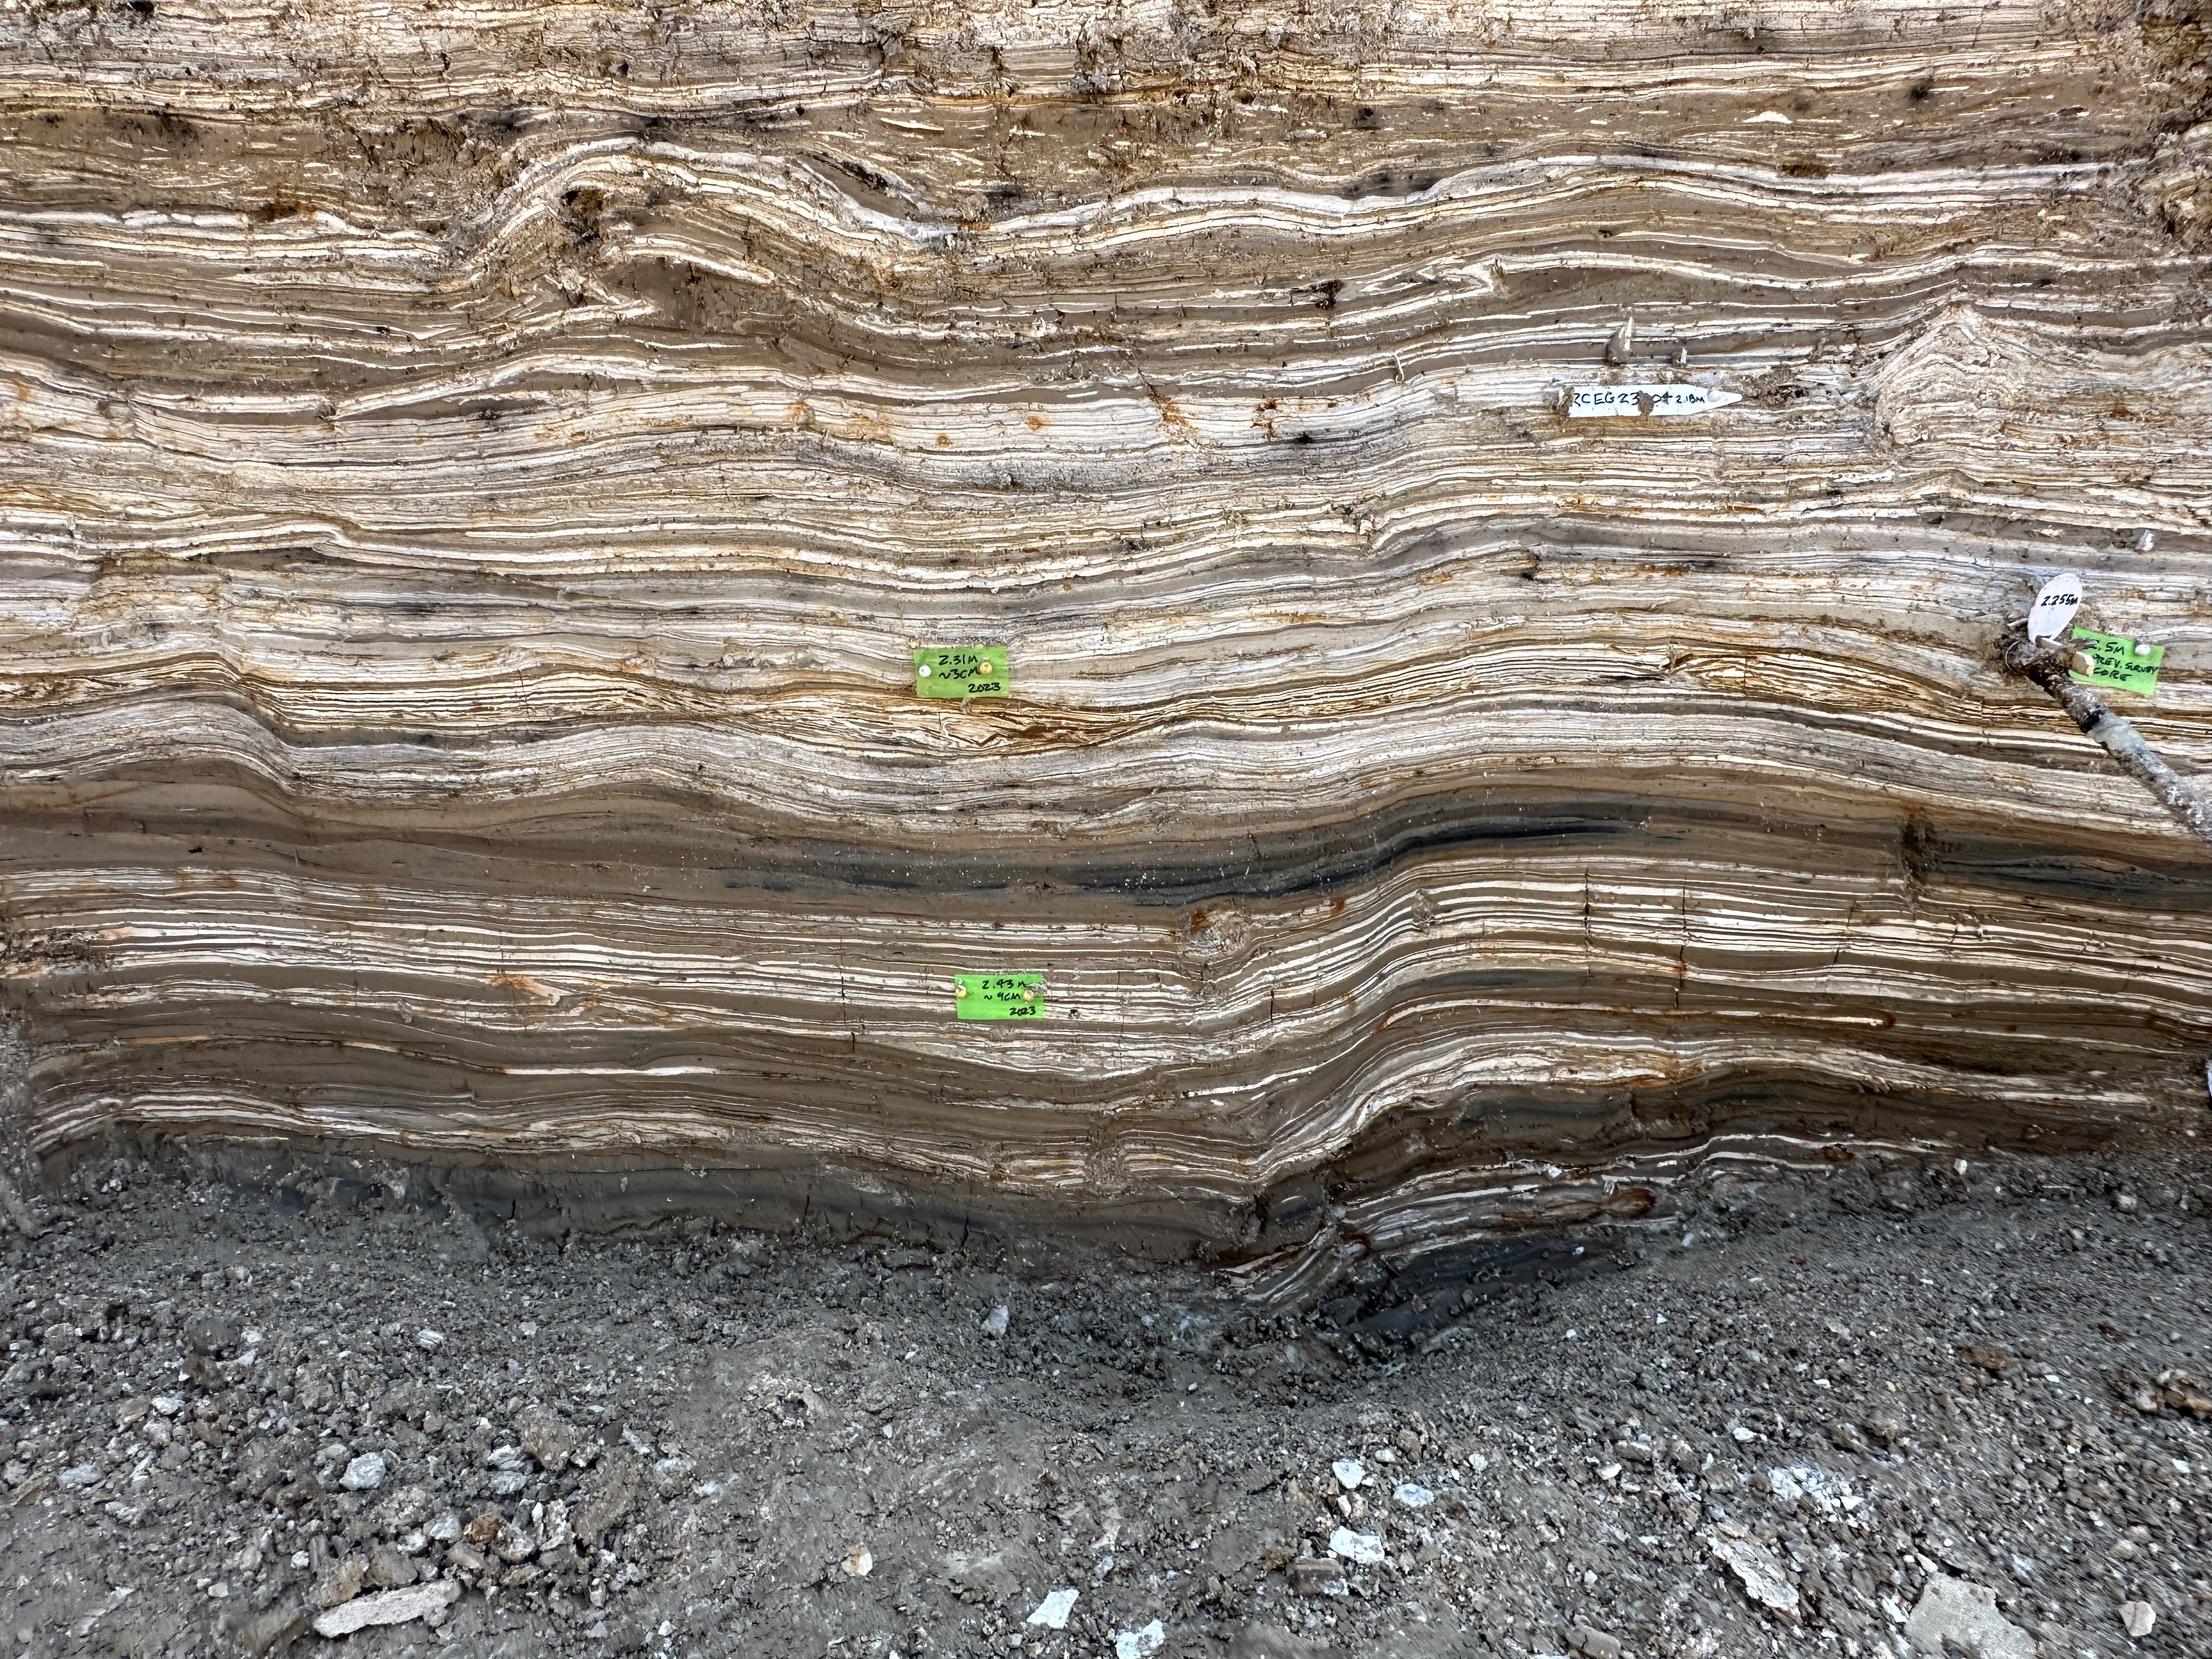 Bottom of Middle Section (Medium shot) of En Gedi Trench
Photo by Jefferson Williams 17 Feb. 2023 |
Jefferson Williams |
| Bottom of Middle Section (closeup) of En Gedi Trench |
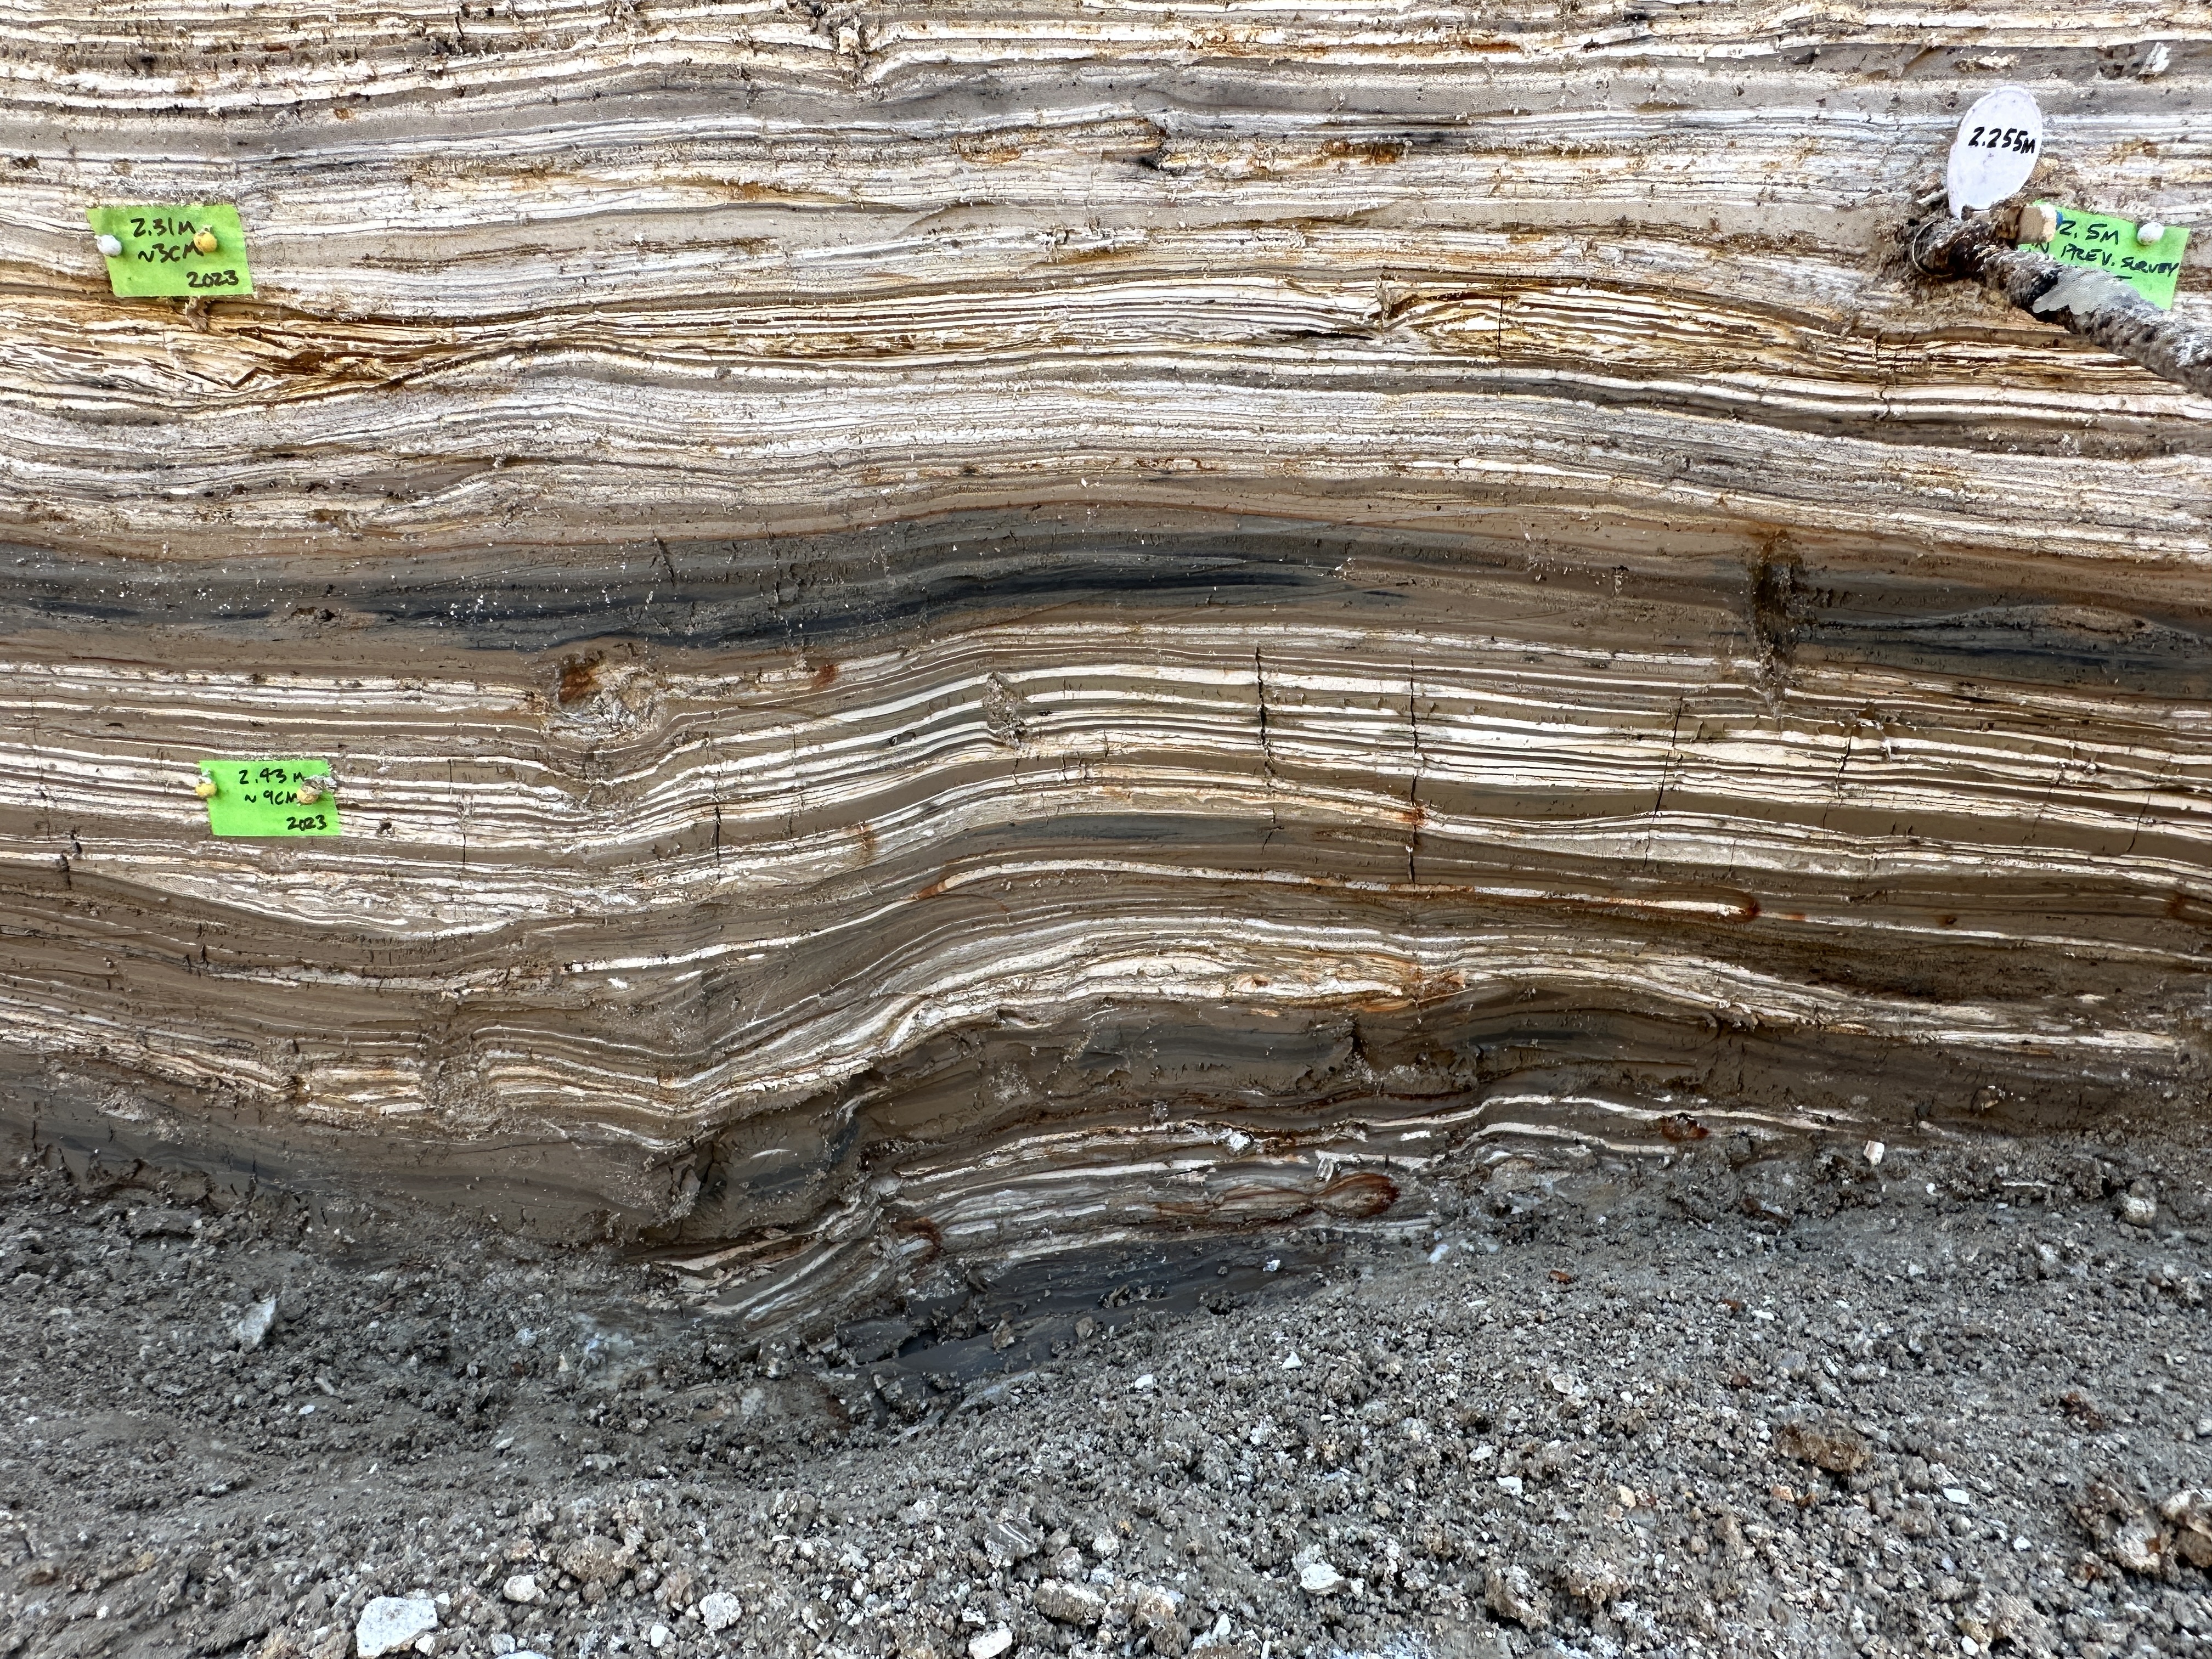 Bottom of Middle Section (closeup) of En Gedi Trench
Photo by Jefferson Williams 17 Feb. 2023 |
Jefferson Williams |
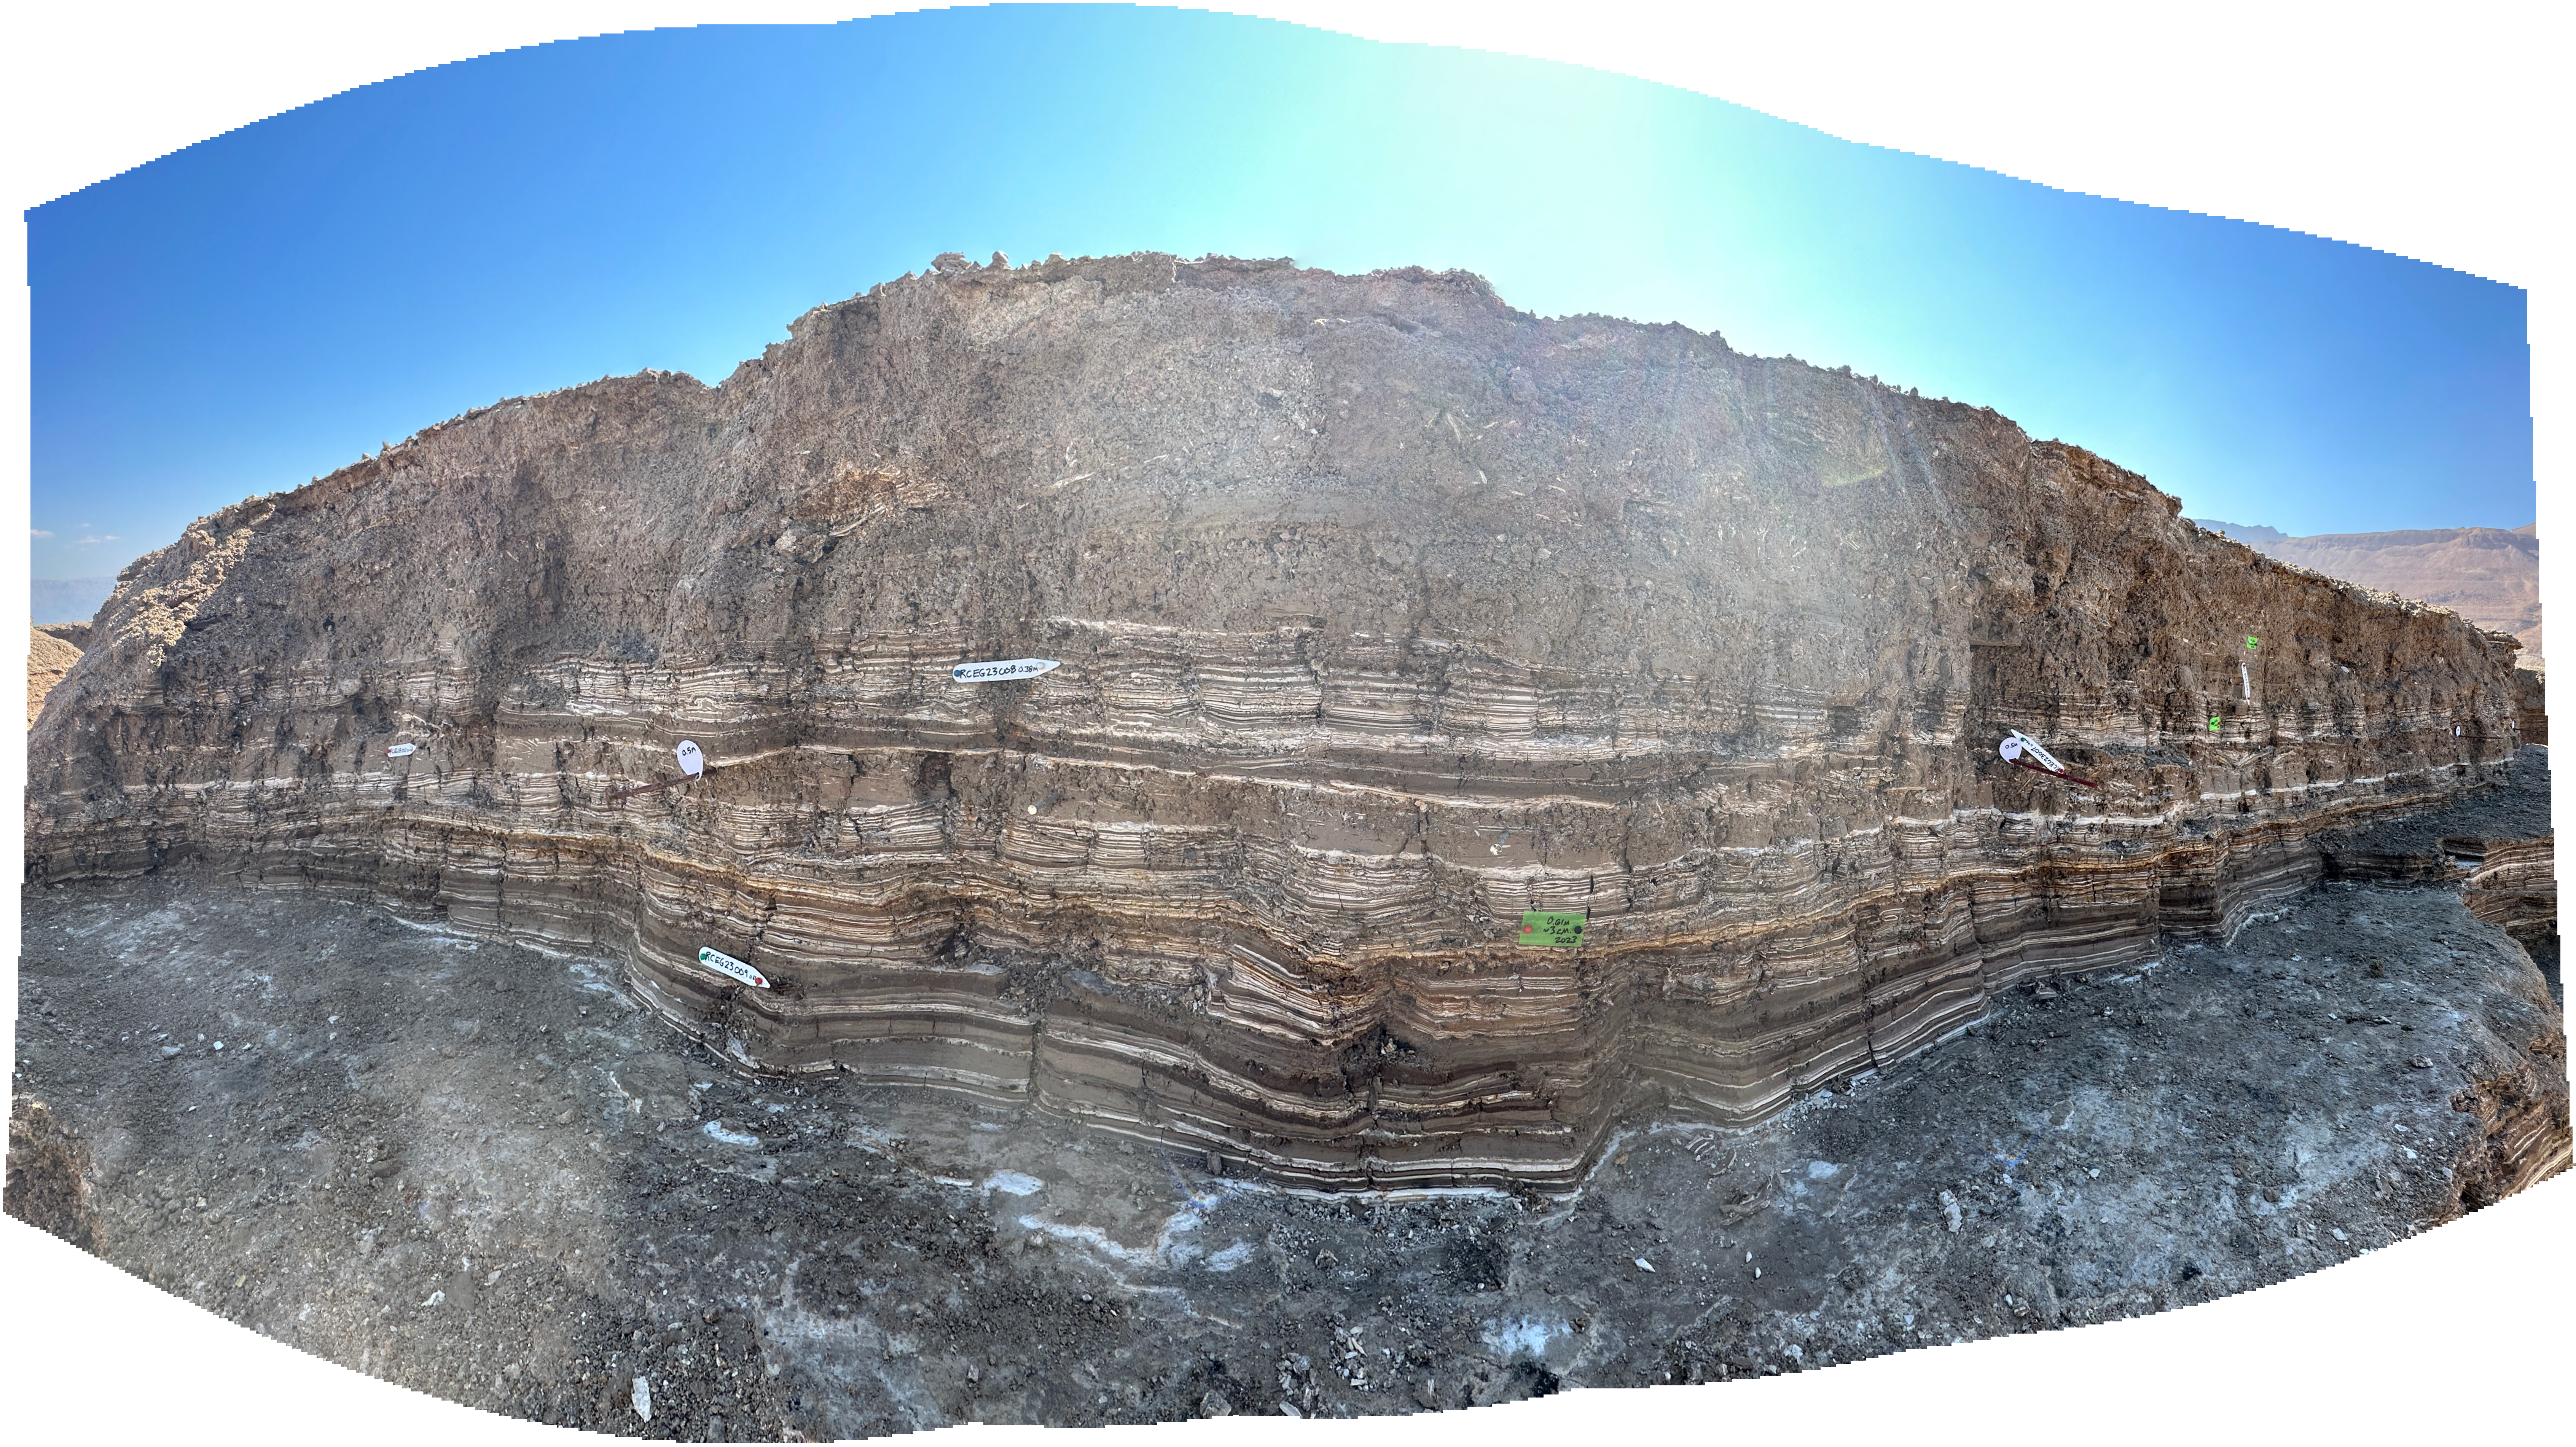
 Panorama of Entire En Gedi Trench
Click on Image for high resolution magnifiable image
Photos by Jefferson Williams 16 Feb. 2023
 Panorama of East Section of En Gedi Trench
Click on Image for high resolution magnifiable image
Photos by Jefferson Williams 16 Feb. 2023
 Panorama of Top of East Section of En Gedi Trench
Click on Image for high resolution magnifiable image
Photos by Jefferson Williams 17 Feb. 2023
 Panorama of Bottom of East Section of En Gedi Trench
Click on Image for high resolution magnifiable image
Photos by Jefferson Williams 17 Feb. 2023
 Panorama of Middle Section of En Gedi Trench
Click on Image for high resolution magnifiable image
Photos by Jefferson Williams 16 Feb. 2023
 Panorama of Top of Middle Section of En Gedi Trench
Click on Image for high resolution magnifiable image
Photos by Jefferson Williams 17 Feb. 2023
 Panorama of Middle of Middle Section of En Gedi Trench
Click on Image for high resolution magnifiable image
Photos by Jefferson Williams 17 Feb. 2023
 Panorama of Bottom of Middle Section of En Gedi Trench
Click on Image for high resolution magnifiable image
Photos by Jefferson Williams 16 Feb. 2023
 Panorama of West Section of En Gedi Trench
Click on Image for high resolution magnifiable image
Photos by Jefferson Williams 16 Feb. 2023
 Panorama of Bottom of West Section of En Gedi Trench
Click on Image for high resolution magnifiable image
Photos by Jefferson Williams 17 Feb. 2023
Core Depths were measured from surface. The core was taken about a meter above the Dead Sea level which was ~ -411 m in 1997.
In 2011, Jefferson Williams measured the elevation of the surface where the En Gedi Core (DSEn) was taken using his GPS. The recorded elevation was -411 m however GPS is
less accurate measuring elevation than it is for Lat. and Long. so this depth measurement should be considered approximate.
| Image | Description | Image | Description | Image | Description | Image | Description | |
|---|---|---|---|---|---|---|---|---|
 Composite Core
Depths 19-397 cm. Sections from top to bottom - C1, A2, A3, and A4 GFZ/GSI |
Composite Core Sections C1, A2, A3, A4 19-397 cm. |
 Litholog and Composite Core
Depths 47-325 cm. Litholog from Migowski (2001) |
Litholog and Composite Core 47-325 cm. |
 Litholog of Entire Core
Depths -30-1022 cm. (-0.3-10.22 m) Migowski (2001) |
Litholog Entire Core -30 cm.-1022 cm. |
 Litholog Legend
Migowski (2001) |
Litholog Legend |
|
 Core DSEn
Section C1 19-114 cm. GFZ/GSI |
Section C1 19-114 cm. |
 Core DSEn
Section A2 114-196 cm. GFZ/GSI |
Section A2 114-196 cm. |
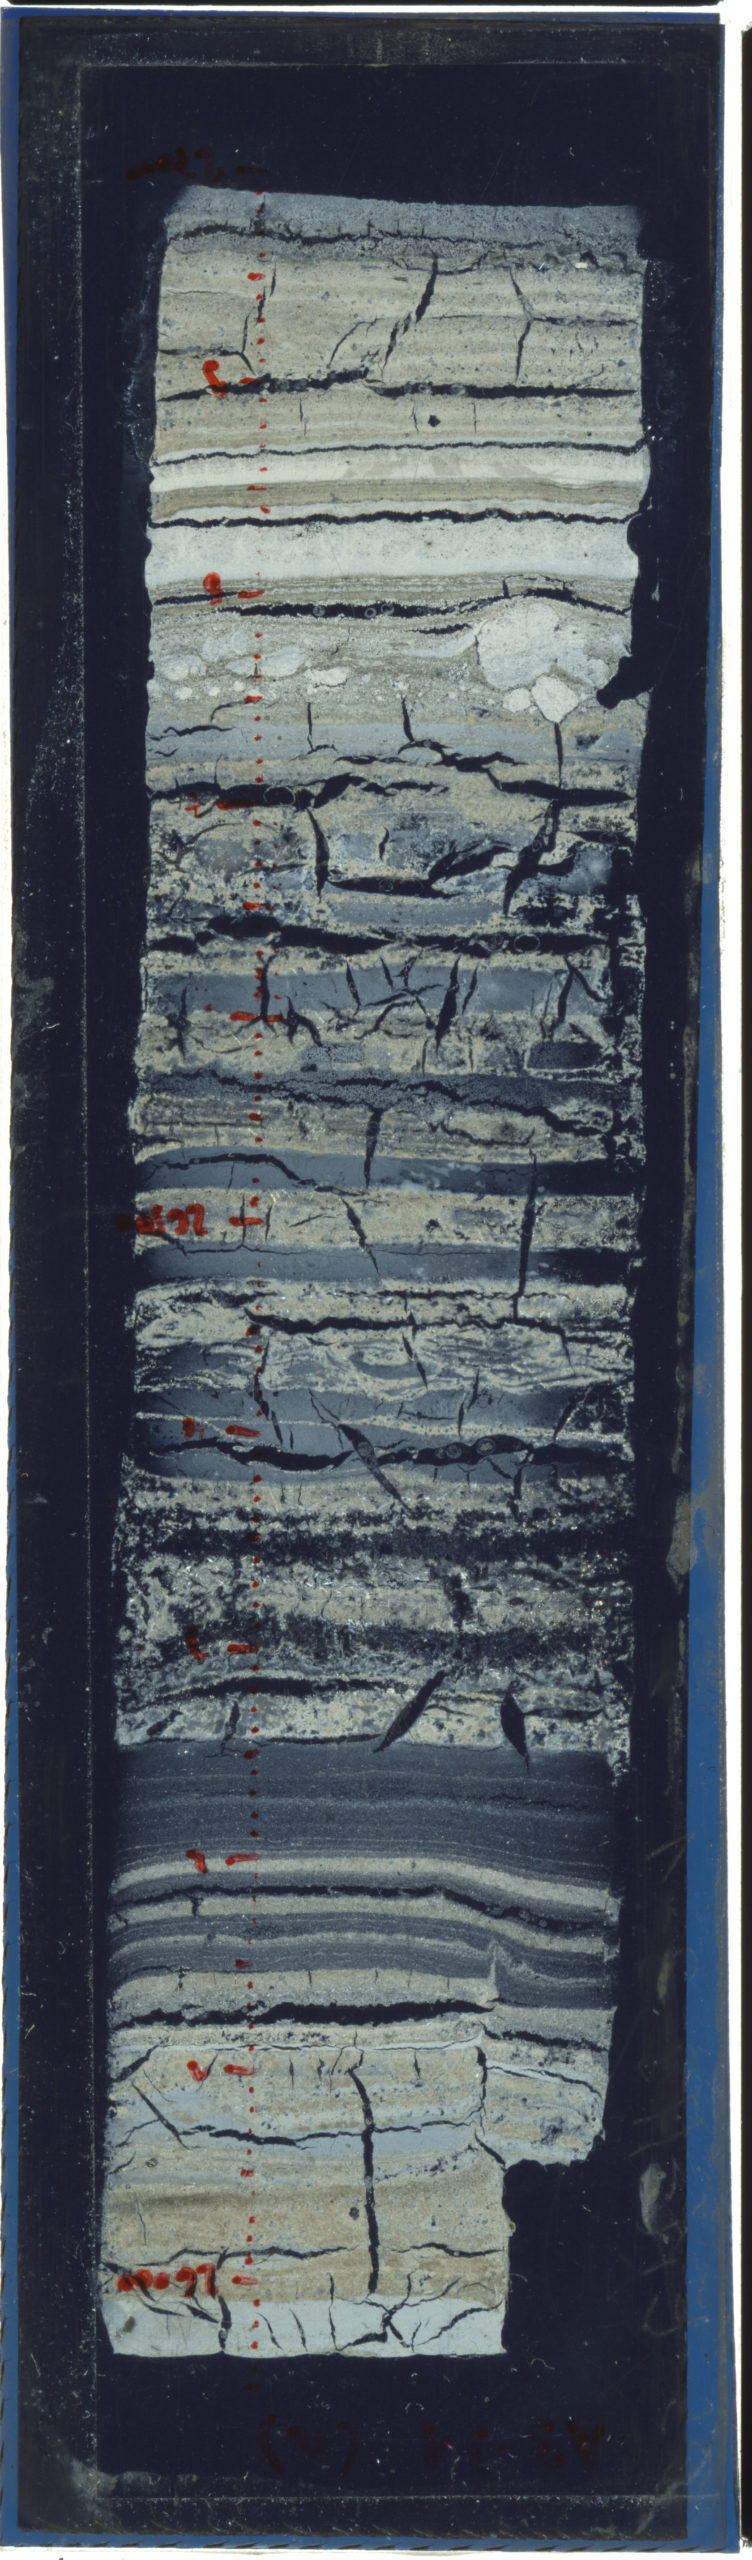
 Core DSEn
Section A3 200-296 cm. GFZ/GSI |
Section A3 200-296 cm. |
 Core DSEn
Section A4 300-397 cm. GFZ/GSI |
Section A4 300-397 cm. |
|
 Figure 9
Photo of breccia layer from the Ein Gedi drill core that matches the historical earthquake of 1458 A.D. (Migowski et al., 2004). Agnon et al. (2006) |
1458 CE Quake 65-80 cm. |
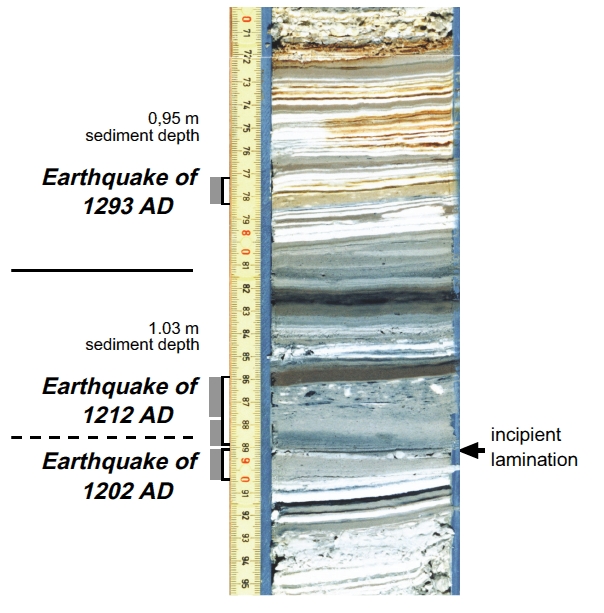 Figure 10
Photo of a section of the Ein Gedi core containing three breccia layers with the respective dates of earthquakes. The 1202 A.D. event is barely determined because the 1212 event almost obliterated the 10-yr-old breccia. Nonetheless, a few laminae (arrow) can be resolved above event horizon 1202 A.D. Migowski et al. (2004) have inferred five unresolved events by correlation of the lamina-counting record of breccia layers with the historical record of destructive earthquakes. Agnon et al. (2006) |
1202, 1212, and 1293 CE Quakes 90-115 cm. |
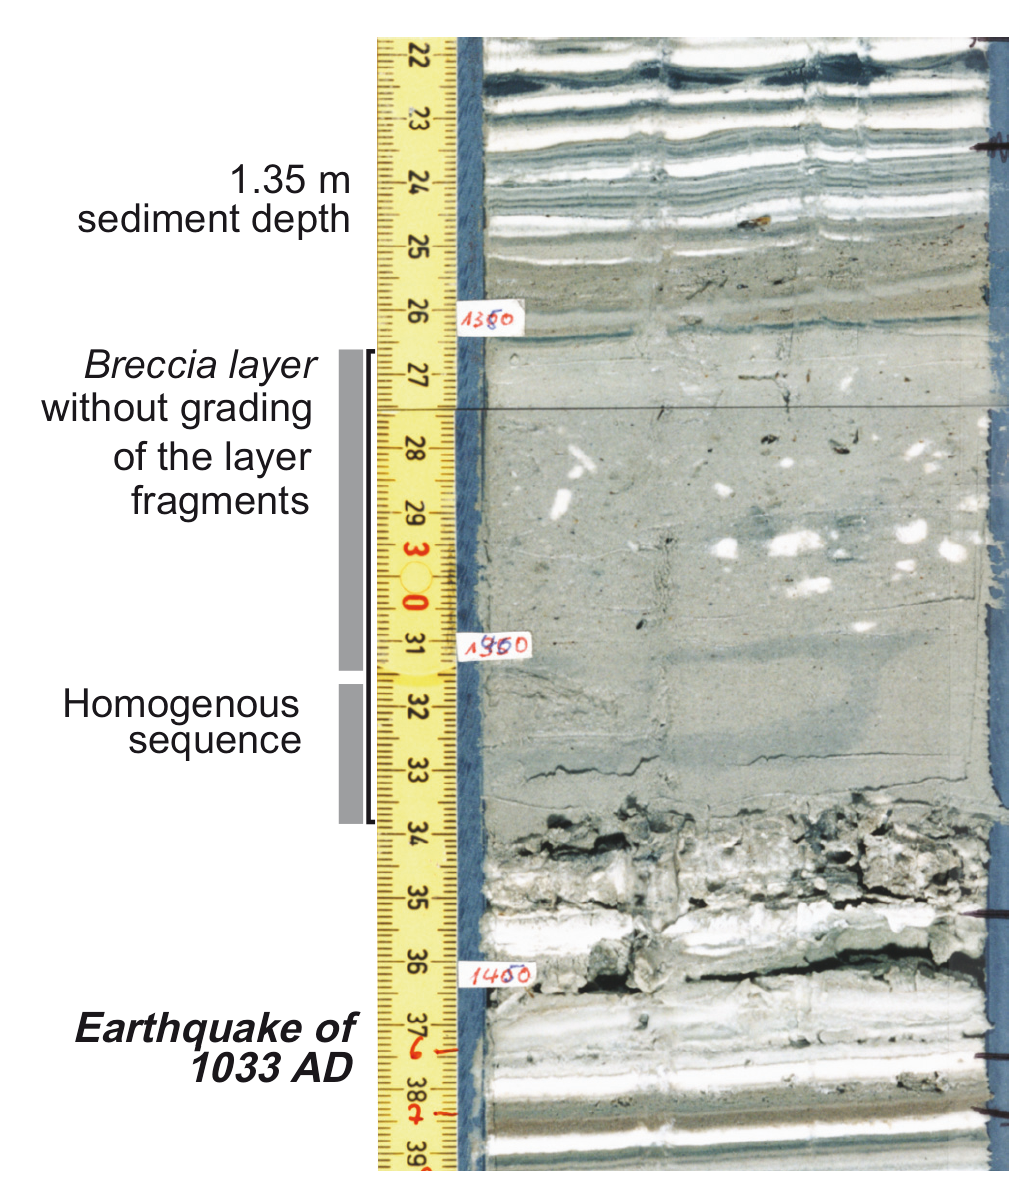 Figure 9
Photo of breccia layer from the Ein Gedi drill core that matches the historical earthquake of 1033 A.D. (Migowski et al., 2004). Agnon et al. (2006) |
1033 CE Quake 131-143 cm. |
|||
 Thin Section A3_3_1a
Flatbed Scan 259.7-269.9 cm. 2597-2699 mm. |
Thin Section A3_3_1a 259.7-269.9 cm. |
 Thin Section A3_3_2
2.5x Magnification Polarized 271.5-273.7 cm. 2715-2737 mm. |
Thin Section A3_3_2 271.5-273.7 cm. |
 Thin Section A3_3_3
2.5x Magnification Polarized 273.5-283.5 cm. 2735-2835 mm. |
Thin Section A3_3_3 273.5-283.5 cm. |
 Thin Section A3_4_1
Flatbed Scan 283.3-293.4 cm. 2833-2934 mm. |
Thin Section A3_4_1 283.3-293.4 cm. |
|
 SEM Image
250x Magnification Sample EG13 Very bottom of Dark Clastic layer above Jerusalem Quake 5-7 mm. Sample taken in En Gedi Trench by Jefferson Williams |
SEM Image 250x Magnification Sample EG13 from En Gedi Trench |
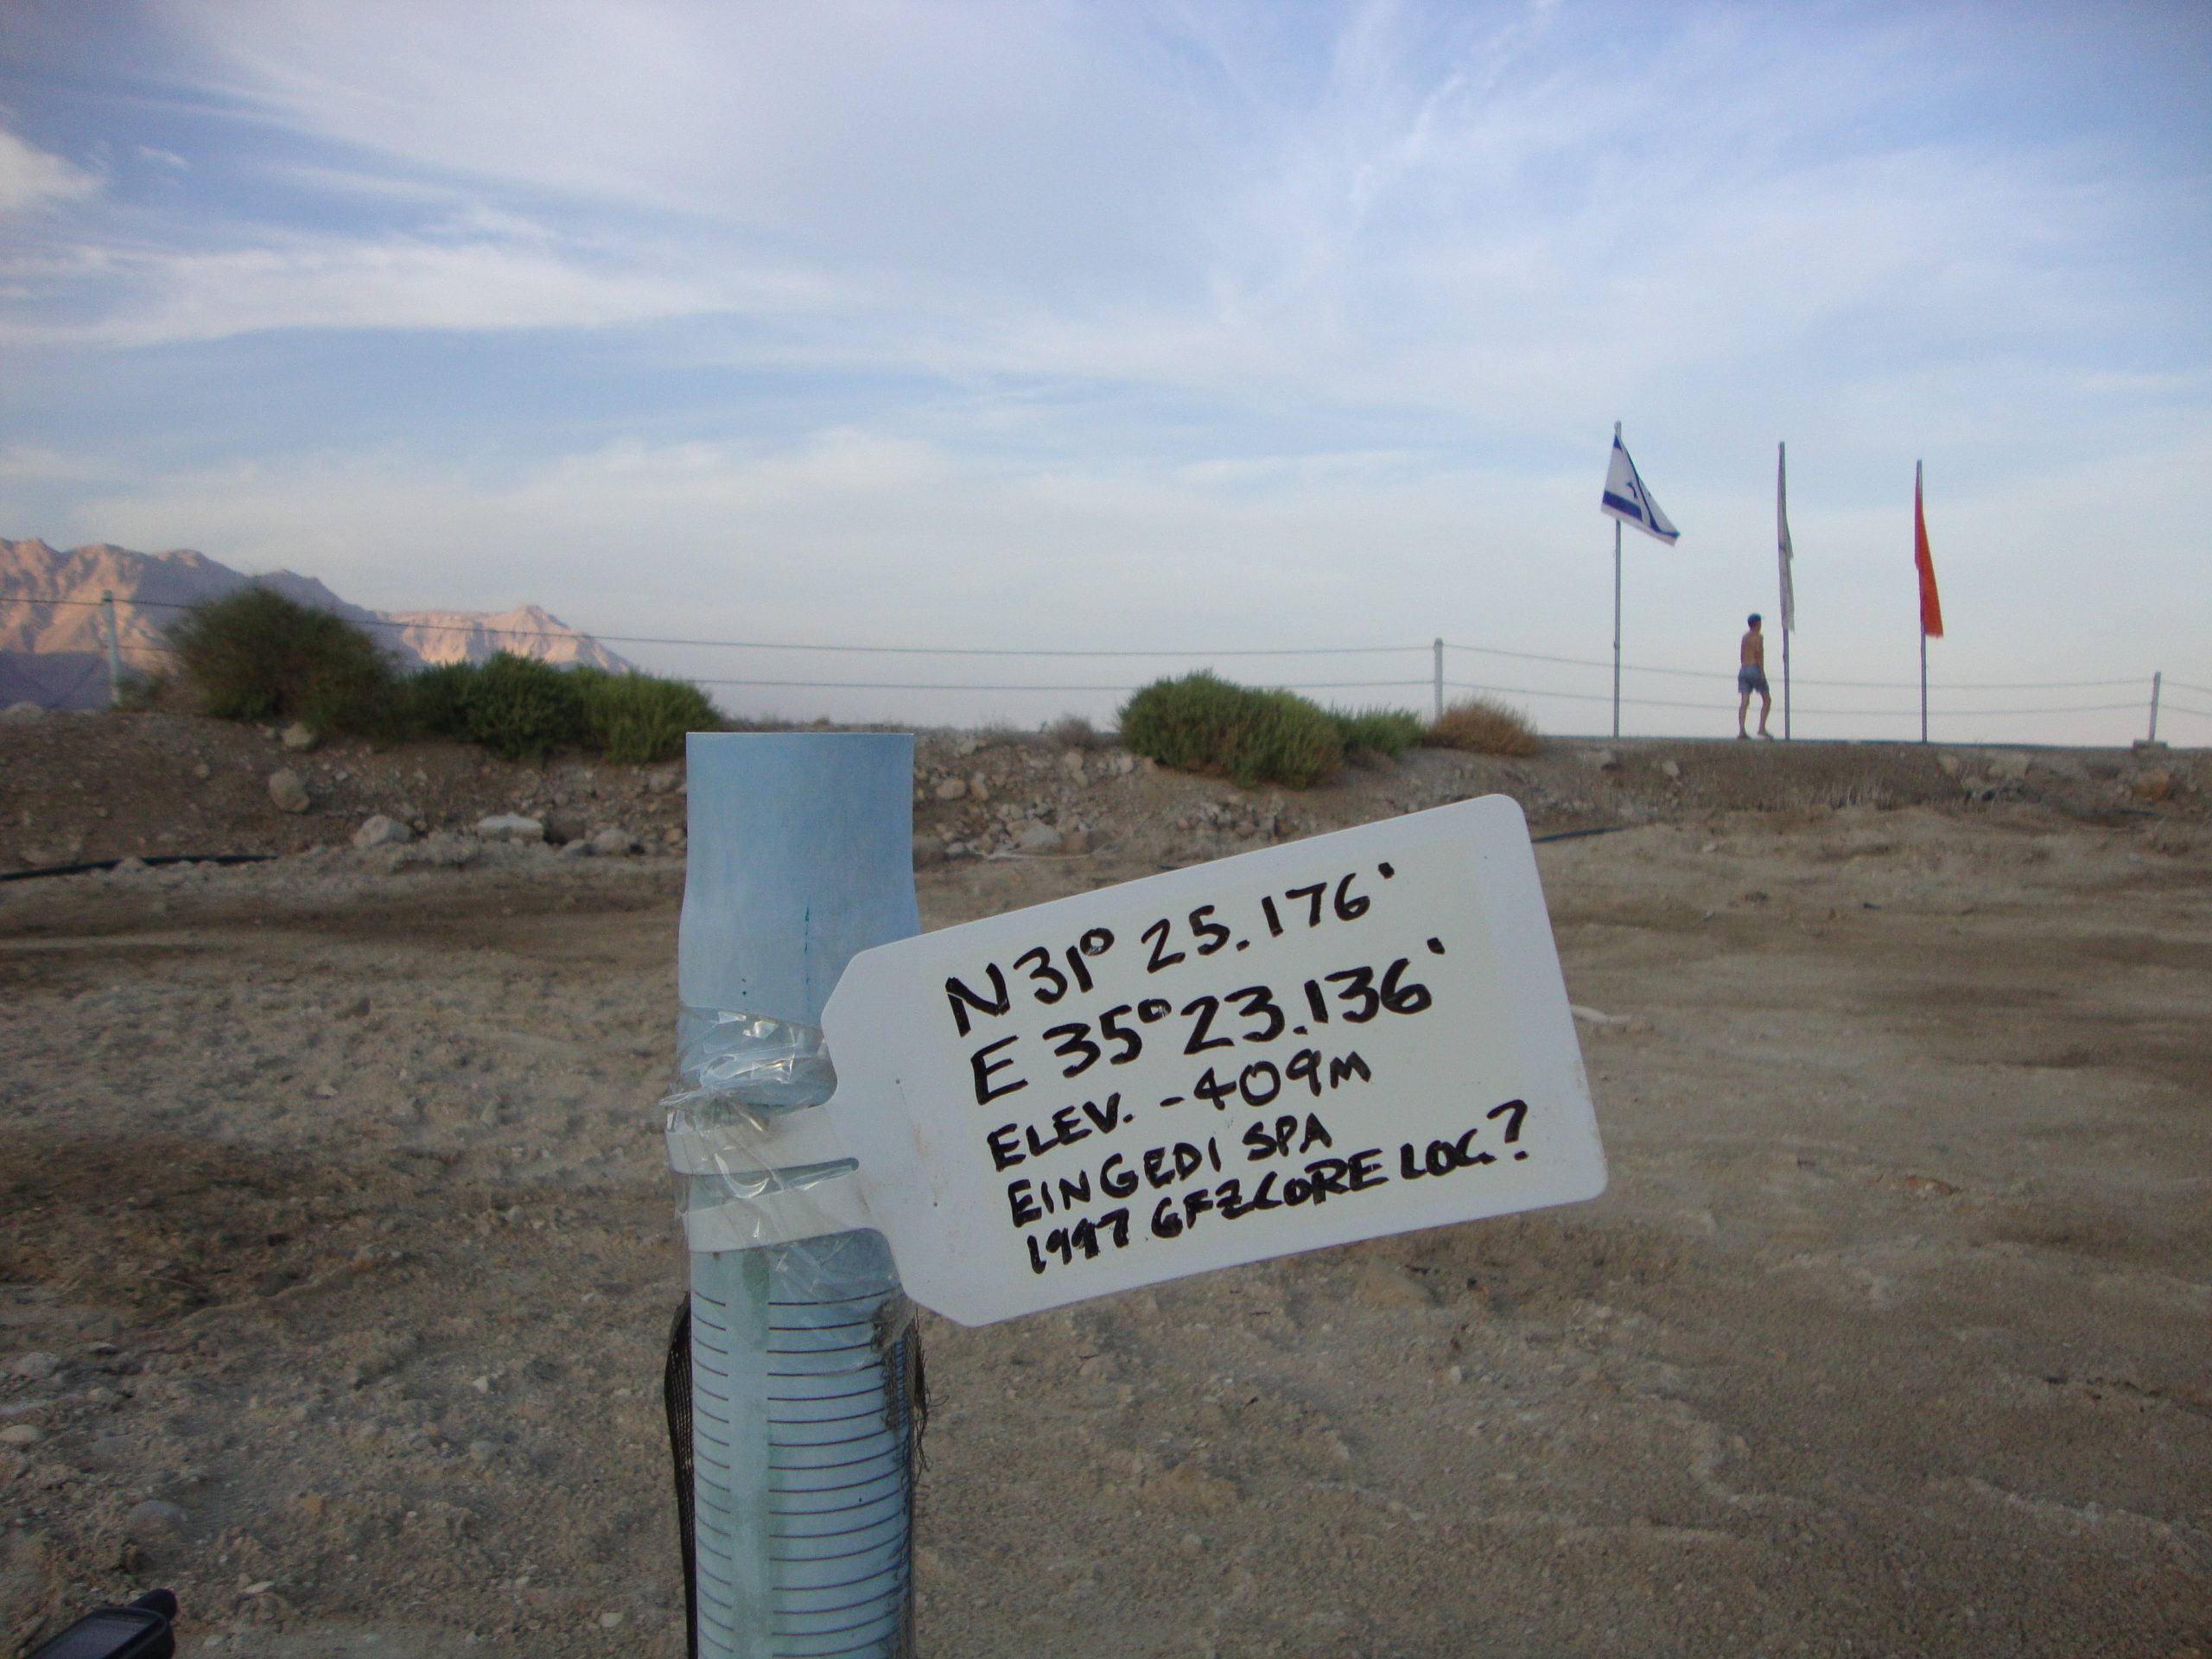 Photo showing location of 1997 GFZ/GSI core at En Gedi Spa (DSEn)
Photo taken by Jefferson Williams in 2010 |
Photo showing location of 1997 GFZ/GSI core at En Gedi Spa (DSEn) Lat = 31° 25.176' N Long = 35° 23.136' E Inaccurate Elevation |
 Table 2
Deformed sequences of the Ein Gedi site and their correlation with earthquakes
click on image to open in a new tab
Migowski et al. (2004)
- from Kagan et al. (2011) Correction
- these have been incorporated into the Master Seismic Events Tables for all sites
 Table 4
Multisite Comparison of Holocene Seismites from four lacustrine sediments sites along the Western Dead Sea Basin
Kagan et al (2011)
 Table 4
Multisite Comparison of Holocene Seismites from four lacustrine sediments sites along the Western Dead Sea Basin
Kagan et al (2011)
- from Kagan et al. (2011)
- these have been incorporated into the Master Seismic Events Tables for all sites
 Table 4
Multisite Comparison of Holocene Seismites from four lacustrine sediments sites along the Western Dead Sea Basin
Kagan et al (2011)
- from Kagan et al. (2011)
 Figure 7
Recurrence intervals and cumulative number of breccias in time.
- Ein Feshkha (EFE)
- Ein Gedi (EG)
- Zeelim (ZA1 and ZA2)
- Diamonds represent breccias
- circled diamonds are the IBS (intrabasin seismites)
- Horizontal gray bars indicate periods of seismic quiescence
(left) the earlier period is recorded at EG and ZA, and (right) the younger quiescence period is recorded at all three sites. Horizontal lines connect IBS events at the three sites.
Kagan et al (2011)
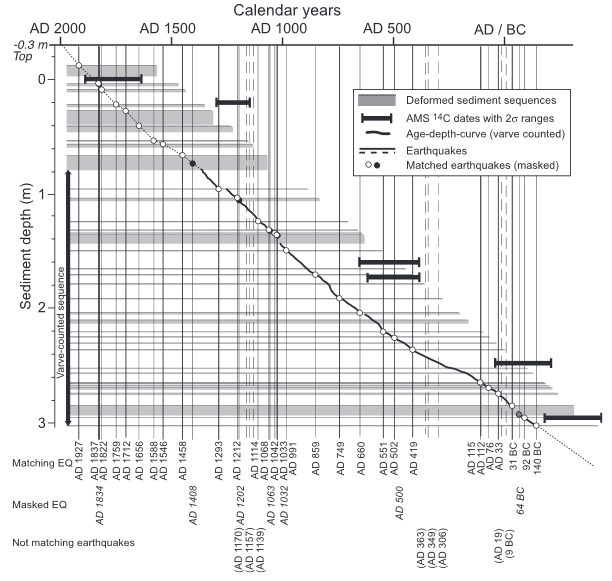 Figure 4
The age-depth model of the Ein Gedi profile is derived from radiocarbon dating (black bars indicate 26 ranges) and varve-counting between 0.78 and 3.03 m. The floating annual chronology is anchored by a systematic comparison and correlation of deformed sediment sequences (grey bars) to a succession of historical strong earthquakes.
Migowski et al (2004)
- from Migowski (2001)
 Fig. 7.5
The age-depth model of the Ein Gedi profile is made possible by a shift of up to 350 years.
x-axis - Age [yrs cal BP]
y-axis - Sediment Depth [m]
German
Abb. 7.5
Das Alters-Tiefen-Modell des Ein Gedi-Profils wird durch die Zuordnung zu den Erdbeben um bis zu 350 Jahre verschoben.
Migowski (2001)
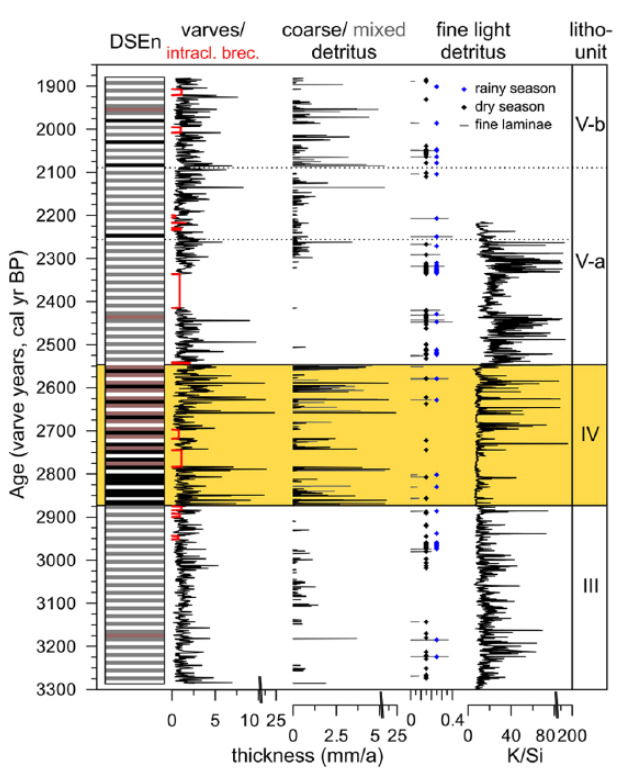 Figure 5
Varve counting and thin section analysis results of core DSEn (2.10–4.35 m composite depth)
Tracks from left to right
varve thickness including intraclast breccias [in red] (‘seismites’, following Agnon et al., 2006)
thickness of coarse and mixed detrital layers; fine light detrital laminae thickness (grey bars) and cloudily distributed occurrences of the same material within aragonite laminae (dry season, black diamonds) and within common detrital layers (rainy season, blue diamonds)
K/Si ratio derived from µ-XRF
Lithological units correspond to those in Figure 4. For a legend of the core lithology, see Figure 2.
Neugebauer at al (2015)
 Figure 2
DSEn and 5017-1 sediment profiles, magnetic susceptibility data (Mag. Sus.) and modelled 14C age–depth plots with 68.2% (dark grey; ~1σ error) and 95.4% (light grey; ~2σ error) confidence intervals
note that for 5017-1, the lowermost age included in the model (4673 ± 85 cal. yr BP at 32.36 m; Table 1) is not shown here for better readability of the figure
highlighted intervals
- ~3500–3300 cal. yr BP
- ~3000–2400 cal. yr BP
LU = lithological units (I–V) as in Figure 4.
Neugebauer at al (2015)
 Supplementary Figure S1
Correlation of cores DSEn and 5017-1 by radiocarbon ages, a marker layer (ML) and a characteristic succession of gypsum deposits.
Neugebauer at al (2015)

(a) Comparison of the Dead Sea data to other records
- difference in the total solar irradiance ΔTSI from the year 1986, 1365.57 W/m2 (Steinhilber et al., 2009)
- clay layer frequency record from the Black Sea (solid line - core GeoB7622, dashed line - core GeoB7625, thick line - 3-point moving average) - Lamy et al., 2006
- Dead Sea lake-level reconstruction based on core DSEn (dark blue line - Migowski et al. (2006), light blue line - this study
- Dead Sea K/Si ratio from µ-XRF element scanning (this study)
- Dead Sea coarse and mixed detrital layer thickness (this study)
- Soreq Cave δ18O speleothem record (Bar-Matthews et al., 2003) showing only very minor changes over the entire period investigated here
- Red Sea terrigeneous sand accumulation rate (core GeoB5804-1, thick line - 5-point moving average) - Lamy et al., 2006
- Red Sea stable oxygen isotope difference Δδ18O between planktic and epibenthic foraminifera (core GeoB5804-1, thick line - 5-point moving average) - Lamy et al., 2006
AO/NAO: Arctic Oscillation/North Atlantic Oscillation
4. and 5. from core DSEn and on radiocarbon-based age scale
(b) Inferred humidity changes in the eastern Mediterranean during the two dry periods at the Dead Sea, discussed here.
Neugebauer at al (2015)
 Fig. 2
Lithology of the sediment cores and the established age-depth models of the different profiles. The Ze'elim coring profile is paralleled by the Ze'elim gully wall [16] . The Ein Gedi chronology is based on 20 radiocarbon dates and on the varve counted section (black line) in the upper part.
Migowski et. al. 2004
 Appendix B
Detailed lithological description of the Ein Gedi core.
click on image to open in a new tab
Migowski et al. (2006)
 Figure 5
Interpreted log of Ein Gedi core thin-section A3-3-2 (composite core depth 2715–2755 mm) and overlapping thin-section A3-3-3 (composite core depth 2737–2833 mm). As a result of thin-section microstratigraphy and varve quality determination, a composite varve chronology is shown in the central column.
Williams et. al. (2011)
 Figure 6
Interpreted log of Ein Gedi core (for explanation see Figure 5)
Williams et. al. (2011)
- from Agnon et al. (2006)
 Figure 9
Photos of breccia layer from the Ein Gedi drill core that match the historical earthquake of 1033 A.D. (Migowski et al., 2004).
click on image to open in a new tab
Agnon et al. (2006)
 Figure 3
Two typical examples of disturbed sediment sequences in the Ein Gedi profile: The sequence between 0.65 and 0.78 m core depth is correlated with the earthquake of A.D. 1458, whereas the earlier event of the year A.D. 1408 is masked in the sequence (left). The sequence between 1.35 and 1.42 m depth is identified as being created during the earthquake of A.D. 1033 (right).
click on image to open in a new tab
Migowski et al. (2004)
- from Agnon et al. (2006)
 Figure 10
Photo of a section of the Ein Gedi core containing three brec-cia layers with the respective dates of earthquakes. The 1202 A.D. event is barely determined because the 1212 event almost obliterated the 10-yr-old breccia. Nonetheless, a few laminae (arrow) can be resolved above event horizon 1202 A.D. Migowski et al. (2004) have inferred five unresolved events by correlation of the lamina-counting record of breccia layers with the historical record of destructive earthquakes.
click on image to open in a new tab
Agnon et al. (2006)
 Figure 3
Two typical examples of disturbed sediment sequences in the Ein Gedi profile: The sequence between 0.65 and 0.78 m core depth is correlated with the earthquake of A.D. 1458, whereas the earlier event of the year A.D. 1408 is masked in the sequence (left). The sequence between 1.35 and 1.42 m depth is identified as being created during the earthquake of A.D. 1033 (right).
click on image to open in a new tab
Migowski et al. (2004)
- from Agnon et al. (2006)
 Figure 9
Photos of breccia layer from the Ein Gedi drill core that match the historical earthquake of 1458 A.D. (Migowski et al., 2004).
click on image to open in a new tab
Agnon et al. (2006)
 Table 1
AMS Radiocarbon dates from the Ein Gedi site
click on image to open in a new tab
Migowski et al. (2004)
 Appendix A
Table with AMS 14C dates of organic relics from the sites Ein Gedi (DS-En), Ein Feshkha (DS-F), and Ze'elim (DS-Z)
click on image to open in a new tab
Migowski et al. (2006)
- from Agnon et al. (2006)
 Figure 10
Magnitude-distance field showing all regional and local earthquakes that could affect the Dead Sea. Each marker on the diagram corresponds to a historical or instrumental earthquake recorded in the region. The bold line and the bold curve separate three domains: the lower-right with close and strong earthquakes, all of which represented in the intraclast breccia record; the upper-left with far and weak sources, none of which are represented in the record; and a median domain in which only some earthquakes are recorded by intraclast breccias. The dashed lines correspond to isoseismals. The gray bar represents the threshold magnitude (M = 5.5) for the formation of breccia layers inferred from the diagram. The pattern lends support to the interpretation of the breccia layers as earthquake indicators.
click on image to open in a new tab
Agnon et al. (2006)
- from Agnon et al. (2006)
 Table 1
Historical Earthquakes, Ein Gedi Core and Ze'elim Section
click on image to open in a new tab
Agnon et al. (2006)
- from Agnon et al. (2006)
 Figure 13
Cumulative seismicity along three plate boundaries. Top: Recurrence intervals as a function of time for three plate boundaries. DSB is the record from the Dead Sea Basin. The values are estimated based on the bottom panel. Center (A): The plate configuration with the North Anatolian fault (NAF) bounding the Anatolia plate from north and north east, where it meets the East Anatolian fault (EAF). The latter is fed from the south by the Dead Sea transform (DST) fault. Bottom: Cumulative number of earthquakes in the historical records of Anatolian faults according to Ambraseys (1971) (right hand coordinate) and the record of breccias from the DSB (left hand coordinate, expanded)
click on image to open in a new tab
Agnon et al. (2006)
 Figure 2
Reconstruction of the lake level curve from palaeoshorelines and lithological variations recorded in the cores. (a) A schematic representation of the constructed curve based on detailed lithological changes (see text for discussion). Each arrow represents lake level information derived from sediment sequences in the cores for different sites (b, Ein Gedi; c, Ze'elim; d, Ein Feshkha). This information was used to reconstruct a relative lake level curve for the Dead Sea which was subsequently quantified based on the calculations of Bookman (Ken-Tor) et al. (2004) (gray curve in panel e). The high-stand shorelines (marked # 1, 7 and 9 in panel e) were dated by radiocarbon (based on information from Kadan, 1997; Bartov, 2004 and Stein, unpublished data, respectively).
click on image to open in a new tab
Migowski et al. (2006)
 Figure 3
Summarising reconstruction of Dead Sea level curve including all lithological information. Bars near the X-axis show 1 sigma range of the radiocarbon dates on organic matter for all three cores.
click on image to open in a new tab
Migowski et al. (2006)
 Figure 4
A comparison of the climate variability and cultural development in the Dead Sea region. The establishment of favourable climate conditions appears to parallel the expansion of villages into cities and the spread of farming communities into the Negev Desert. Deteriorating climate conditions are generally characterised by fewer settlements confined to the vicinity of water resources along the Jordan valley.
click on image to open in a new tab
Migowski et al. (2006)
[76] Historical documentation is mostly reliable in the last two millennia. Some archeological and paleoseismic evi- dence for the events is given in the footnotes. A location map of many of the sites mentioned in Table A1 is given in Appendix B.
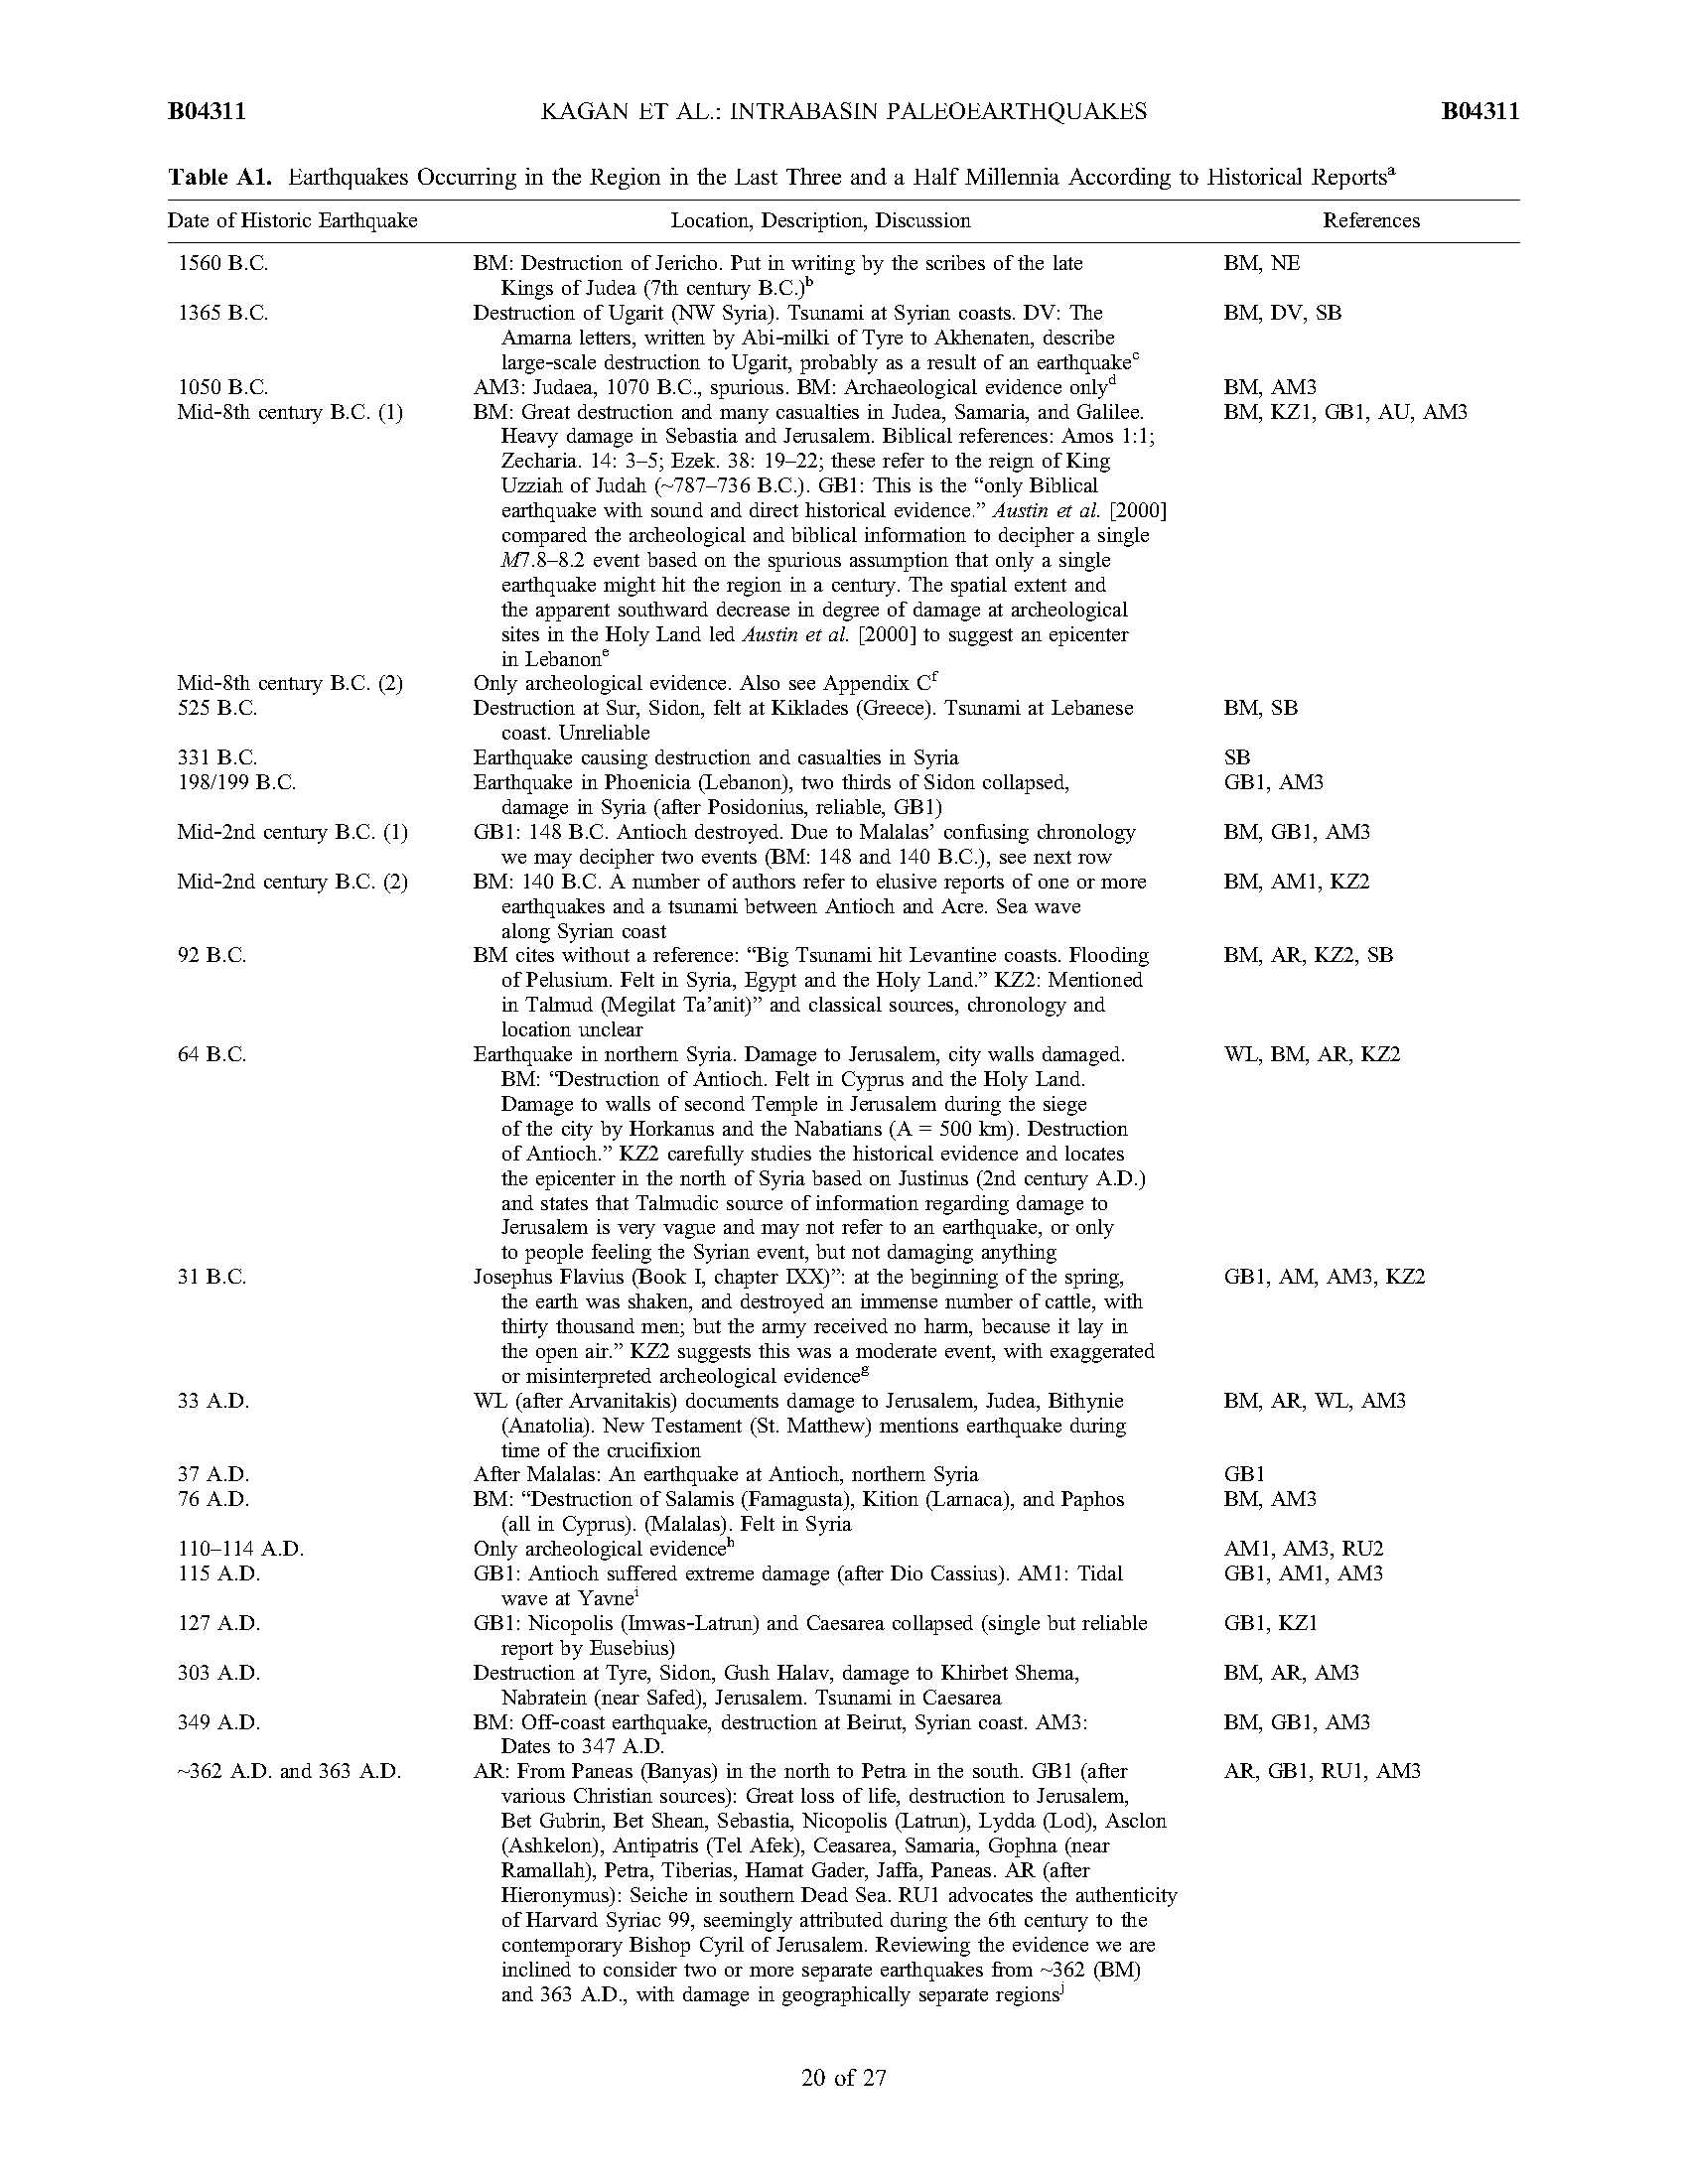
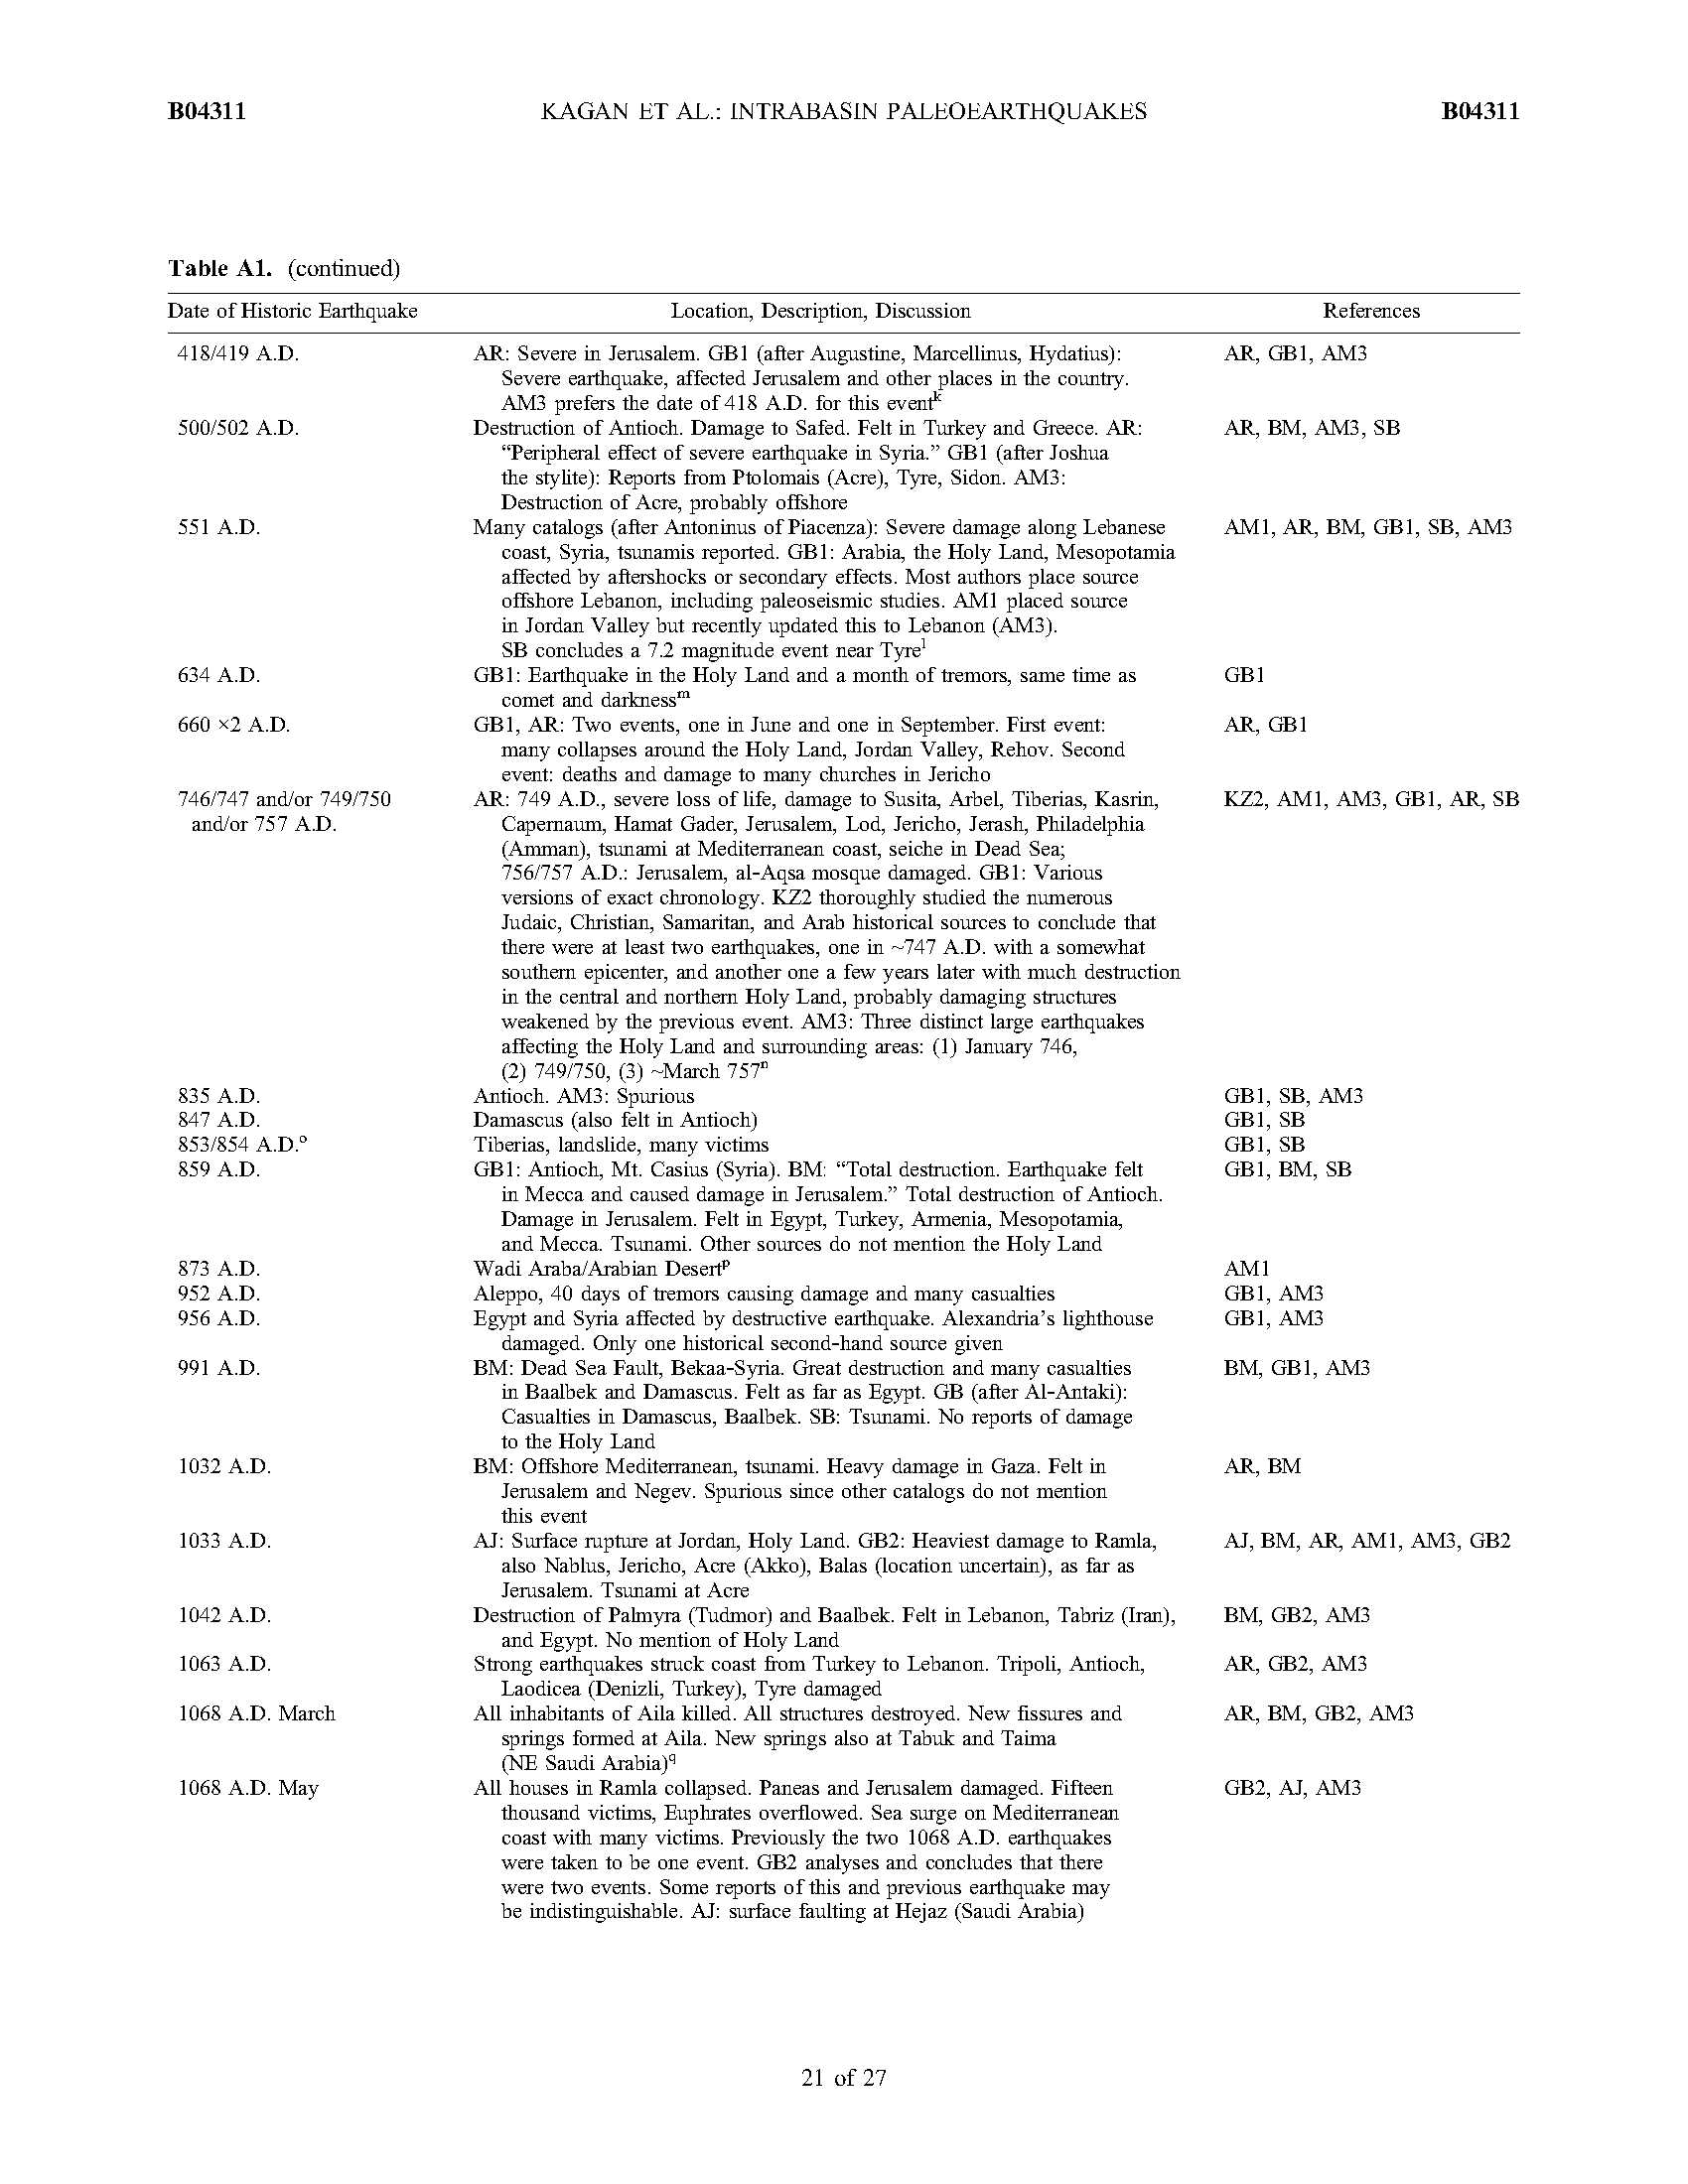
[77] Figure B1 provides a map of historical locations mentioned in the manuscript and in Appendix A, based on Google Earth (http://www.google.com/earth/index.html), Guidoboni and Comastri [2005], Guidoboni et al. [1994], and Ambraseys [2009].
Key to map numbers; modern location names are given in parentheses:
- Aila (Aqaba)
- Aleppo (Halab)
- Amman (Philadelphia)
- Antioch
- Antipatris (Tel Afek)
- Asclon (Ashkelon)
- Baalbek
- Beirut
- Bet Shean
- Bethlehem
- Caesarea
- Cairo
- Capernaum
- Damascus
- Damietta
- Dead Sea
- Gaza
- Gush Halav–Jish
- Haifa
- Hamat Gader
- Hebron
- Jaffa
- Jerash
- Jericho
- Jerusalem
- Karak
- Kasrin (Qatzrin)
- Khirbet Shema
- Kition (Larnaca)
- Lydda (Lod) (Ramla is adjacent to Lydda)
- Nablus
- Nazareth
- Nicopolis (Imwas‐Latrun)
- Palmyra (Tudmor)
- Paneas (Banyias)
- Paphos
- Pelusium
- Petra
- Ptolemais (Acre‐Akka‐Akko)
- Qaqun (Netanya)
- Safed
- Samaria
- Scandelion (Iskandarouna)
- Sea of Galilee
- Sidon
- St. Catherine monastery (Sinai)
- Tiberias
- Tripoli
- Tyre (Sur)
- Ugarit
- Yavne
click on image to open in a new tab
Kagan et al. (2011)
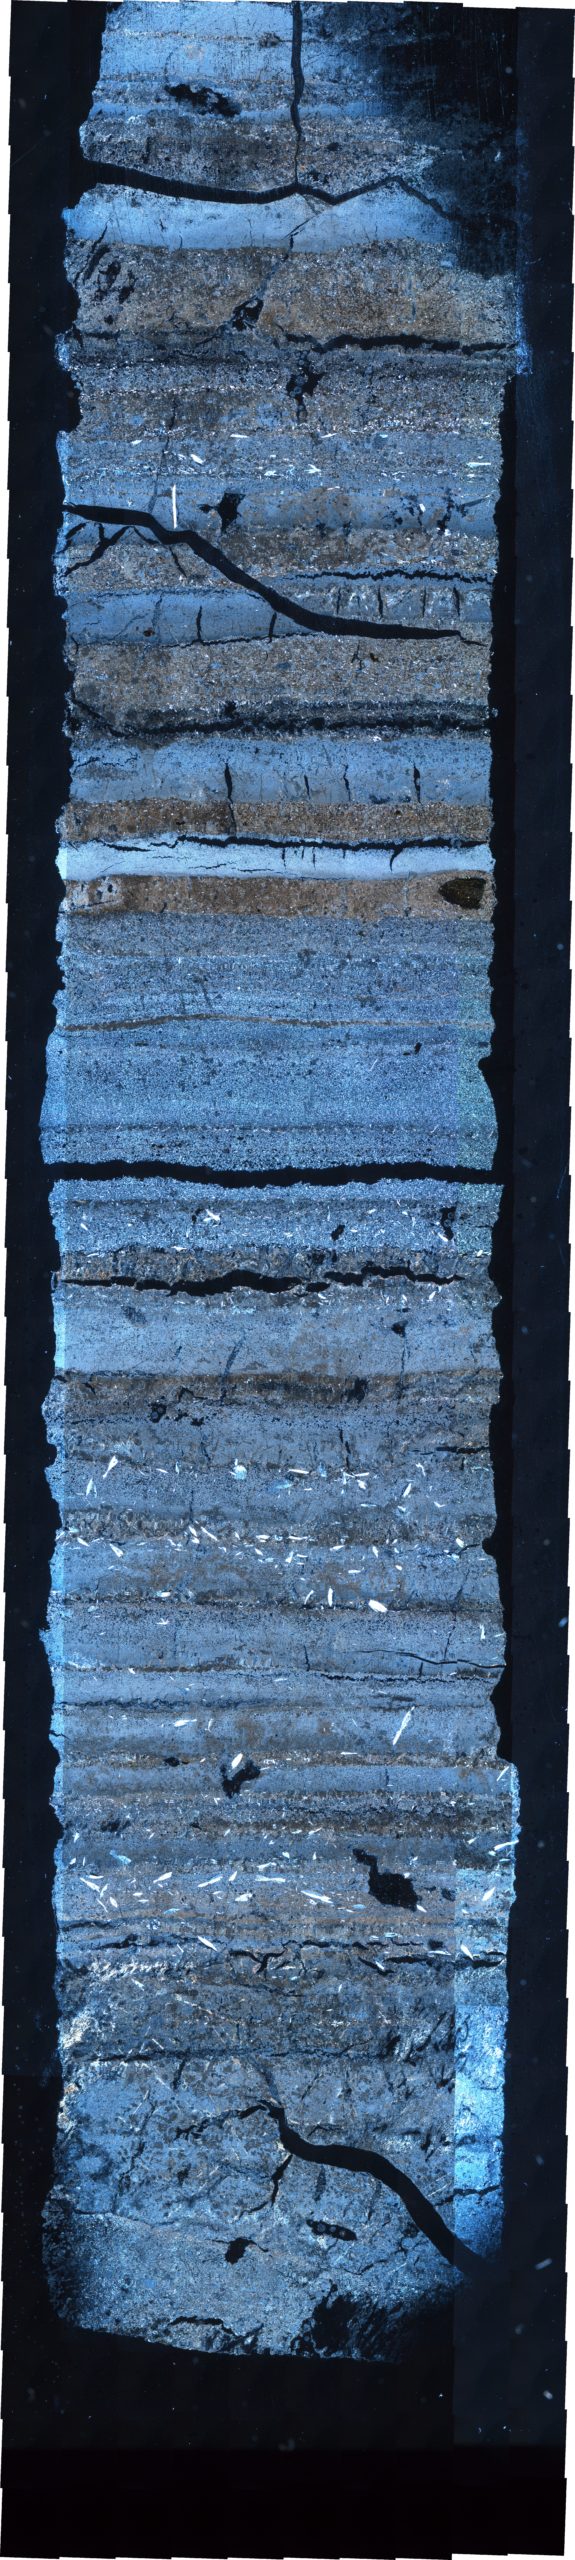
 En Gedi Core -Section A3
GFZ/GSI
a year by year chronology from 140 BCE to 1458 CE
Figure 4The age-depth model of the Ein Gedi profile is derived from radiocarbon dating (black bars indicate 26 ranges) and varve-counting between 0.78 and 3.03 m. The floating annual chronology is anchored by a systematic comparison and correlation of deformed sediment sequences (grey bars) to a succession of historical strong earthquakes.
Migowski et al. (2004)
Fig. 7.5(translated by Google & Williams)
The age-depth model of the Ein Gedi profile is made possible by a shift of up to 350 years.
x-axis - Age [yrs cal BP]
y-axis - Sediment Depth [m]
Migowski (2001)
Neugebauer (2015) and Neugebauer at al. (2015) recounted laminae from 2.1 - 4.35 meters in the En Gedi Core (DsEn) while also making a stratigraphic correlation to ICDP Core 5017-1. Nine 14C dates were used from 1.58 - 6.12 m but samples KIA9123 (inside the Late Bronze Beach Ridge) and KIA1160 (the 1st sample below the Late Bronze Beach Ridge) were discarded as outliers. These two samples gave dates approximately 400 years older than what was expected for the Late Bronze Age Beach Ridge
 Late Bronze Age Beach Ridge at Nahal Ze 'elim outlined in black
 Click on image to open a high resolution magnifiable image in a new tab
Photo by Jefferson Williams (2015)
(a) Comparison of the Dead Sea data to other records
- difference in the total solar irradiance ΔTSI from the year 1986, 1365.57 W/m2 (Steinhilber et al., 2009)
- clay layer frequency record from the Black Sea (solid line - core GeoB7622, dashed line - core GeoB7625, thick line - 3-point moving average) - Lamy et al., 2006
- Dead Sea lake-level reconstruction based on core DSEn (dark blue line - Migowski et al. (2006), light blue line - this study
- Dead Sea K/Si ratio from µ-XRF element scanning (this study)
- Dead Sea coarse and mixed detrital layer thickness (this study)
- Soreq Cave δ18O speleothem record (Bar-Matthews et al., 2003) showing only very minor changes over the entire period investigated here
- Red Sea terrigeneous sand accumulation rate (core GeoB5804-1, thick line - 5-point moving average) - Lamy et al., 2006
- Red Sea stable oxygen isotope difference Δδ18O between planktic and epibenthic foraminifera (core GeoB5804-1, thick line - 5-point moving average) - Lamy et al., 2006
AO/NAO: Arctic Oscillation/North Atlantic Oscillation
4. and 5. from core DSEn and on radiocarbon-based age scale
(b) Inferred humidity changes in the eastern Mediterranean during the two dry periods at the Dead Sea, discussed here.
Click on image to open in a new tab
Neugebauer at al. (2015)
In the En Gedi core (DSEn), the Late Bronze Age Beach Ridge (Unit II of Neugebauer et al, 2015) is found from depths 4.35 to 4.55 m. It's top coincides with the bottom of the recounted interval - far away from the overlap (2.1 - 3.02 m) with Migowski's counted interval. Thus, if there were any problems with the recounted dates (e.g. hiatuses or accumulating systemic errors) as one moved to the top of the recounted interval, they would go unnoticed. Varve counts in the overlapped interval were fairly similar - 583 according to Migowski (2001) vs. 518 according to Neugebauer et al. (2015). There wasn't a major discrepancy in terms of varve count interpretation. But, the lack of a calibration point near the top of the recounted interval leaves one wondering if the recounted dates in the overlap are accurate and why Migowski's pre-shifted chronology doesn't correlate well with the reliable parts of the earthquake record.
Neugebauer at al. (2015:5) counted 1351 varves with an uncertainty of 7.5% (Neugebauer at al, 2015:8). That leads to an uncertainty of ~100 varves by the time one gets to the top of the recounted interval away from the Late Bronze Age Beach Ridge calibration point. The Beach Ridge itself likely has an uncertainty of +/- 75 years. Add the two together and the uncertainty approaches Migowski's shift. In addition, roughly 15% of the recounted interval went through intraclast breccias (seismites) where the varves were uncountable and the varve count was interpolated with a questionable multiplication factor of 1.61 applied to the interpolated varve count (Neugebauer at al, 2015:5). Migowski et al. (2004) also interpolated through the intraclast breccias however in her case she used the interpolation to line up with events out of the Earthquake catalogs.
Unfortunately, Neugebauer at al. (2015)'s study did not resolve the uncertainties associated with Migowski's varve counts. Both studies lack a sufficiently robust calibration over the entire depth interval. Dead Sea laminae are difficult to count. They are not nearly as "well-behaved" as they are in the older Lisan formation or in Glacial varves. This was illustrated by Lopez-Merino et al. (2016). Their study, which used seasonal palynology to ground truth varve counts, showed that between 1 and 5 laminae couplets (ie varves) could be deposited in a year

Section ZAII B4L - sampled about 1 meter below 31 BCE Josephus Quake seismite
Each bar represents one lamina. Lamina showing a preponderance of Autumnal pollen plots to the right; spring pollen to the left.
Asterisks (*) highlight the laminae in which it is possible that more than one detrital-aragonite couplet have been deposited in a year
Question marks (?) are anomalous results that may have suffered from contamination
paraphrasing and abridgment of original Figure description by JW
Lopez-Merino et al. (2016)
In 2018 and 2023, Jefferson Williams collected ~90 samples of dateable material from an erosional gully
 Erosional Gully at En Gedi
photo by Jefferson Williams
 Location where En Gedi Core (DSEn) was taken in 1997 by GFZ/GSI
photo by Jefferson Williams
 Photo of coring operations in En Gedi in 1997
GFZ
En Gedi Core -Section A3GFZ/GSI
a year by year chronology from 140 BCE to 1458 CE
Figure 4The age-depth model of the Ein Gedi profile is derived from radiocarbon dating (black bars indicate 26 ranges) and varve-counting between 0.78 and 3.03 m. The floating annual chronology is anchored by a systematic comparison and correlation of deformed sediment sequences (grey bars) to a succession of historical strong earthquakes.
Migowski et al. (2004)
Fig. 7.5(translated by Google & Williams)
The age-depth model of the Ein Gedi profile is made possible by a shift of up to 350 years.
x-axis - Age [yrs cal BP]
y-axis - Sediment Depth [m]
Migowski (2001)
Neugebauer (2015) and Neugebauer at al. (2015) recounted laminae from 2.1 - 4.35 meters in the En Gedi Core (DsEn) while also making a stratigraphic correlation to ICDP Core 5017-1. Nine 14C dates were used from 1.58 - 6.12 m but samples KIA9123 (inside the Late Bronze Beach Ridge) and KIA1160 (the 1st sample below the Late Bronze Beach Ridge) were discarded as outliers. These two samples gave dates approximately 400 years older than what was expected for the Late Bronze Age Beach Ridge
Late Bronze Age Beach Ridge at Nahal Ze 'elim outlined in black Click on image to open a high resolution magnifiable image in a new tab
Photo by Jefferson Williams (2015)
(a) Comparison of the Dead Sea data to other records
- difference in the total solar irradiance ΔTSI from the year 1986, 1365.57 W/m2 (Steinhilber et al., 2009)
- clay layer frequency record from the Black Sea (solid line - core GeoB7622, dashed line - core GeoB7625, thick line - 3-point moving average) - Lamy et al., 2006
- Dead Sea lake-level reconstruction based on core DSEn (dark blue line - Migowski et al. (2006), light blue line - this study
- Dead Sea K/Si ratio from µ-XRF element scanning (this study)
- Dead Sea coarse and mixed detrital layer thickness (this study)
- Soreq Cave δ18O speleothem record (Bar-Matthews et al., 2003) showing only very minor changes over the entire period investigated here
- Red Sea terrigeneous sand accumulation rate (core GeoB5804-1, thick line - 5-point moving average) - Lamy et al., 2006
- Red Sea stable oxygen isotope difference Δδ18O between planktic and epibenthic foraminifera (core GeoB5804-1, thick line - 5-point moving average) - Lamy et al., 2006
AO/NAO: Arctic Oscillation/North Atlantic Oscillation
4. and 5. from core DSEn and on radiocarbon-based age scale
(b) Inferred humidity changes in the eastern Mediterranean during the two dry periods at the Dead Sea, discussed here.
Click on image to open in a new tab
Neugebauer at al. (2015)
In the En Gedi core (DSEn), the Late Bronze Age Beach Ridge (Unit II of Neugebauer et al, 2015) is found from depths 4.35 to 4.55 m. It's top coincides with the bottom of the recounted interval - far away from the overlap (2.1 - 3.02 m) with Migowski's counted interval. Thus, if there were any problems with the recounted dates (e.g. hiatuses or accumulating systemic errors) as one moved to the top of the recounted interval, they would go unnoticed. Varve counts in the overlapped interval were fairly similar - 583 according to Migowski (2001) vs. 518 according to Neugebauer et al. (2015). There wasn't a major discrepancy in terms of varve count interpretation. But, the lack of a calibration point near the top of the recounted interval leaves one wondering if the recounted dates in the overlap are accurate and why Migowski's pre-shifted chronology doesn't correlate well with the reliable parts of the earthquake record.
Neugebauer at al. (2015:5) counted 1351 varves with an uncertainty of 7.5% (Neugebauer at al, 2015:8). That leads to an uncertainty of ~100 varves by the time one gets to the top of the recounted interval away from the Late Bronze Age Beach Ridge calibration point. The Beach Ridge itself likely has an uncertainty of +/- 75 years. Add the two together and the uncertainty approaches Migowski's shift. In addition, roughly 15% of the recounted interval went through intraclast breccias (seismites) where the varves were uncountable and the varve count was interpolated with a questionable multiplication factor of 1.61 applied to the interpolated varve count (Neugebauer at al, 2015:5). Migowski et al. (2004) also interpolated through the intraclast breccias however in her case she used the interpolation to line up with events out of the Earthquake catalogs.
Unfortunately, Neugebauer at al. (2015)'s study did not resolve the uncertainties associated with Migowski's varve counts. Both studies lack a sufficiently robust calibration over the entire depth interval. Dead Sea laminae are difficult to count. They are not nearly as "well-behaved" as they are in the older Lisan formation or in Glacial varves. This was illustrated by Lopez-Merino et al. (2016). Their study, which used seasonal palynology to ground truth varve counts, showed that between 1 and 5 laminae couplets (ie varves) could be deposited in a year
Section ZAII B4L - sampled about 1 meter below 31 BCE Josephus Quake seismite
Each bar represents one lamina. Lamina showing a preponderance of Autumnal pollen plots to the right; spring pollen to the left.
Asterisks (*) highlight the laminae in which it is possible that more than one detrital-aragonite couplet have been deposited in a year
Question marks (?) are anomalous results that may have suffered from contamination
paraphrasing and abridgment of original Figure description by JW
Lopez-Merino et al. (2016)
In 2018 and 2023, Jefferson Williams collected ~90 samples of dateable material from an erosional gully
Erosional Gully at En Gediphoto by Jefferson Williams
Location where En Gedi Core (DSEn) was taken in 1997 by GFZ/GSIphoto by Jefferson Williams
Photo of coring operations in En Gedi in 1997GFZ