Tiberias - Beriniki Theatre
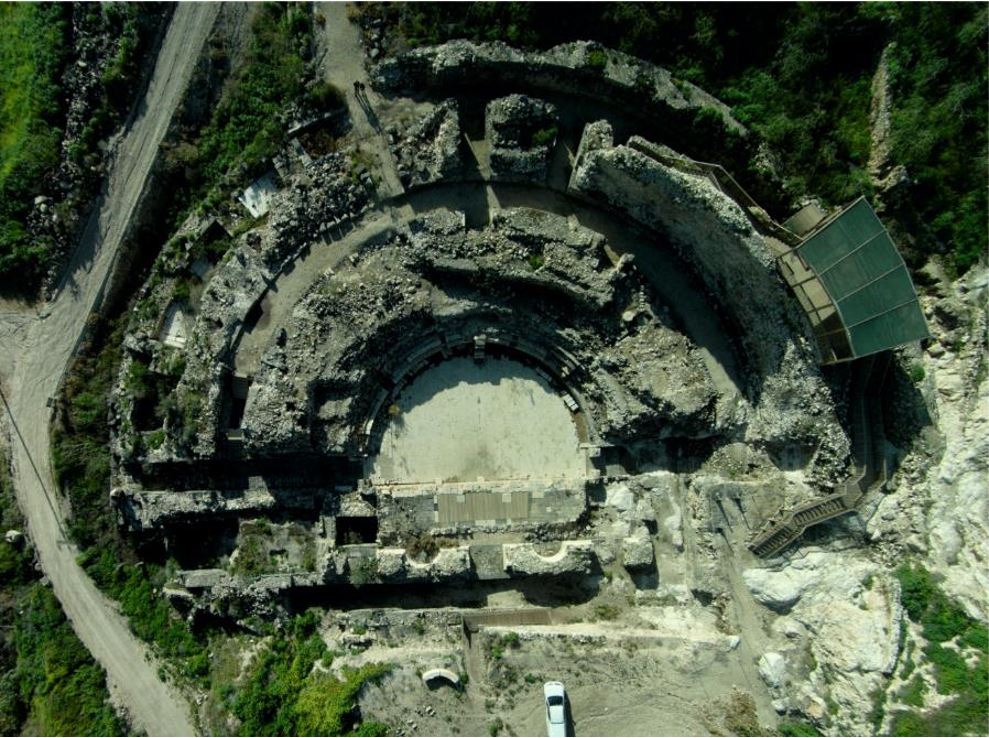 Figure S10
Clean version of the drone picture [of Berniki Theater] presented in Figure 4a.
Ferrario et al (2020)
- Fig. 1 Map of Tiberias
during the Roman period from Atrash (2010)
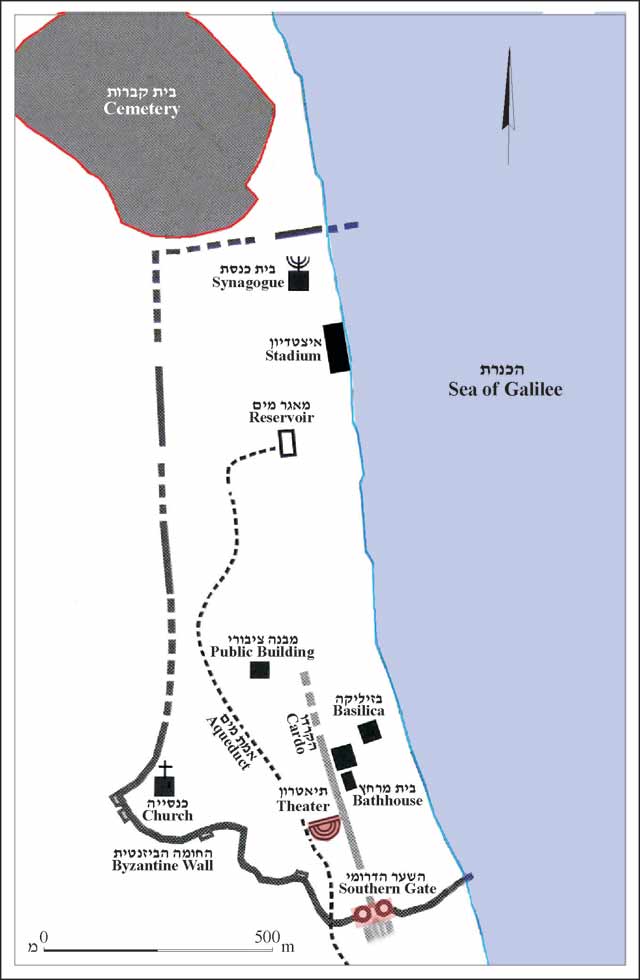 Figure 1.
The city during the Roman period, plan (based on Hirschfeld 1992)
Galei Kinneret is next to the Stadium
Atrash (2010)
- Tiberias Berniki Theater in Google Earth
 Tiberias Berniki Theater
click on image to explore this site on a new tab in Google Earth - Tiberias Berniki Theater on govmap.gov.il
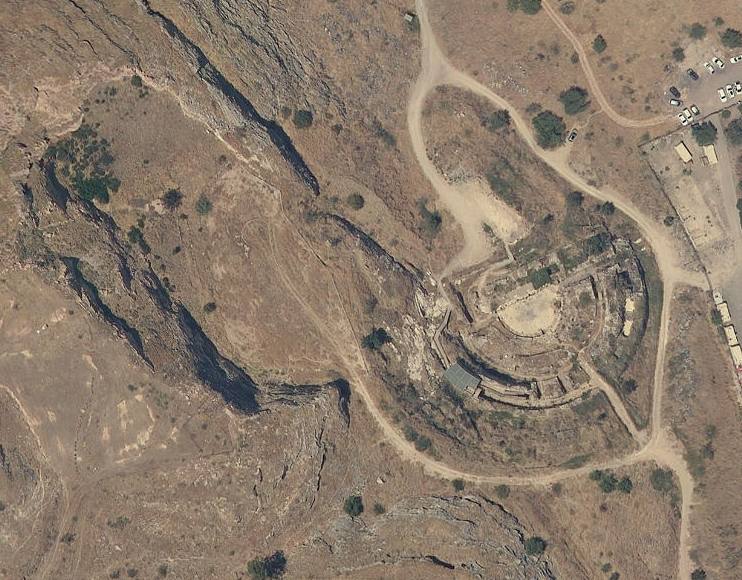 Tiberias Berniki Theater
click on image to explore this site on a new tab in govmap.gov.il
- Fig. 4 Map of ancient Tiberias
with inferred fault from Ferrario et al (2020)
 Figure 4
Map of ancient Tiberias (modified after Hirschfeld & Gutfeld, 2008) with indication of the inferred lineament and trench position.
Ferrario et al (2020) - Fig. 1b Quaternary faults
around the Sea of Galilee and the Jordan Valley from Ferrario et al (2020)
 Figure 1b
Quaternary faults in the central part of the DSF, modified after Sneh and Weinberger (2014), Sagy et al. (2016), Hamiel et al. (2016), and Sharon et al. (2018, 2020); the red rectangle is the area enlarged in Fig. 1c
- JVWB: Jordan Valley Western Boundary Fault
- JVF: Jordan Valley Fault
- G: Gilboa Fault
Ferrario et al (2020) - Fig. 1c Simplified geologic map
around the Sea of Galilee along with epicenters of MW > 4.0 events since 1970 from Ferrario et al (2020)
 Figure 1c
Simplified geologic map (after Bogoch & Sneh, 2008; Sneh, 2008), epicenters of MW > 4.0 events since 1970 (data from http://seis.gii.co.il/en/earthquake/searchEQSRslt.php).
Ferrario et al (2020) - Fig. 10 Sketches of the shallow
subsurface from Ferrario et al (2020)
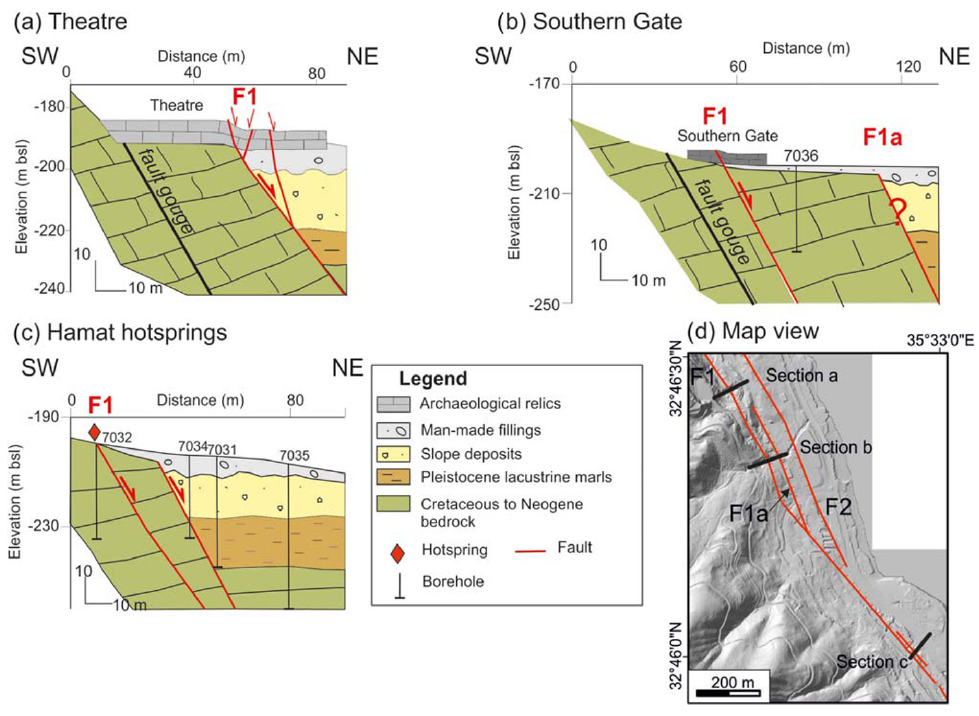 Figure 10
Schematic sketches of the shallow subsurface at three key positions
- Theater
- Southern Gate
- Hamat hot springs
- section traces
Information on geology is derived from the Israeli geological map (Sneh, 2008), published scientific literature (e.g., Hurwitz et al., 2002), and local reports (e.g., Zaslavsky, 2009). Borehole logs are from GSI archive
Ferrario et al (2020) - Fig. 2b Morphotectonic map
from Ferrario et al (2020)
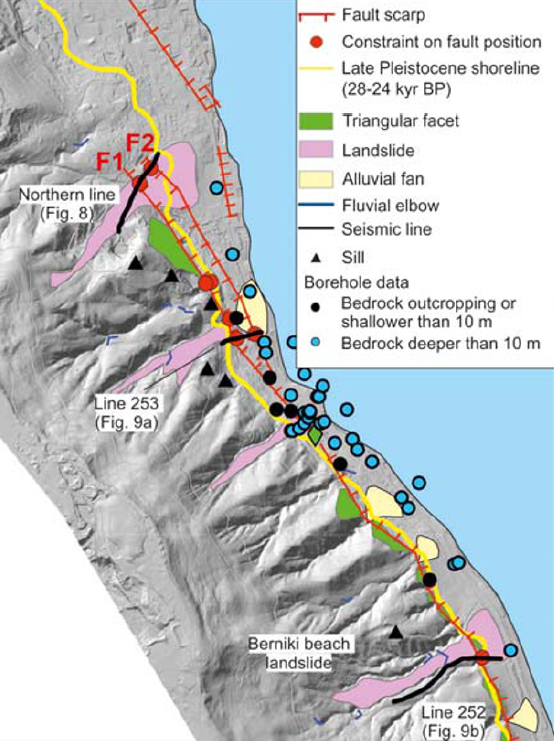 Figure 2b
morphotectonic map of the study area, based on 0.5 m resolution DTM extracted from airborne Lidar survey. The map shows also the late Pleistocene shoreline, the position of boreholes analyzed in this study, and the points where we constrained the spatial position of the fault trace.
Ferrario et al (2020) - Fig. 9 Interpreted Seismic
lines from Ferrario et al (2020)
 Figure 9
Seismic lines and relative interpretation
- Southern Gate, location of the trench is also shown
- Berniki Beach landslide
- Traces of the seismic lines
Ferrario et al (2020) - Fig. 8 Interpreted Seismic line
run north of Tiberias Theater from Ferrario et al (2020)
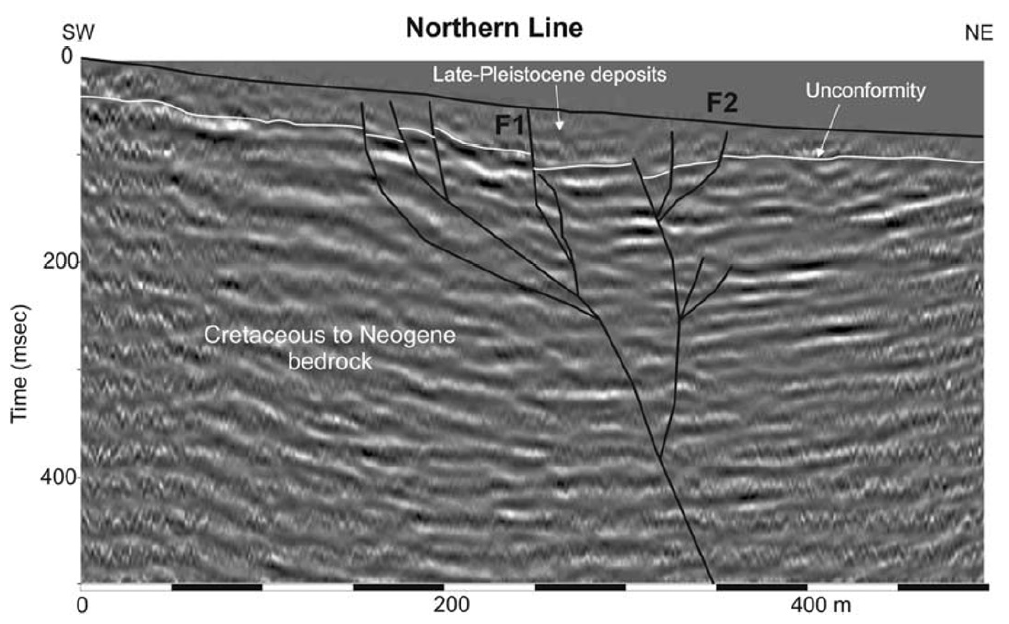 Figure 8
Seismic line run north of Tiberias Theater and relative interpretation; trace in Figure 9.
Ferrario et al (2020) - Fig. 2a Site Map
from Ferrario et al (2020)
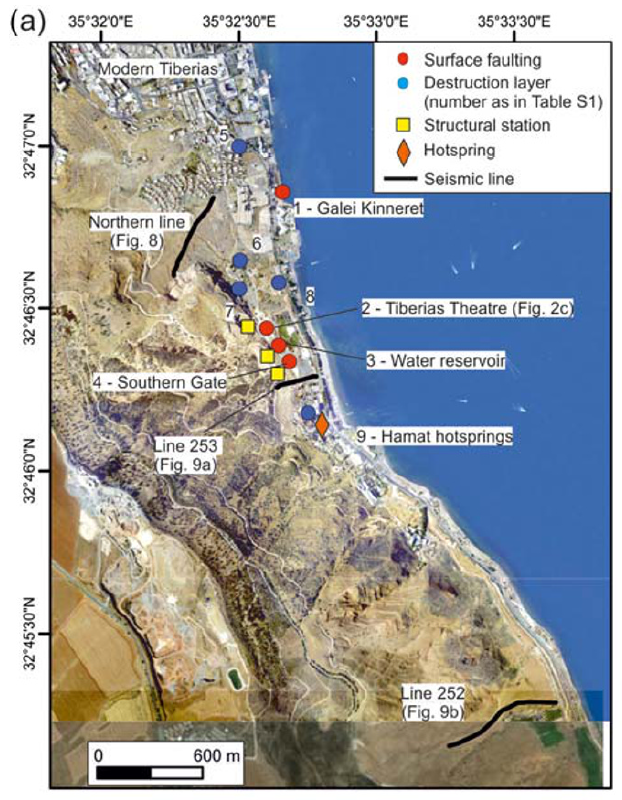 Figure 2a
Relevant sites mentioned in the text and location of the seismic lines; numbers correspond to Table S1 in the supporting information where relevant references are provided
Ferrario et al (2020)
- Fig. 1b Quaternary faults
around the Sea of Galilee and the Jordan Valley from Ferrario et al (2020)
Figure 1b
Quaternary faults in the central part of the DSF, modified after Sneh and Weinberger (2014), Sagy et al. (2016), Hamiel et al. (2016), and Sharon et al. (2018, 2020); the red rectangle is the area enlarged in Fig. 1c
- JVWB: Jordan Valley Western Boundary Fault
- JVF: Jordan Valley Fault
- G: Gilboa Fault
Ferrario et al (2020) - Fig. 2b Morphotectonic map
from Ferrario et al (2020)
Figure 2b
morphotectonic map of the study area, based on 0.5 m resolution DTM extracted from airborne Lidar survey. The map shows also the late Pleistocene shoreline, the position of boreholes analyzed in this study, and the points where we constrained the spatial position of the fault trace.
Ferrario et al (2020) - Fig. 9 Interpreted Seismic
lines from Ferrario et al (2020)
Figure 9
Seismic lines and relative interpretation
- Southern Gate, location of the trench is also shown
- Berniki Beach landslide
- Traces of the seismic lines
Ferrario et al (2020) - Fig. 8 Interpreted Seismic line
run north of Tiberias Theater from Ferrario et al (2020)
Figure 8
Seismic line run north of Tiberias Theater and relative interpretation; trace in Figure 9.
Ferrario et al (2020) - Fig. 2a Site Map
from Ferrario et al (2020)
Figure 2a
Relevant sites mentioned in the text and location of the seismic lines; numbers correspond to Table S1 in the supporting information where relevant references are provided
Ferrario et al (2020)
- Fig. 4 Map of surface ruptures
in the Beriniki Theatre from Ferrario et al (2020)
 Figure 4.
Surface faulting at the Tiberias Theatre:
a) map of ruptures across the Theatre, rose diagrams (bin size 15°) show fractures on archaeological relics from the whole site (red, n° 100) and on the orchestra floor (grey, n° 23); picture view angles (the figure number showing each picture is indicated) and trace of total station profiles are shown as well
b-c) details of the gravity graben displacing seat rows and walls
d) right dihedral best fit solution of fault slip inversion (15 fault planes in the limestone bedrock; Table S3)
e) detail of the limestone normal fault gouge (site is shown in a)
Ferrario et al (2020) - Sketch of Tiberias with
the Berniki Theater highlighted in yellow from BibleWalks.com
 Sketch of Tiberias. The Berniki Theater is highlighted in yellow
Used with permission from BibleWalks.com - Fig. 3 Theater plan from
Atrash (2010)
 Figure 3
Theater plan
Atrash (2010)
- Fig. 4 Map of surface ruptures
in the Beriniki Theatre from Ferrario et al (2020)
Figure 4.
Surface faulting at the Tiberias Theatre:
a) map of ruptures across the Theatre, rose diagrams (bin size 15°) show fractures on archaeological relics from the whole site (red, n° 100) and on the orchestra floor (grey, n° 23); picture view angles (the figure number showing each picture is indicated) and trace of total station profiles are shown as well
b-c) details of the gravity graben displacing seat rows and walls
d) right dihedral best fit solution of fault slip inversion (15 fault planes in the limestone bedrock; Table S3)
e) detail of the limestone normal fault gouge (site is shown in a)
Ferrario et al (2020) - Fig. 3 Theater plan from
Atrash (2010)
Figure 3
Theater plan
Atrash (2010)
- Fig. D Reconstruction of the
Roman theater from Cytryn-Silverman (2015) and Atrash (2012)
 Figure D
Roman theater, reconstruction.
Image courtesy of Walid Atrash, Israel Antiquities Authority.
Caption from Cytryn-Silverman (2015) and image from Atrash (2012)
- Fig. 6 Berniki Theater from
Atrash (2012)
 Figure 6
Berniki Theater, view towards the south
Atrash (2012) - Fig. 6 Berniki Theater with
pink highlighting where downdropped graben has created a fractured zone Atrash (2012)
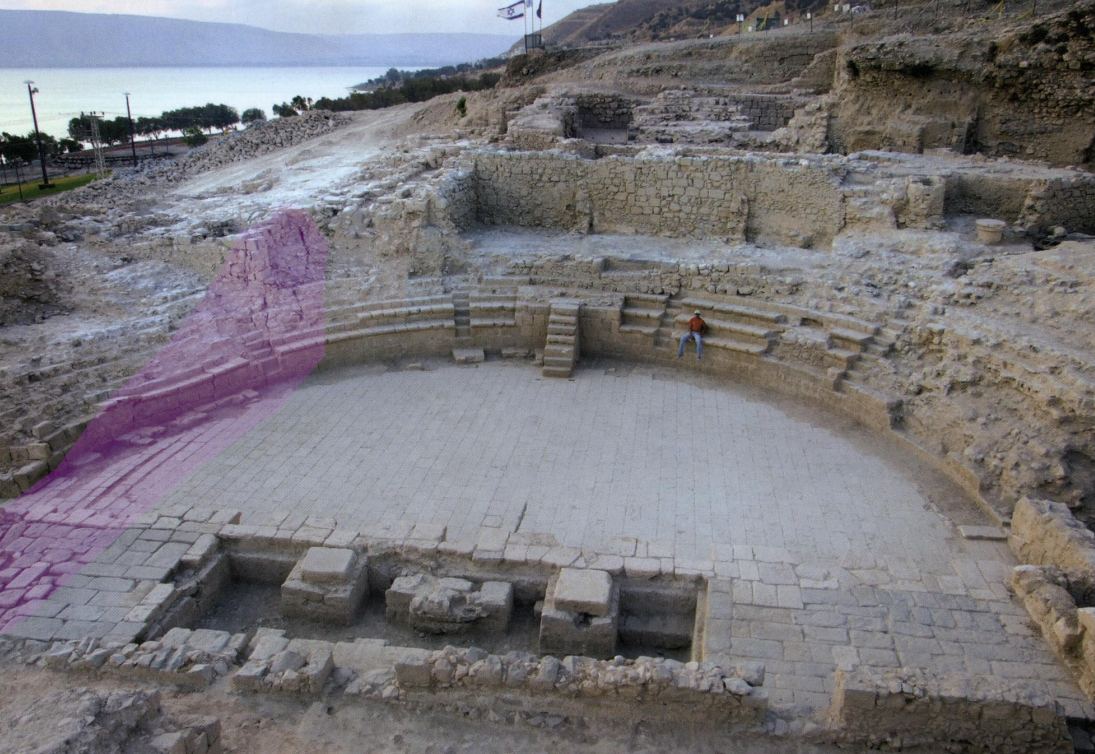 Figure 6
Berniki Theater (view towards the south) with pink highlighting where downdropped graben has created a fractured zone
Atrash (2012) - Fig. 8 Berniki Theater from
Atrash (2012)
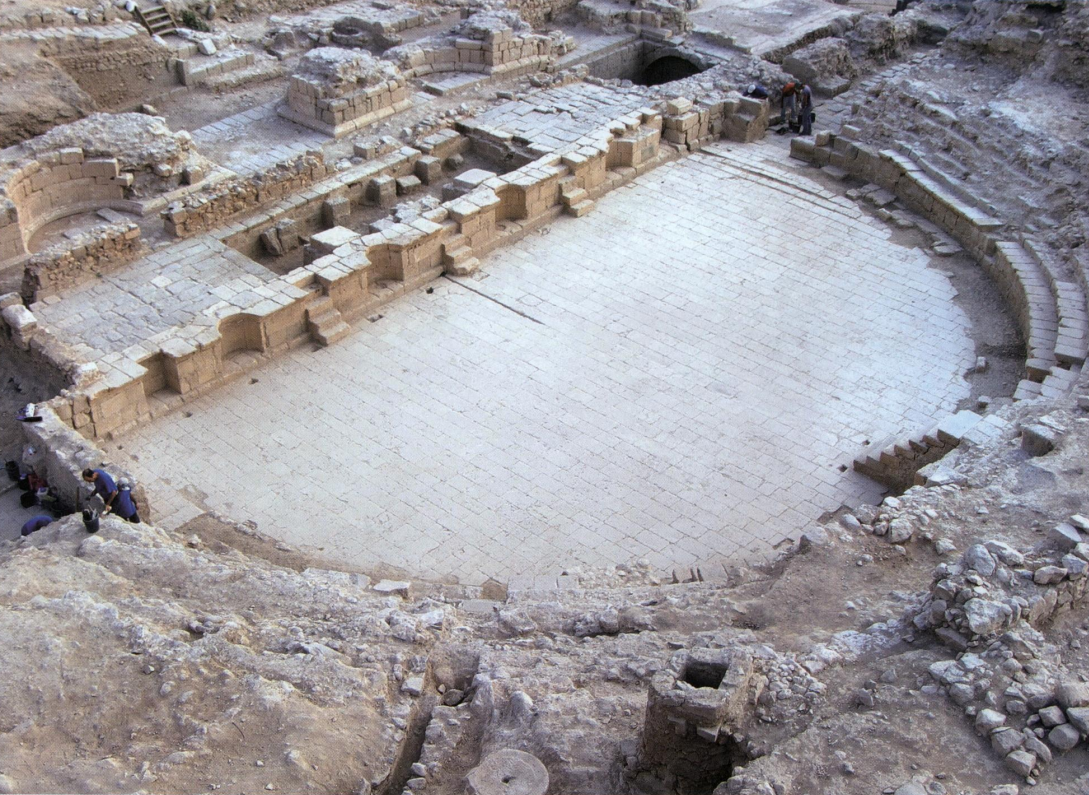 Figure 8
Berniki Theater, view towards the WSW
Atrash (2012) - Fig. 8 Berniki Theater with
pink highlighting where downdropped graben has created a fractured zone Atrash (2012)
 Figure 8
Berniki Theater (view towards the WSW) with pink highlighting where downdropped graben has created a fractured zone
Atrash (2012)
- from Ferrario et al (2020) citing Atrash (2010)
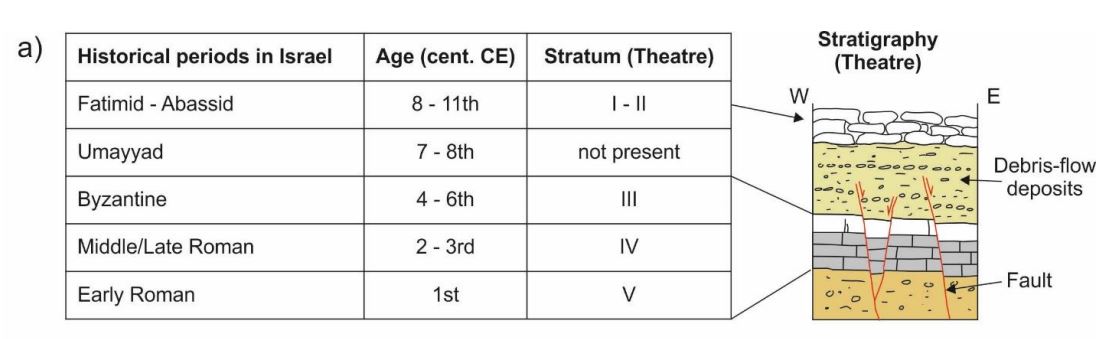 Figure 3a) Historical periods in Israel and schematic stratigraphic column at the
Theatre
Figure 3a) Historical periods in Israel and schematic stratigraphic column at the
TheatreFerrario et al (2020)
- Fig. 4 Map containing Tiberias
sites studied by Ferrario et al (2020)
Figure 4: Map of ancient Tiberias (modified after Hirschfeld & Gutfeld, 2008) with indication of the inferred lineament and trench position.
Ferrario et al (2015) - Fig. 4 Map of surface ruptures
in the Beriniki Theatre from Ferrario et al (2020)
Figure 4.
Surface faulting at the Tiberias Theatre:
a) map of ruptures across the Theatre, rose diagrams (bin size 15°) show fractures on archaeological relics from the whole site (red, n° 100) and on the orchestra floor (grey, n° 23); picture view angles (the figure number showing each picture is indicated) and trace of total station profiles are shown as well
b-c) details of the gravity graben displacing seat rows and walls
d) right dihedral best fit solution of fault slip inversion (15 fault planes in the limestone bedrock; Table S3)
e) detail of the limestone normal fault gouge (site is shown in a)
Ferrario et al (2020) - Sketch of Tiberias with
the Berniki Theater highlighted in yellow from BibleWalks.com
Sketch of Tiberias. The Berniki Theater is highlighted in yellow
Used with permission from BibleWalks.com - Fig. 3 Theater plan from
Atrash (2010)
Figure 3
Theater plan
Atrash (2010) - Fig. D Reconstruction of the
Roman theater from Cytryn-Silverman (2015)
 Figure D
Roman theater, reconstruction.
Image courtesy of Walid Atrash, Israel Antiquities Authority.
Cytryn-Silverman (2015) - Fig. 5 Fatimid-Abbasid quarter
which was on top of the Roman theater from Atrash (2010)
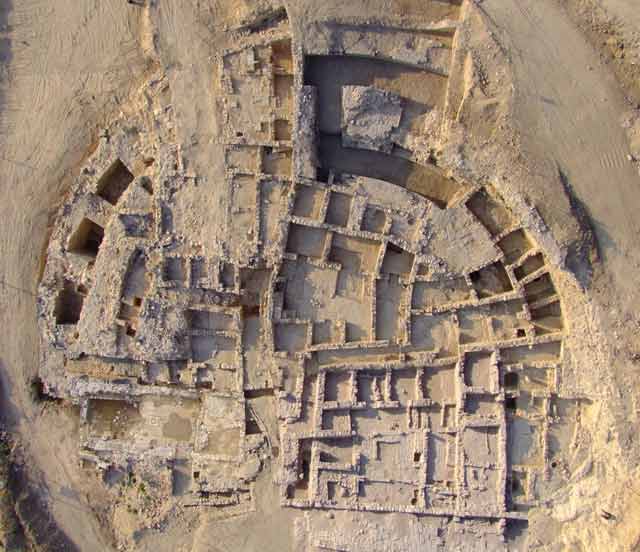 Figure 5. Residential quarter from the Abbasid period, aerial photograph.
Atrash (2010) - Fig. 5 Interpreted photographs
taken during excavations at Tiberias Theatre in 2009 from Ferrario et al (2020)
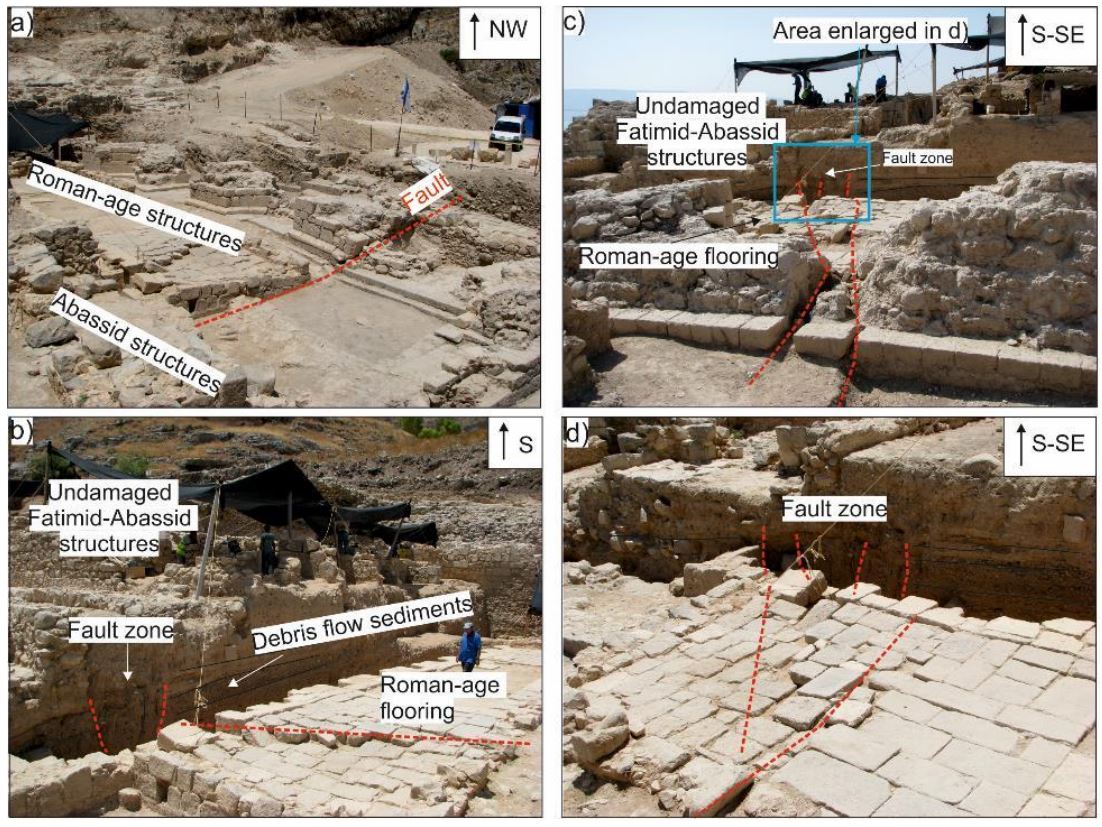 Figure 5. Interpreted photographs taken during excavations at Tiberias Theatre in 2009
(photo courtesy of S. Marco).
Figure 5. Interpreted photographs taken during excavations at Tiberias Theatre in 2009
(photo courtesy of S. Marco).
a) panoramic view on damaged Roman-age structures (fault trace is marked by red dashed line) overlaid by Fatimid-Abassid undamaged structures
b) damaged Roman Theatre flooring overlaid by faulted alluvial sediments (fault trace is marked by red dashed line) and undamaged Fatimid-Abassid structures
c) damaged Roman Theatre wall, overlaid by faulted alluvial sediments
d) detail of the damaged Roman flooring and the faulted alluvial sediments
Ferrario et al (2020) - Fig. S10 Faulted debris flow
sediments found on top of the theater Ferrario et al (2020)
 Figure S10. Clean version of the photograph presented in Figure 5e. JW: faulted debris flow sediments were uncovered while excavating down to the theater. The debris flows preceded
the earthquake
Figure S10. Clean version of the photograph presented in Figure 5e. JW: faulted debris flow sediments were uncovered while excavating down to the theater. The debris flows preceded
the earthquake
Ferrario et al (2020)
- Fig. 4 Map of surface ruptures
in the Beriniki Theatre from Ferrario et al (2020)
Figure 4.
Surface faulting at the Tiberias Theatre:
a) map of ruptures across the Theatre, rose diagrams (bin size 15°) show fractures on archaeological relics from the whole site (red, n° 100) and on the orchestra floor (grey, n° 23); picture view angles (the figure number showing each picture is indicated) and trace of total station profiles are shown as well
b-c) details of the gravity graben displacing seat rows and walls
d) right dihedral best fit solution of fault slip inversion (15 fault planes in the limestone bedrock; Table S3)
e) detail of the limestone normal fault gouge (site is shown in a)
Ferrario et al (2020) - Fig. 3 Theater plan from
Atrash (2010)
Figure 3
Theater plan
Atrash (2010) - Fig. 5 Interpreted photographs
taken during excavations at Tiberias Theatre in 2009 from Ferrario et al (2020)
Figure 5. Interpreted photographs taken during excavations at Tiberias Theatre in 2009
(photo courtesy of S. Marco).
a) panoramic view on damaged Roman-age structures (fault trace is marked by red dashed line) overlaid by Fatimid-Abassid undamaged structures
b) damaged Roman Theatre flooring overlaid by faulted alluvial sediments (fault trace is marked by red dashed line) and undamaged Fatimid-Abassid structures
c) damaged Roman Theatre wall, overlaid by faulted alluvial sediments
d) detail of the damaged Roman flooring and the faulted alluvial sediments
Ferrario et al (2020) - Fig. S10 Faulted debris flow
sediments found on top of the theater Ferrario et al (2020)
Figure S10. Clean version of the photograph presented in Figure 5e. JW: faulted debris flow sediments were uncovered while excavating down to the theater. The debris flows preceded
the earthquake
Ferrario et al (2020)
| Damage Type | Location | Image(s) | Comments |
|---|---|---|---|
| Tilted wall | Site A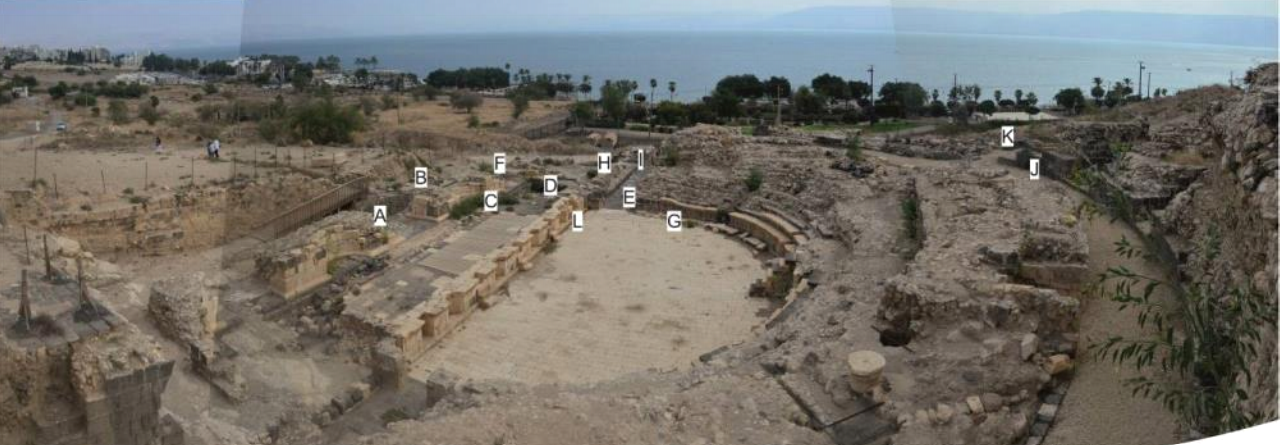 Figure 6
General view of the Berniki theatre (looking NE). The letters show locations of sites. Ferrario et al. (2014)  Figure 12
Alignment of the observed deformation at the Berniki theatre. Features A,B,C,D,L,G,K are all aligned along a N140° direction, as shown. The dashed red line represents the alignment of the observed damages. Ferrario et al. (2014) |
 Figure 7
Deformation observed at the Berniki theatre (Site A). Ferrario et al. (2014) |
|
| Displaced, folded, and tilted wall | Site B
Figure 6 General view of the Berniki theatre (looking NE). The letters show locations of sites. Ferrario et al. (2014)
Figure 12Alignment of the observed deformation at the Berniki theatre. Features A,B,C,D,L,G,K are all aligned along a N140° direction, as shown. The dashed red line represents the alignment of the observed damages. Ferrario et al. (2014) |
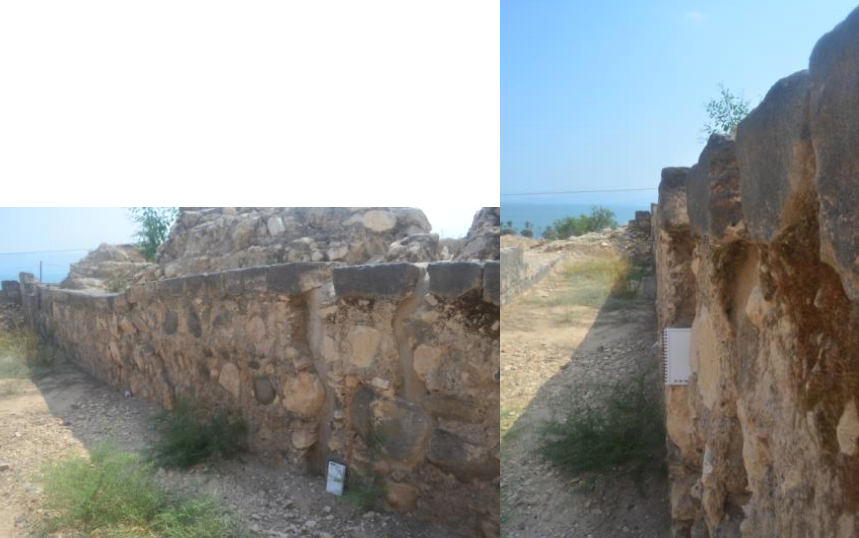 Figure 8
Deformation observed at the Berniki theatre (Site B). Ferrario et al. (2014) |
|
| Fractured wall | Site F
Figure 6 General view of the Berniki theatre (looking NE). The letters show locations of sites. Ferrario et al. (2014) |
|
|
| Tilted wall | Site D
Figure 6 General view of the Berniki theatre (looking NE). The letters show locations of sites. Ferrario et al. (2014)
Figure 12Alignment of the observed deformation at the Berniki theatre. Features A,B,C,D,L,G,K are all aligned along a N140° direction, as shown. The dashed red line represents the alignment of the observed damages. Ferrario et al. (2014) |
|
|
| Tilted wall | Site E
Figure 6 General view of the Berniki theatre (looking NE). The letters show locations of sites. Ferrario et al. (2014) |
|
|
| Fractured wall | Site H
Figure 6 General view of the Berniki theatre (looking NE). The letters show locations of sites. Ferrario et al. (2014) |
|
|
| Fractured wall | Site I
Figure 6 General view of the Berniki theatre (looking NE). The letters show locations of sites. Ferrario et al. (2014) |
|
|
| Fractured wall | Site J
Figure 6 General view of the Berniki theatre (looking NE). The letters show locations of sites. Ferrario et al. (2014) |
|
|
| Displaced wall | Site K
Figure 6 General view of the Berniki theatre (looking NE). The letters show locations of sites. Ferrario et al. (2014)
Figure 12Alignment of the observed deformation at the Berniki theatre. Features A,B,C,D,L,G,K are all aligned along a N140° direction, as shown. The dashed red line represents the alignment of the observed damages. Ferrario et al. (2014) |
 Figure 10
Deformation observed at the Berniki theatre (Site K). Ferrario et al. (2014) |
|
| Tilted and Fractured wall | Site L
Figure 6 General view of the Berniki theatre (looking NE). The letters show locations of sites. Ferrario et al. (2014)
Figure 12Alignment of the observed deformation at the Berniki theatre. Features A,B,C,D,L,G,K are all aligned along a N140° direction, as shown. The dashed red line represents the alignment of the observed damages. Ferrario et al. (2014) |
 Figure 11
Deformation observed at the Berniki theatre (Site L). Ferrario et al. (2014) |
|
| Fault Gouge | 4e - contact between cretaceous limestones and alluvial sediments NW of the theater Figure 4a
map of ruptures across the Theatre, rose diagrams (bin size 15°) show fractures on archaeological relics from the whole site (red, n° 100) and on the orchestra floor (grey, n° 23); picture view angles (the figure number showing each picture is indicated) and trace of total station profiles are shown as well Ferrario et al (2020)  Figure 2c
Drone picture of Tiberias Theater (foreground), the outcropping limestone and the modern town (background) photo courtesy of Y. Darvasi Ferrario et al (2020) |
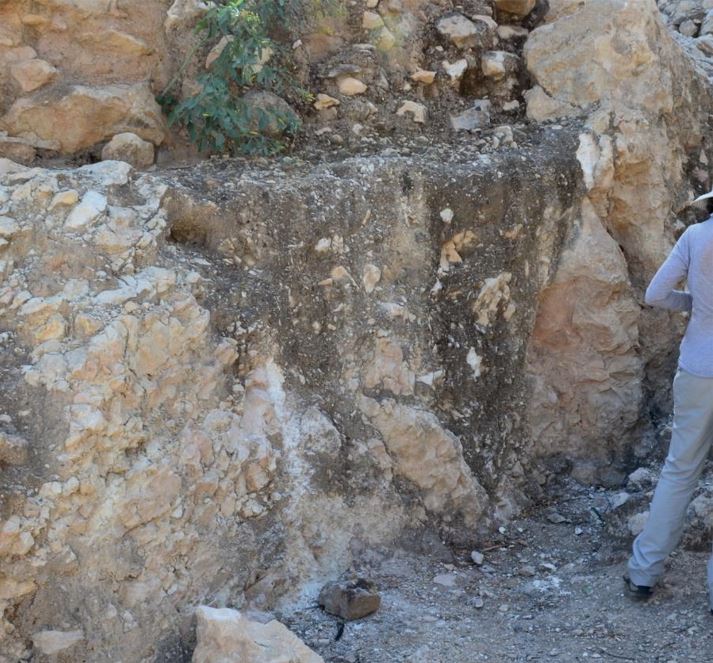 Figure 4e
detail of the limestone normal fault gouge Ferrario et al (2020) 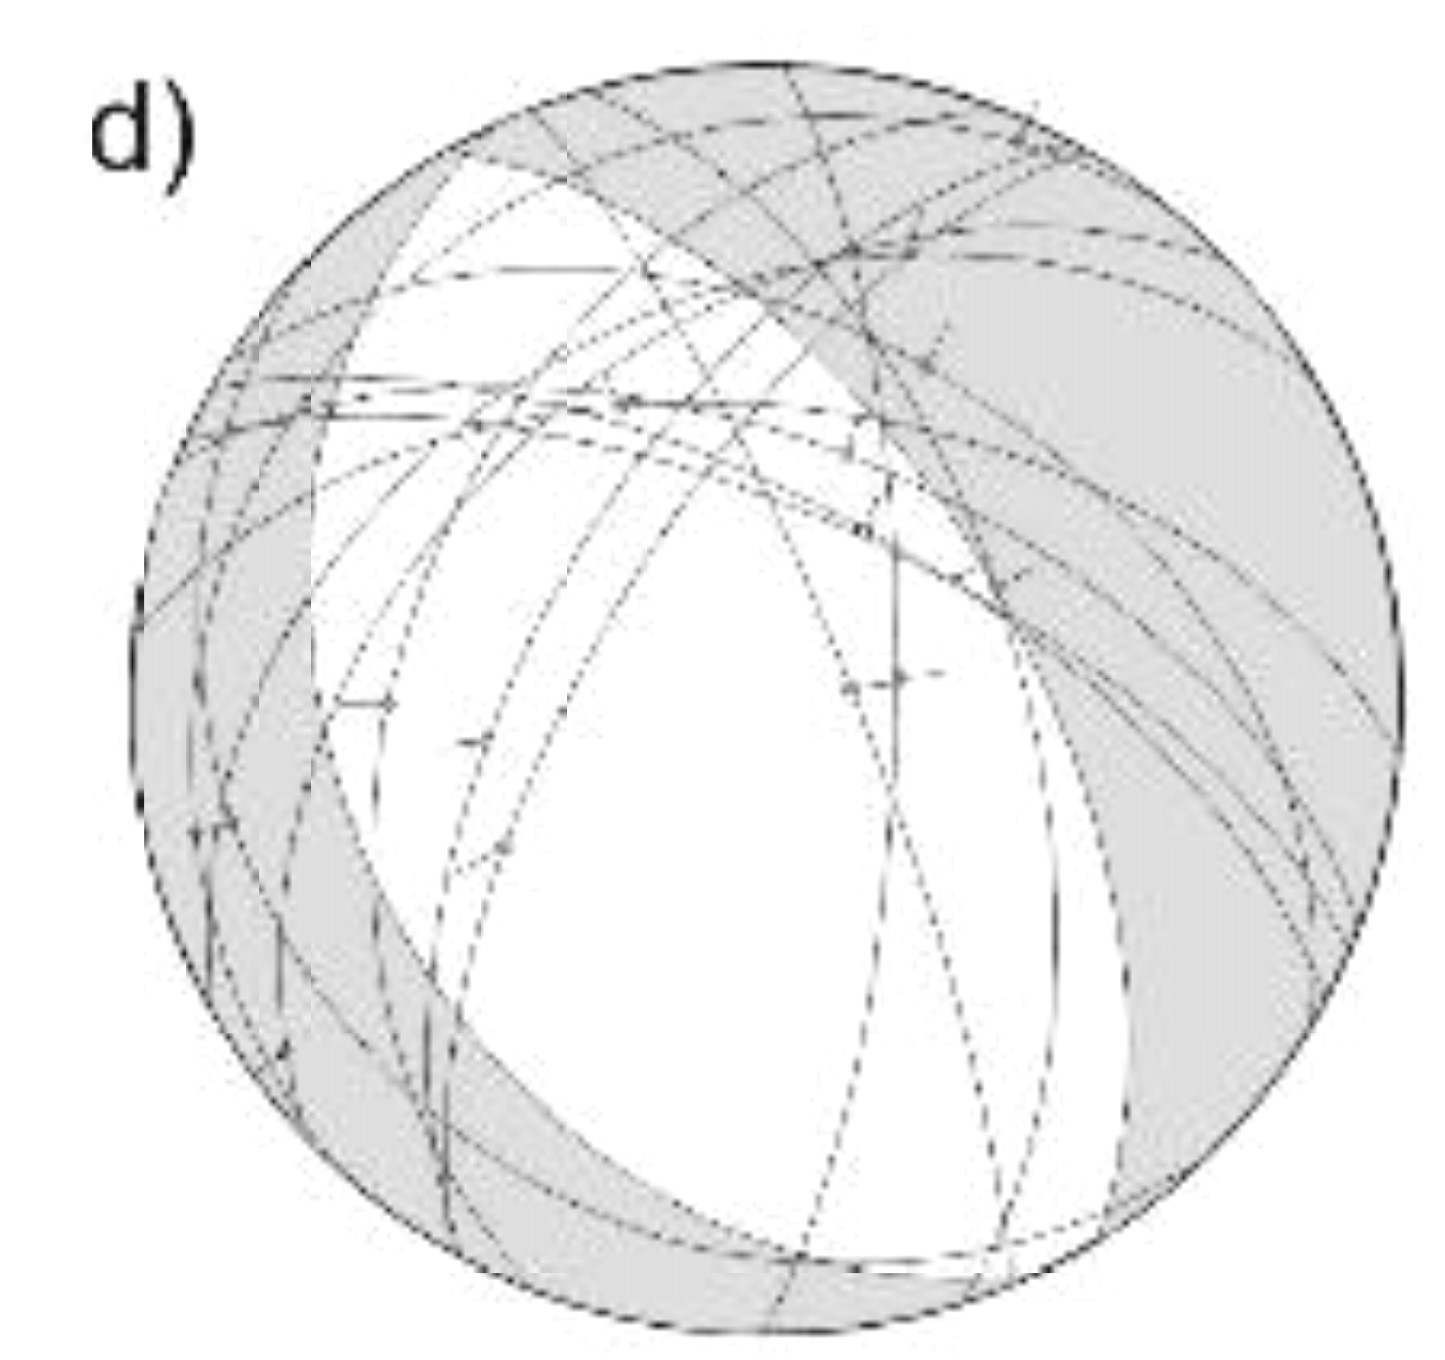 Figure 4d
right dihedral best fit solution of fault slip inversion (15 fault planes in the limestone bedrock; Table S3) Ferrario et al (2020) |
|
| Displaced and tilted Wall and Gravity Graben | Site G - orchestra limestone pavement and lower block of seats
Figure 6 General view of the Berniki theatre (looking NE). The letters show locations of sites. Ferrario et al. (2014)
Figure 4amap of ruptures across the Theatre, rose diagrams (bin size 15°) show fractures on archaeological relics from the whole site (red, n° 100) and on the orchestra floor (grey, n° 23); picture view angles (the figure number showing each picture is indicated) and trace of total station profiles are shown as well Ferrario et al (2020)
Figure 2cDrone picture of Tiberias Theater (foreground), the outcropping limestone and the modern town (background) photo courtesy of Y. Darvasi Ferrario et al (2020)
Figure 12Alignment of the observed deformation at the Berniki theatre. Features A,B,C,D,L,G,K are all aligned along a N140° direction, as shown. The dashed red line represents the alignment of the observed damages. Ferrario et al. (2014) |
 Figure 4b
details of the gravity graben displacing seat rows and walls Ferrario et al (2020)  Figure 4c
details of the gravity graben displacing seat rows and walls Ferrario et al (2020) |
|
| Downfaulting | fault zone going across the theater
Figure 4a map of ruptures across the Theatre, rose diagrams (bin size 15°) show fractures on archaeological relics from the whole site (red, n° 100) and on the orchestra floor (grey, n° 23); picture view angles (the figure number showing each picture is indicated) and trace of total station profiles are shown as well Ferrario et al (2020)
Figure 2cDrone picture of Tiberias Theater (foreground), the outcropping limestone and the modern town (background) photo courtesy of Y. Darvasi Ferrario et al (2020) |
Figure 10 Schematic sketches of the shallow subsurface at three key positions
Information on geology is derived from the Israeli geological map (Sneh, 2008), published scientific literature (e.g., Hurwitz et al., 2002), and local reports (e.g., Zaslavsky, 2009). Borehole logs are from GSI archive Ferrario et al (2020)  Figure 7
a) Topographic profiles obtained with a total station showing the vertical displacement across the studied fault at Tiberias Theatre and the Southern Gate. Each profile is plotted on a relative vertical scale with a vertical exaggeration of ca. 4x b-e) photos of the measured points at Theatre (b-d) and Southern Gate (e), colored dots represent shooting points. Ferrario et al (2020) |
|
| Fractures folds and popups on regular pavements and faulting | fault zone going across the theater
Figure 4a map of ruptures across the Theatre, rose diagrams (bin size 15°) show fractures on archaeological relics from the whole site (red, n° 100) and on the orchestra floor (grey, n° 23); picture view angles (the figure number showing each picture is indicated) and trace of total station profiles are shown as well Ferrario et al (2020)
Figure 2cDrone picture of Tiberias Theater (foreground), the outcropping limestone and the modern town (background) photo courtesy of Y. Darvasi Ferrario et al (2020) |
Figure 5 Interpreted photographs taken during excavations at Tiberias Theatre in 2009 (photo courtesy of S. Marco). a) panoramic view on damaged Roman-age structures (fault trace is marked by red dashed line) overlaid by Fatimid-Abassid undamaged structures b) damaged Roman Theatre flooring overlaid by faulted alluvial sediments (fault trace is marked by red dashed line) and undamaged Fatimid-Abassid structures c) damaged Roman Theatre wall, overlaid by faulted alluvial sediments d) detail of the damaged Roman flooring and the faulted alluvial sediments Ferrario et al (2020)  Figure S6
Clean version of the photograph presented in Figure 5a. Ferrario et al (2020)  Figure S7
Clean version of the photograph presented in Figure 5b. Ferrario et al (2020) 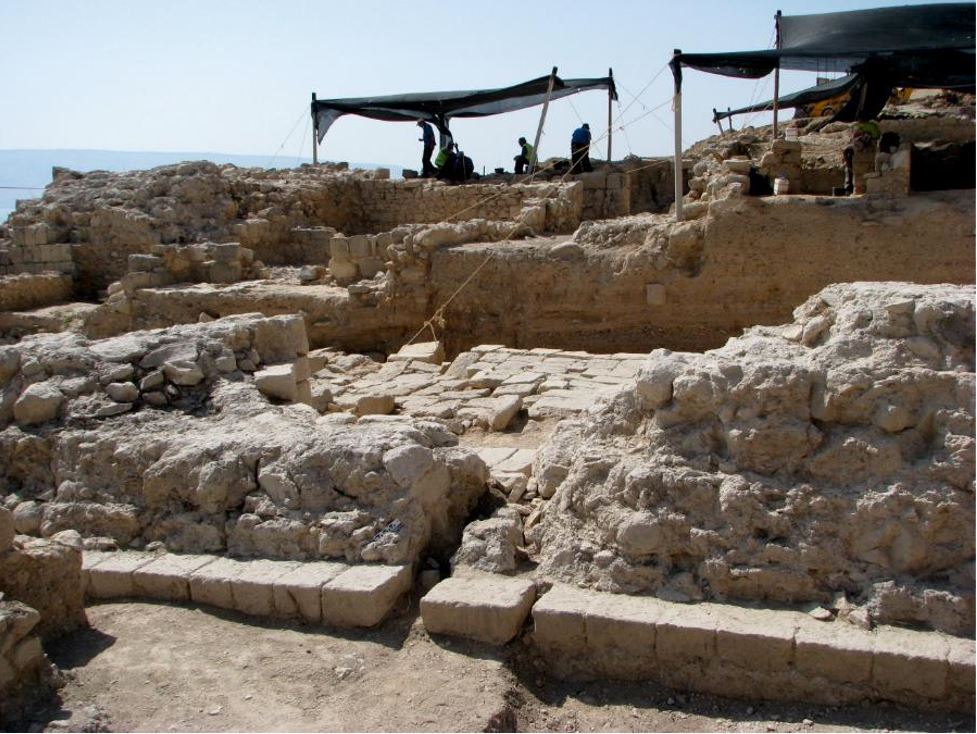 Figure S8
Clean version of the photograph presented in Figure 5c. Ferrario et al (2020)  Figure S9
Clean version of the photograph presented in Figure 5d. Ferrario et al (2020) |
|
| Faulted Debris flow sediments | On top of the theater - uncovered during excavations down to the Theater
Figure 4a map of ruptures across the Theatre, rose diagrams (bin size 15°) show fractures on archaeological relics from the whole site (red, n° 100) and on the orchestra floor (grey, n° 23); picture view angles (the figure number showing each picture is indicated) and trace of total station profiles are shown as well Ferrario et al (2020)
Figure 2cDrone picture of Tiberias Theater (foreground), the outcropping limestone and the modern town (background) photo courtesy of Y. Darvasi Ferrario et al (2020) |
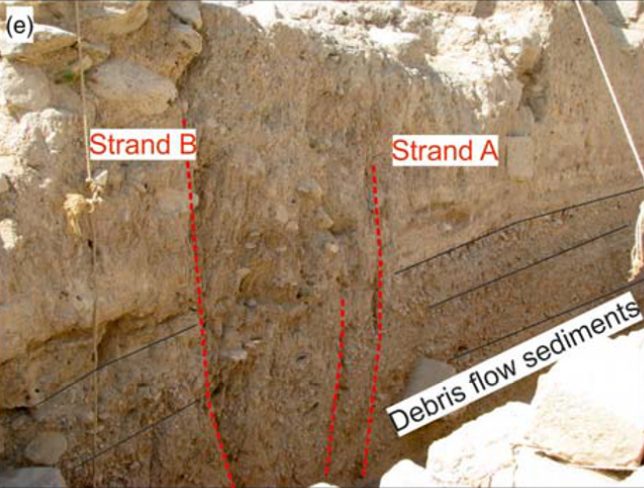 Figure 5e
detail on the faulted debris flow sediments. Ferrario et al (2020)
Figure S10. Clean version of the photograph presented in Figure 5e. JW: faulted debris flow sediments were uncovered while excavating down to the theater. The debris flows preceded
the earthquakeFerrario et al (2020) |
|
| Fractures | Theatre |
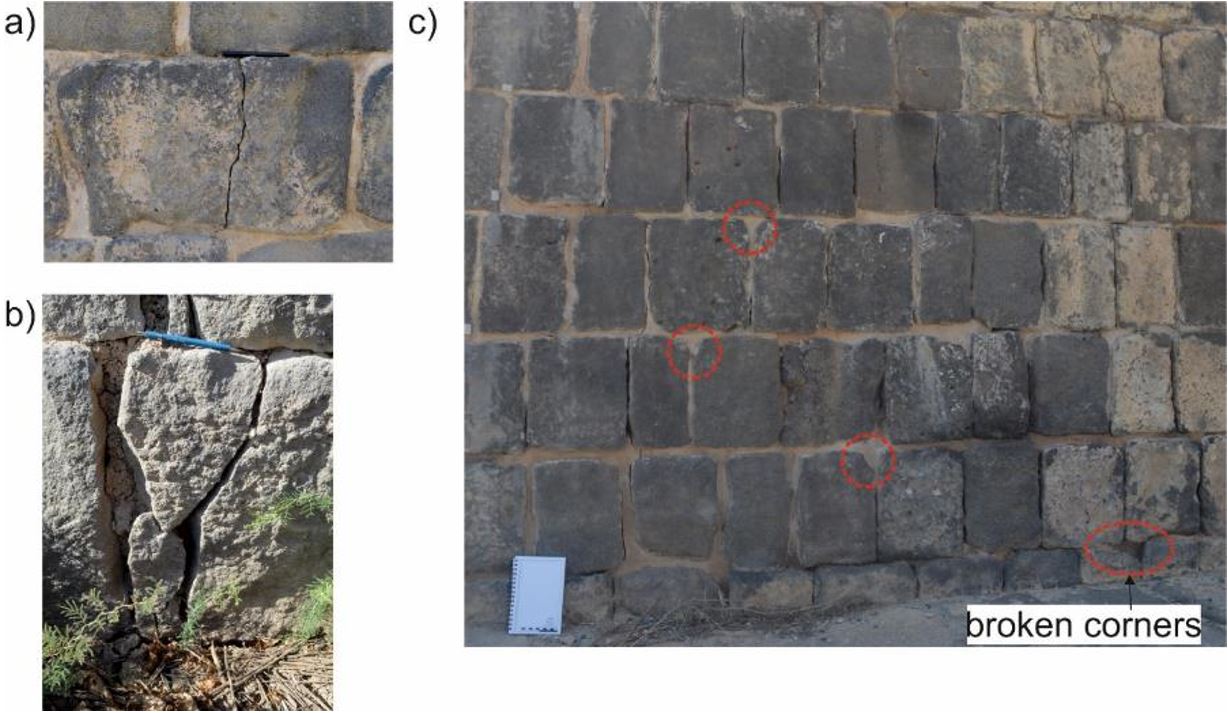 Figure S14
a) example of a fracture affecting a ca. 40-cm high building stone at Tiberias theatre b) fracture affecting a corner of a building stone, Tiberias theatre c) broken corners, Tiberias theatre. Ferrario et al (2020) |
|
| Broken Corners | Theatre | Fig S14
Figure S14 a) example of a fracture affecting a ca. 40-cm high building stone at Tiberias theatre b) fracture affecting a corner of a building stone, Tiberias theatre c) broken corners, Tiberias theatre. Ferrario et al (2020) |
|
- Sketch of Tiberias with
the Berniki Theater highlighted in yellow from BibleWalks.com
Sketch of Tiberias. The Berniki Theater is highlighted in yellow
Used with permission from BibleWalks.com - Fig. 3 Theater plan from
Atrash (2010)
Figure 3
Theater plan
Atrash (2010) - Fig. D Reconstruction of the
Roman theater from Cytryn-Silverman (2015)
Figure D
Roman theater, reconstruction.
Image courtesy of Walid Atrash, Israel Antiquities Authority.
Cytryn-Silverman (2015) - Fig. 4 Map containing Tiberias
sites studied by Ferrario et al (2020)
Figure 4
Map of ancient Tiberias (modified after Hirschfeld & Gutfeld, 2008) with indication of the inferred lineament and trench position.
Ferrario et al (2015) - Fig. 4a Map of surface ruptures
in the Beriniki Theatre from Ferrario et al (2020)
Figure 4a
map of ruptures across the Theatre, rose diagrams (bin size 15°) show fractures on archaeological relics from the whole site (red, n° 100) and on the orchestra floor (grey, n° 23); picture view angles (the figure number showing each picture is indicated) and trace of total station profiles are shown as well
Ferrario et al (2020) - Fig. 4b Gravity Graben in the
Beriniki Theatre from Ferrario et al (2020)
Figure 4b
details of the gravity graben displacing seat rows and walls
Ferrario et al (2020) - Fig. 4c Gravity Graben in the
Beriniki Theatre from Ferrario et al (2020)
Figure 4c
details of the gravity graben displacing seat rows and walls
Ferrario et al (2020) - Fig. 4d best fit solution of
fault slip inversion from Ferrario et al (2020)
Figure 4d
right dihedral best fit solution of fault slip inversion (15 fault planes in the limestone bedrock; Table S3)
Ferrario et al (2020) - Fig. 4e normal fault gouge
from Ferrario et al (2020)
Figure 4e
detail of the limestone normal fault gouge
Ferrario et al (2020) - Fig. 5 Interpreted photographs
taken during excavations at Tiberias Theatre in 2009 from Ferrario et al (2020)
Figure 5
Interpreted photographs taken during excavations at Tiberias Theatre in 2009 (photo courtesy of S. Marco).
a) panoramic view on damaged Roman-age structures (fault trace is marked by red dashed line) overlaid by Fatimid-Abassid undamaged structures
b) damaged Roman Theatre flooring overlaid by faulted alluvial sediments (fault trace is marked by red dashed line) and undamaged Fatimid-Abassid structures
c) damaged Roman Theatre wall, overlaid by faulted alluvial sediments
d) detail of the damaged Roman flooring and the faulted alluvial sediments
Ferrario et al (2020) - Fig. 7 Vertical displacement
across the inferred fault in Ancient Tiberias from Ferrario et al (2020)
Figure 7
a) Topographic profiles obtained with a total station showing the vertical displacement across the studied fault at Tiberias Theatre and the Southern Gate. Each profile is plotted on a relative vertical scale with a vertical exaggeration of ca. 4x
b-e) photos of the measured points at Theatre (b-d) and Southern Gate (e), colored dots represent shooting points.
Ferrario et al (2020)
- Fig. 3 Theater plan from
Atrash (2010)
Figure 3
Theater plan
Atrash (2010) - Fig. 4a Map of surface ruptures
in the Beriniki Theatre from Ferrario et al (2020)
Figure 4a
map of ruptures across the Theatre, rose diagrams (bin size 15°) show fractures on archaeological relics from the whole site (red, n° 100) and on the orchestra floor (grey, n° 23); picture view angles (the figure number showing each picture is indicated) and trace of total station profiles are shown as well
Ferrario et al (2020) - Fig. 4b Gravity Graben in the
Beriniki Theatre from Ferrario et al (2020)
Figure 4b
details of the gravity graben displacing seat rows and walls
Ferrario et al (2020) - Fig. 4c Gravity Graben in the
Beriniki Theatre from Ferrario et al (2020)
Figure 4c
details of the gravity graben displacing seat rows and walls
Ferrario et al (2020) - Fig. 4e normal fault gouge
from Ferrario et al (2020)
Figure 4e
detail of the limestone normal fault gouge
Ferrario et al (2020) - Fig. 5 Interpreted photographs
taken during excavations at Tiberias Theatre in 2009 from Ferrario et al (2020)
Figure 5
Interpreted photographs taken during excavations at Tiberias Theatre in 2009 (photo courtesy of S. Marco).
a) panoramic view on damaged Roman-age structures (fault trace is marked by red dashed line) overlaid by Fatimid-Abassid undamaged structures
b) damaged Roman Theatre flooring overlaid by faulted alluvial sediments (fault trace is marked by red dashed line) and undamaged Fatimid-Abassid structures
c) damaged Roman Theatre wall, overlaid by faulted alluvial sediments
d) detail of the damaged Roman flooring and the faulted alluvial sediments
Ferrario et al (2020) - Fig. 7 Vertical displacement
across the inferred fault in Ancient Tiberias from Ferrario et al (2020)
Figure 7
a) Topographic profiles obtained with a total station showing the vertical displacement across the studied fault at Tiberias Theatre and the Southern Gate. Each profile is plotted on a relative vertical scale with a vertical exaggeration of ca. 4x
b-e) photos of the measured points at Theatre (b-d) and Southern Gate (e), colored dots represent shooting points.
Ferrario et al (2020)
Cretaceous limestones outcrop in the NW side of the Theatre (Fig. 4a
Figure 4a) map of ruptures across the Theatre, rose diagrams (bin size 15°) show fractures on archaeological relics from the whole site (red, n°
100) and on the orchestra floor (grey, n° 23); picture view angles (the figure number showing
each picture is indicated) and trace of total station profiles are shown as well
Ferrario et al (2020)
Figure 4e) detail of the limestone normal fault gougeFerrario et al (2020)
Figure 4d) right dihedral best fit solution of fault slip inversion (15 fault planes in the limestone bedrock; Table S3)Ferrario et al (2020)
The Theatre preserves evidence of damage (Fig. 4a
Figure 4a) map of ruptures across the Theatre, rose diagrams (bin size 15°) show fractures on archaeological relics from the whole site (red, n°
100) and on the orchestra floor (grey, n° 23); picture view angles (the figure number showing
each picture is indicated) and trace of total station profiles are shown as well
Ferrario et al (2020)
Figure 4e) e) detail of the limestone normal fault gougeFerrario et al (2020)
Figure 4b) details of the gravity graben displacing seat rows and walls
Ferrario et al (2020)
Figure 4c) details of the gravity graben displacing seat rows and walls
Ferrario et al (2020)
Figure 7a) Topographic profiles obtained with a total station showing the vertical displacement across the studied fault at Tiberias Theatre and the Southern Gate. Each profile is plotted on a relative vertical scale with a vertical exaggeration of ca. 4x
b-e) photos of the measured points at Theatre (b-d) and Southern Gate (e), colored dots represent shooting points.
Ferrario et al (2020)
Photos taken in 2009 during the archaeological excavation show that normal displacement affects Roman-age floorings as well as debris flow sediments covering the Theatre pavement (Fig. 5
Figure 5. Interpreted photographs taken during excavations at Tiberias Theatre in 2009
(photo courtesy of S. Marco).a) panoramic view on damaged Roman-age structures (fault trace is marked by red dashed line) overlaid by Fatimid-Abassid undamaged structures
b) damaged Roman Theatre flooring overlaid by faulted alluvial sediments (fault trace is marked by red dashed line) and undamaged Fatimid-Abassid structures
c) damaged Roman Theatre wall, overlaid by faulted alluvial sediments
d) detail of the damaged Roman flooring and the faulted alluvial sediments
Ferrario et al (2020)
- Modified by JW from Fig.s 6 and 8 of Atrash (2012)
LeftBerniki Theater (view towards the south) with pink highlighting where downdropped graben has created a fractured zone
Modified by JW from Fig. 6 of Atrash (2012)
Right
Berniki Theater (view towards the WSW) with pink highlighting where downdropped graben has created a fractured zone
Modified by JW from Fig. 8 of Atrash (2012)
- Site A
Tilting on a 1.60 m high wall; the wall direction is N50°; fractures and tilting are located in a 5 m long zone, up to 15 cm of spacing between the two sides, later cemented
Figure 7
Deformation observed at the Berniki theatre (Site A).
Ferrario et al. (2014) - Site B
Fractures and tilting on a 1.70 m high wall; 6 m long zone, up to 25 cm spacing, 10 cm left displacement.
Figure 8
Deformation observed at the Berniki theatre (Site B).
Ferrario et al. (2014) - Site F Same wall as B but 7 m to the E, here 1.60 m high; fracture in a 2 m long zone, up to 10 cm spacing.
- Site D Tilting in a 4 m high wall, spacing up to 2-3 cm, less clear than previous evidences.
- Site E Tilting in a 2 m high wall, feature similar to D, no spacing nor lateral displacement.
- Site G
Fracture and tilting on a 80 cm high wall; wall direction: N150°, spacing ca. 1 cm.
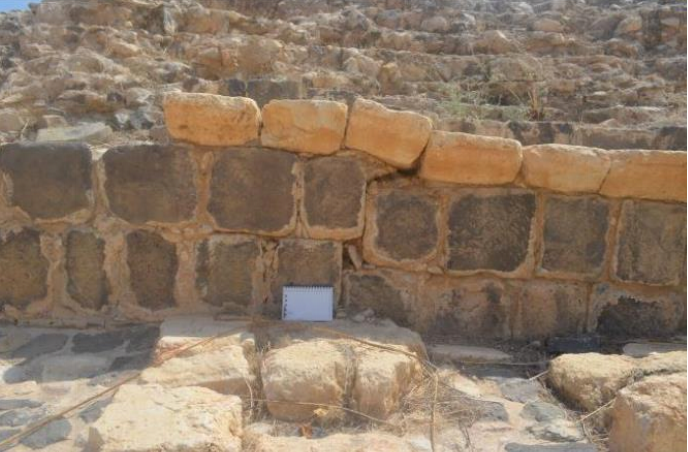 Figure 9
Deformation observed at the Berniki theatre (Site G).
Ferrario et al. (2014) - Site H Vertical fracture on a 1 m high wall, no spacing nor lateral displacement.
- Site I Fracture on a ca. 4 m high wall, no spacing nor lateral displacement.
- Site J Fracture on a 1 m high wall, spacing max 3 cm, no lateral displacement.
- Site K
Right displacement of 15 cm on two N35° oriented walls, 80 cm high, part of a rectangular structure 3x4 m. Some tilting to the E seems visible on the N wall, but not on the S one (pictures 586-587).
Figure 10
Deformation observed at the Berniki theatre (Site K).
Ferrario et al. (2014) - Site L
Fractures and tilting on a 1 m long zone, 1 m high wall, spacing up to 10 cm.
Figure 11
Deformation observed at the Berniki theatre (Site L).
Ferrario et al. (2014) - Site descriptions and photos are from Ferrario et al. (2014)
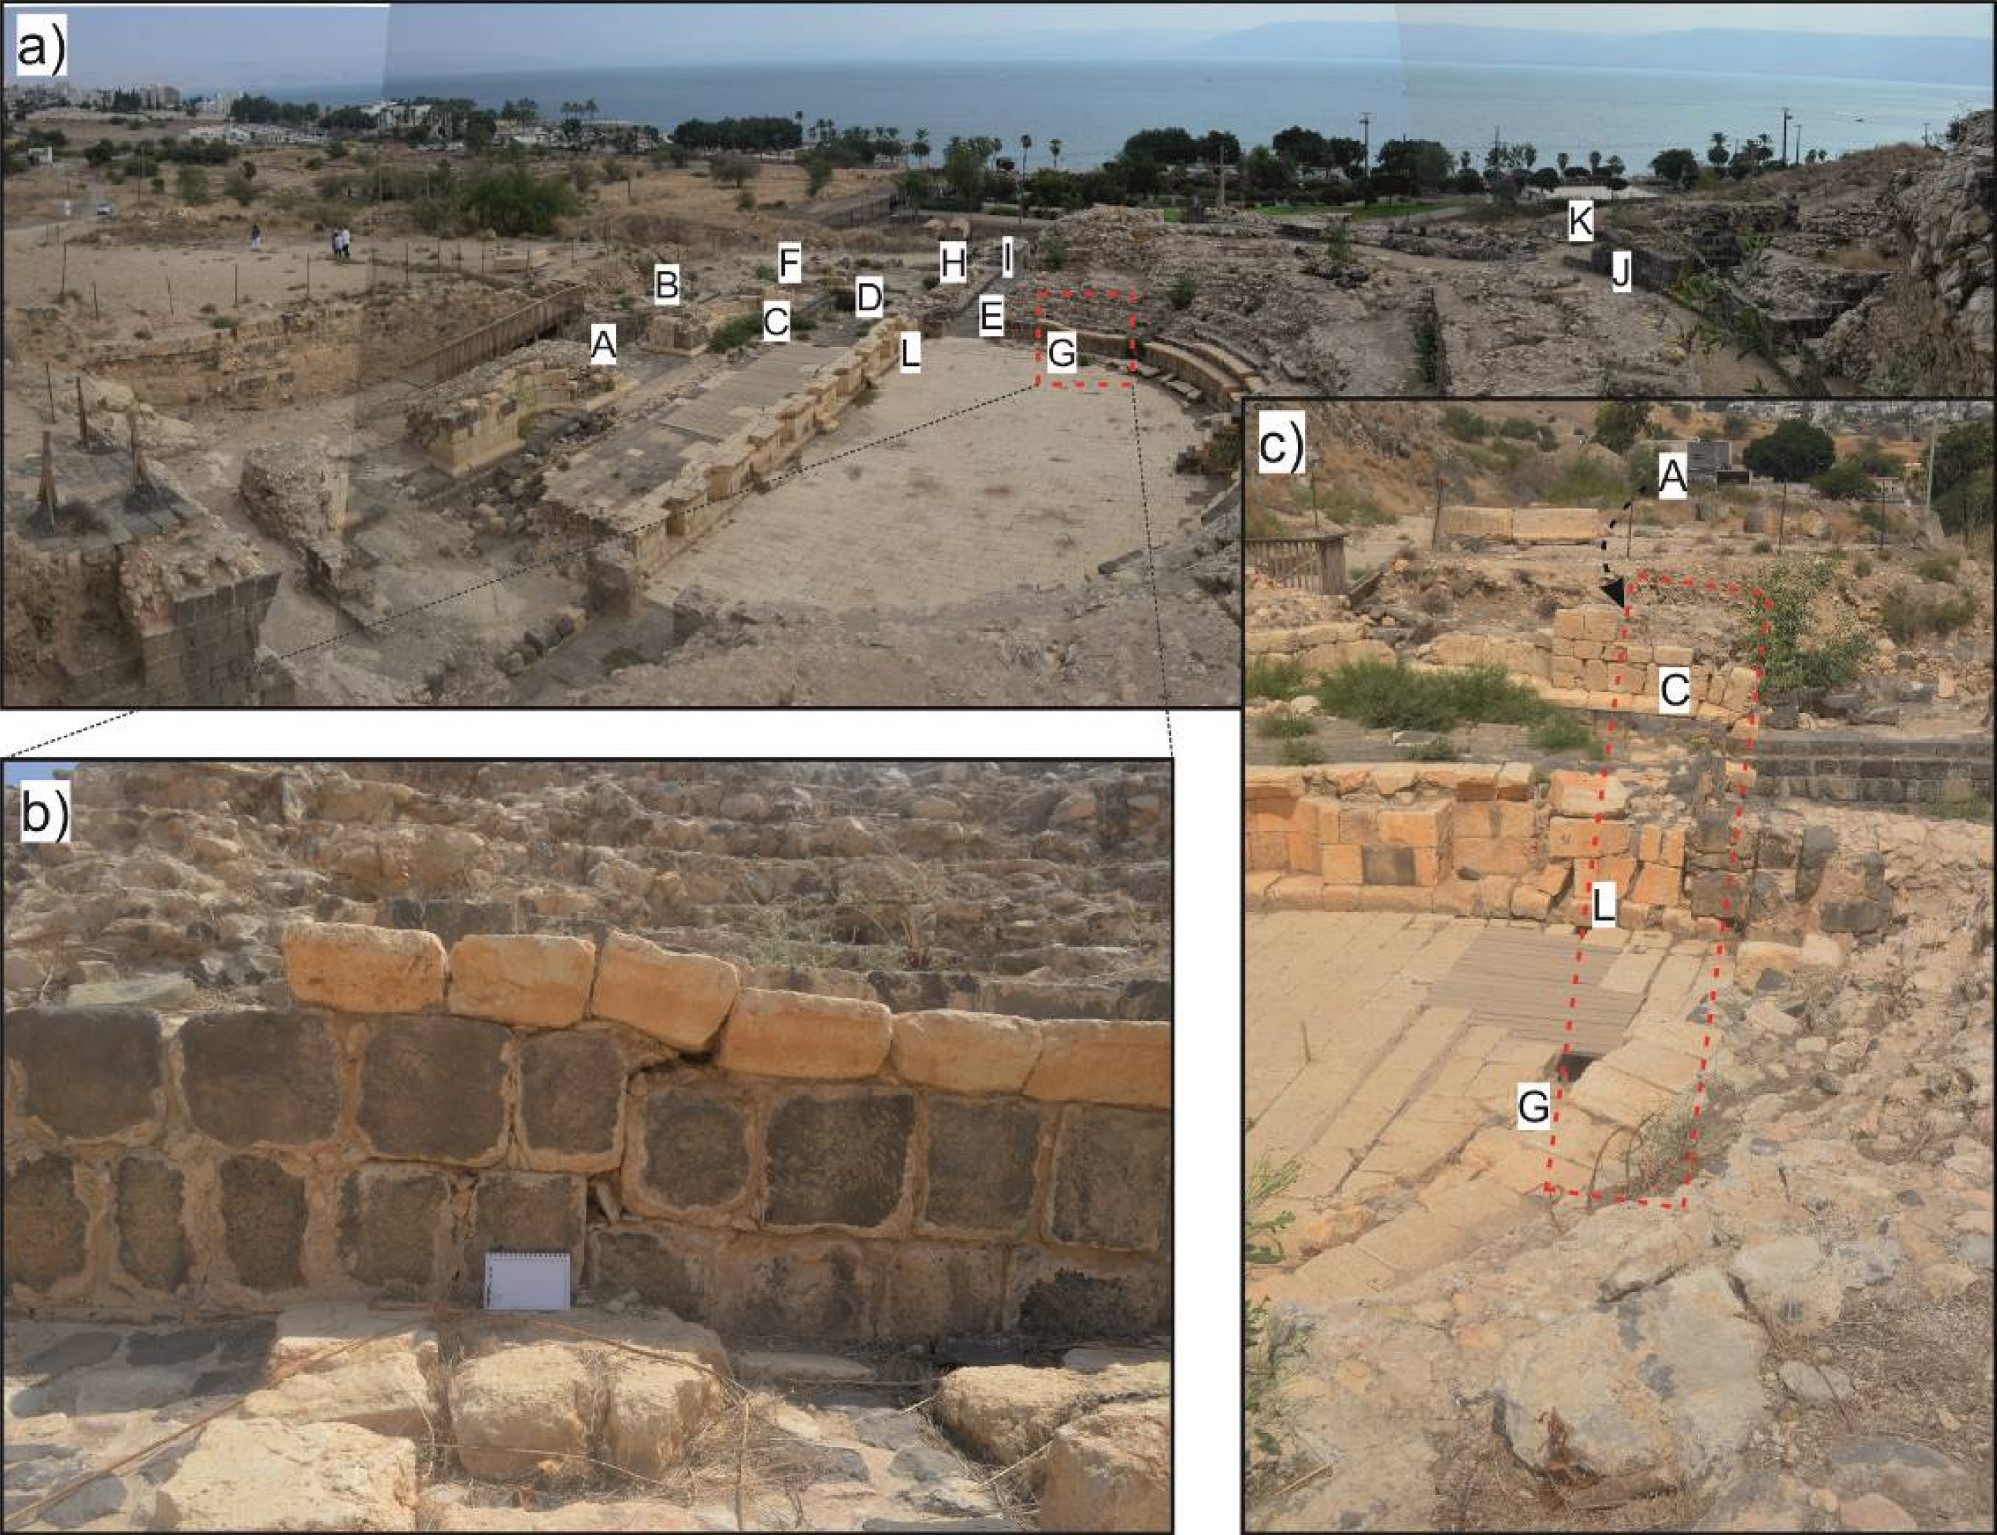 Fig. 3
- General view of the Beriniki theatre (looking NE); the letters show locations of main features
- Detail of an observed deformation
- Alignment of deformations along a N140° direction
Ferrario et al (2020)
Figure 4: Map of ancient Tiberias (modified after Hirschfeld & Gutfeld, 2008) with indication of the inferred lineament and trench position.Ferrario et al (2020)
- Left - Deformation Map modified by JW from Fig. 3 of Atrash (2010)
- Right - Section from Fig. 10a of Ferrario et al (2020)
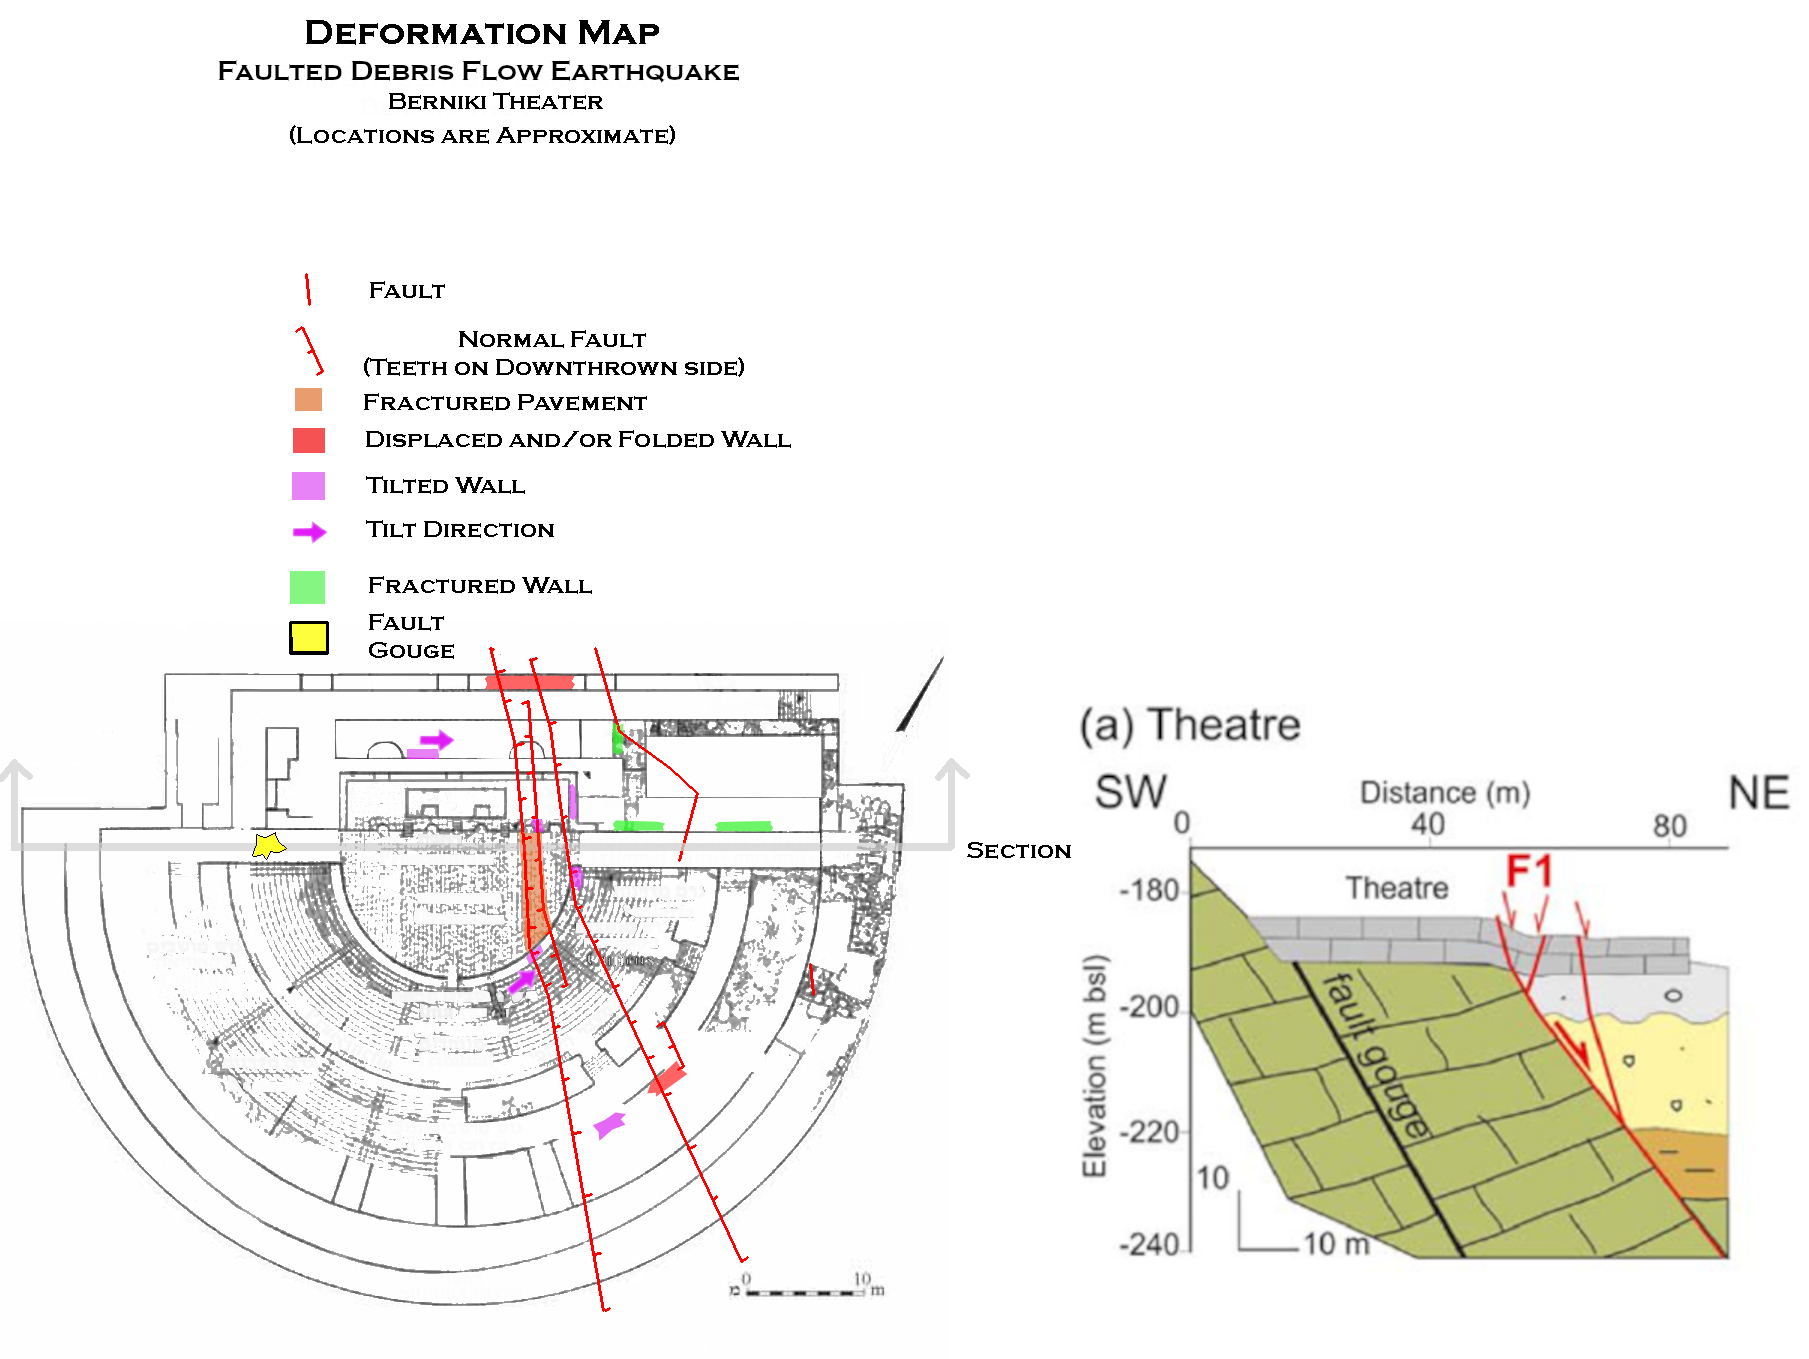 Deformation Map (left)
Modified by JW from Fig. 3 of Atrash (2010)
Section (right)
from Fig. 10a of Ferrario et al (2020)
Click on image to open in a new tab
- Earthquake Archeological Effects chart
of Rodríguez-Pascua et al (2013: 221-224)
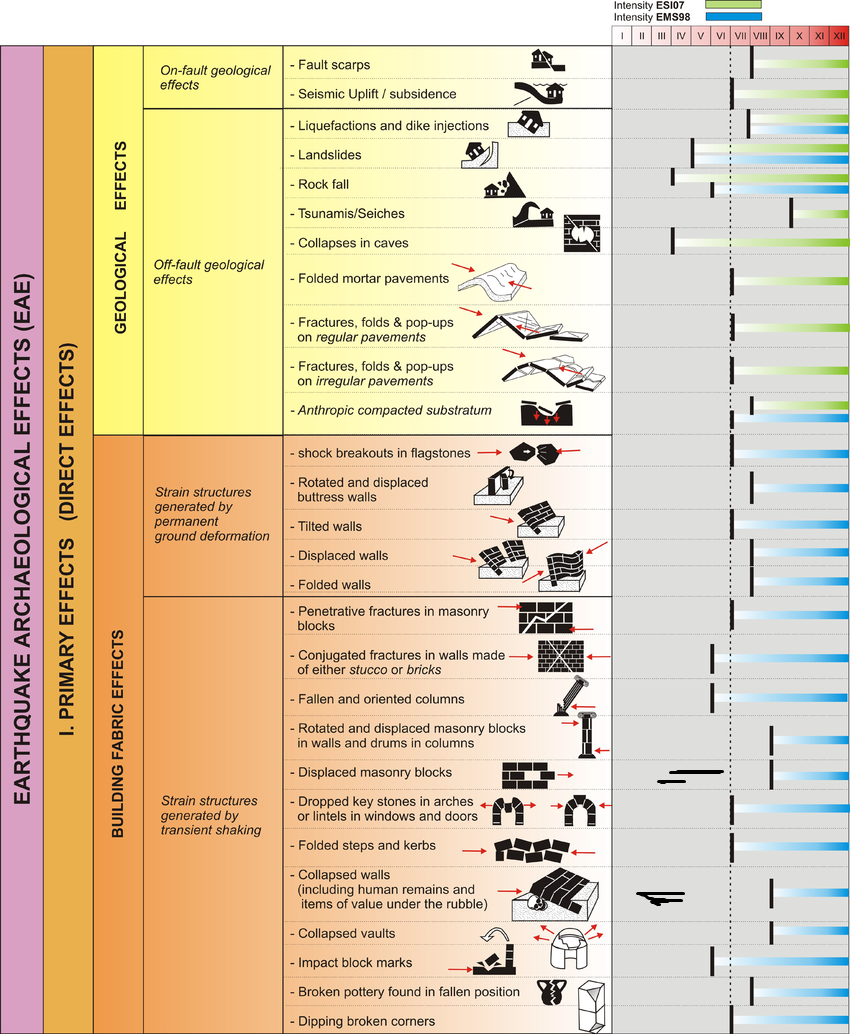 Earthquake Archeological Effects (EAE)
Rodríguez-Pascua et al (2013: 221-224)
| Damage Type | Location | Image(s) | Comments | Intensity |
|---|---|---|---|---|
| Tilted wall | Site A
Figure 6 General view of the Berniki theatre (looking NE). The letters show locations of sites. Ferrario et al. (2014)
Figure 12Alignment of the observed deformation at the Berniki theatre. Features A,B,C,D,L,G,K are all aligned along a N140° direction, as shown. The dashed red line represents the alignment of the observed damages. Ferrario et al. (2014) |
Figure 7 Deformation observed at the Berniki theatre (Site A). Ferrario et al. (2014) |
|
VI + |
| Displaced, folded, and tilted wall | Site B
Figure 6 General view of the Berniki theatre (looking NE). The letters show locations of sites. Ferrario et al. (2014)
Figure 12Alignment of the observed deformation at the Berniki theatre. Features A,B,C,D,L,G,K are all aligned along a N140° direction, as shown. The dashed red line represents the alignment of the observed damages. Ferrario et al. (2014) |
Figure 8 Deformation observed at the Berniki theatre (Site B). Ferrario et al. (2014) |
|
VII + |
| Fractured wall | Site F
Figure 6 General view of the Berniki theatre (looking NE). The letters show locations of sites. Ferrario et al. (2014) |
|
VI + | |
| Tilted wall | Site D
Figure 6 General view of the Berniki theatre (looking NE). The letters show locations of sites. Ferrario et al. (2014)
Figure 12Alignment of the observed deformation at the Berniki theatre. Features A,B,C,D,L,G,K are all aligned along a N140° direction, as shown. The dashed red line represents the alignment of the observed damages. Ferrario et al. (2014) |
|
VI + | |
| Tilted wall | Site E
Figure 6 General view of the Berniki theatre (looking NE). The letters show locations of sites. Ferrario et al. (2014) |
|
VI + | |
| Fractured wall | Site H
Figure 6 General view of the Berniki theatre (looking NE). The letters show locations of sites. Ferrario et al. (2014) |
|
VI + | |
| Fractured wall | Site I
Figure 6 General view of the Berniki theatre (looking NE). The letters show locations of sites. Ferrario et al. (2014) |
|
VI + | |
| Fractured wall | Site J
Figure 6 General view of the Berniki theatre (looking NE). The letters show locations of sites. Ferrario et al. (2014) |
|
VI + | |
| Displaced wall | Site K
Figure 6 General view of the Berniki theatre (looking NE). The letters show locations of sites. Ferrario et al. (2014)
Figure 12Alignment of the observed deformation at the Berniki theatre. Features A,B,C,D,L,G,K are all aligned along a N140° direction, as shown. The dashed red line represents the alignment of the observed damages. Ferrario et al. (2014) |
Figure 10 Deformation observed at the Berniki theatre (Site K). Ferrario et al. (2014) |
|
VII + |
| Tilted and Fractured wall | Site L
Figure 6 General view of the Berniki theatre (looking NE). The letters show locations of sites. Ferrario et al. (2014)
Figure 12Alignment of the observed deformation at the Berniki theatre. Features A,B,C,D,L,G,K are all aligned along a N140° direction, as shown. The dashed red line represents the alignment of the observed damages. Ferrario et al. (2014) |
Figure 11 Deformation observed at the Berniki theatre (Site L). Ferrario et al. (2014) |
|
VI + |
| Fault Gouge | 4e - contact between cretaceous limestones and alluvial sediments NW of the theater
Figure 4a map of ruptures across the Theatre, rose diagrams (bin size 15°) show fractures on archaeological relics from the whole site (red, n° 100) and on the orchestra floor (grey, n° 23); picture view angles (the figure number showing each picture is indicated) and trace of total station profiles are shown as well Ferrario et al (2020)
Figure 2cDrone picture of Tiberias Theater (foreground), the outcropping limestone and the modern town (background) photo courtesy of Y. Darvasi Ferrario et al (2020) |
Figure 4e detail of the limestone normal fault gouge Ferrario et al (2020)
Figure 4dright dihedral best fit solution of fault slip inversion (15 fault planes in the limestone bedrock; Table S3) Ferrario et al (2020) |
|
? |
| Displaced and tilted Wall and Gravity Graben | Site G - orchestra limestone pavement and lower block of seats
Figure 6 General view of the Berniki theatre (looking NE). The letters show locations of sites. Ferrario et al. (2014)
Figure 4amap of ruptures across the Theatre, rose diagrams (bin size 15°) show fractures on archaeological relics from the whole site (red, n° 100) and on the orchestra floor (grey, n° 23); picture view angles (the figure number showing each picture is indicated) and trace of total station profiles are shown as well Ferrario et al (2020)
Figure 2cDrone picture of Tiberias Theater (foreground), the outcropping limestone and the modern town (background) photo courtesy of Y. Darvasi Ferrario et al (2020)
Figure 12Alignment of the observed deformation at the Berniki theatre. Features A,B,C,D,L,G,K are all aligned along a N140° direction, as shown. The dashed red line represents the alignment of the observed damages. Ferrario et al. (2014) |
Figure 4b details of the gravity graben displacing seat rows and walls Ferrario et al (2020)
Figure 4cdetails of the gravity graben displacing seat rows and walls Ferrario et al (2020) |
|
VII + |
| Downfaulting | fault zone going across the theater
Figure 4a map of ruptures across the Theatre, rose diagrams (bin size 15°) show fractures on archaeological relics from the whole site (red, n° 100) and on the orchestra floor (grey, n° 23); picture view angles (the figure number showing each picture is indicated) and trace of total station profiles are shown as well Ferrario et al (2020)
Figure 2cDrone picture of Tiberias Theater (foreground), the outcropping limestone and the modern town (background) photo courtesy of Y. Darvasi Ferrario et al (2020) |
Figure 10 Schematic sketches of the shallow subsurface at three key positions
Information on geology is derived from the Israeli geological map (Sneh, 2008), published scientific literature (e.g., Hurwitz et al., 2002), and local reports (e.g., Zaslavsky, 2009). Borehole logs are from GSI archive Ferrario et al (2020)
Figure 7a) Topographic profiles obtained with a total station showing the vertical displacement across the studied fault at Tiberias Theatre and the Southern Gate. Each profile is plotted on a relative vertical scale with a vertical exaggeration of ca. 4x b-e) photos of the measured points at Theatre (b-d) and Southern Gate (e), colored dots represent shooting points. Ferrario et al (2020) |
|
VI + |
| Fractures folds and popups on regular pavements and faulting | fault zone going across the theater
Figure 4a map of ruptures across the Theatre, rose diagrams (bin size 15°) show fractures on archaeological relics from the whole site (red, n° 100) and on the orchestra floor (grey, n° 23); picture view angles (the figure number showing each picture is indicated) and trace of total station profiles are shown as well Ferrario et al (2020)
Figure 2cDrone picture of Tiberias Theater (foreground), the outcropping limestone and the modern town (background) photo courtesy of Y. Darvasi Ferrario et al (2020) |
Figure 5 Interpreted photographs taken during excavations at Tiberias Theatre in 2009 (photo courtesy of S. Marco). a) panoramic view on damaged Roman-age structures (fault trace is marked by red dashed line) overlaid by Fatimid-Abassid undamaged structures b) damaged Roman Theatre flooring overlaid by faulted alluvial sediments (fault trace is marked by red dashed line) and undamaged Fatimid-Abassid structures c) damaged Roman Theatre wall, overlaid by faulted alluvial sediments d) detail of the damaged Roman flooring and the faulted alluvial sediments Ferrario et al (2020)
Figure S6Clean version of the photograph presented in Figure 5a. Ferrario et al (2020)
Figure S7Clean version of the photograph presented in Figure 5b. Ferrario et al (2020)
Figure S8Clean version of the photograph presented in Figure 5c. Ferrario et al (2020)
Figure S9Clean version of the photograph presented in Figure 5d. Ferrario et al (2020) |
|
VI + |
| Faulted Debris flow sediments | On top of the theater - uncovered during excavations down to the Theater
Figure 4a map of ruptures across the Theatre, rose diagrams (bin size 15°) show fractures on archaeological relics from the whole site (red, n° 100) and on the orchestra floor (grey, n° 23); picture view angles (the figure number showing each picture is indicated) and trace of total station profiles are shown as well Ferrario et al (2020)
Figure 2cDrone picture of Tiberias Theater (foreground), the outcropping limestone and the modern town (background) photo courtesy of Y. Darvasi Ferrario et al (2020) |
Figure 5e detail on the faulted debris flow sediments. Ferrario et al (2020)
Figure S10. Clean version of the photograph presented in Figure 5e. JW: faulted debris flow sediments were uncovered while excavating down to the theater. The debris flows preceded
the earthquakeFerrario et al (2020) |
|
? |
| Fractures | Theatre |
Figure S14 a) example of a fracture affecting a ca. 40-cm high building stone at Tiberias theatre b) fracture affecting a corner of a building stone, Tiberias theatre c) broken corners, Tiberias theatre. Ferrario et al (2020) |
|
VI + |
| Broken Corners | Theatre | Fig S14
Figure S14 a) example of a fracture affecting a ca. 40-cm high building stone at Tiberias theatre b) fracture affecting a corner of a building stone, Tiberias theatre c) broken corners, Tiberias theatre. Ferrario et al (2020) |
|
VI + |