Hippos/Sussita
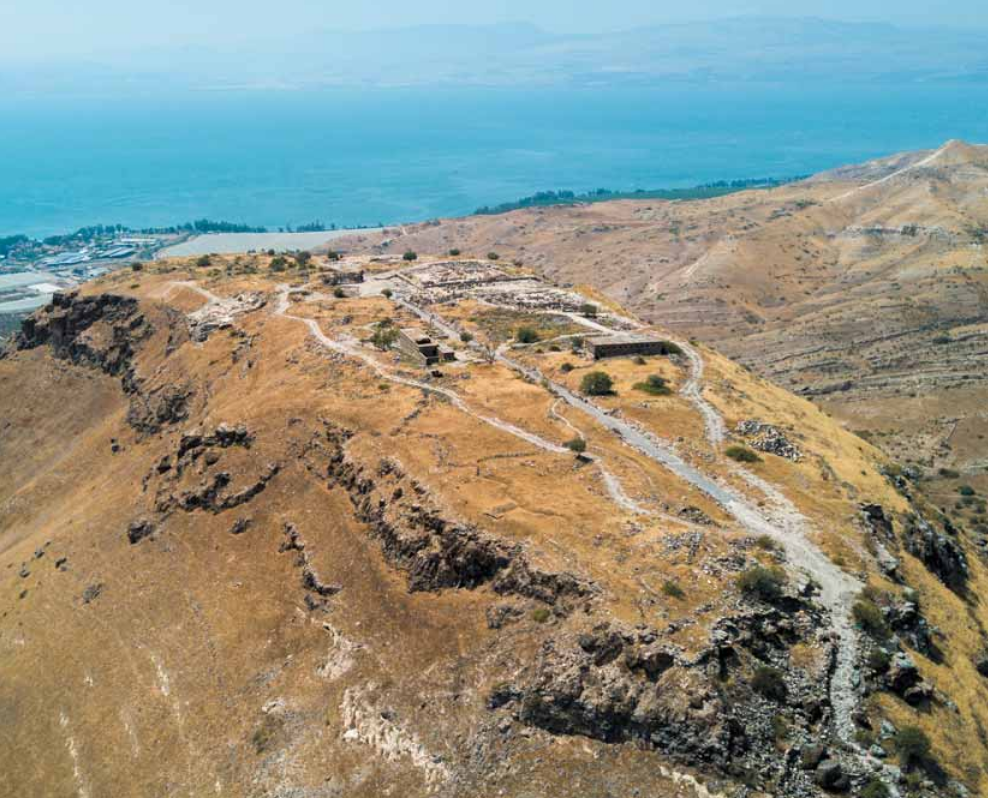 Photo of Hippos Sussita
Wechsler and Marco (2017)
| Transliterated Name | Language | Name |
|---|---|---|
| Hippos | Greek | Ἵππος |
| Antiochia Hippos | Greek | Αντιοχεία Ἵππος |
| Hippum | Latin | |
| Sussita | Hebrew | סוסיתא |
| Sus | Hebrew | סוס |
| Sussita | Aramaic | |
| Susiya | Early Islamic Arabic | |
| Qal‘at al-Ḥuṣn | Arabic | قلعة الحصن |
- Fig. 26 Streams and springs
around Hippos Sussita from Segal et al. (2013)
 Fig. 26
Geographical settings of the Sussita region. For transect T-T' see fig. 32 below.
Segal et al. (2013) - Fig. 28 Geologic Map of
Hippos Sussita from Segal et al. (2013)
 Fig. 28
Geological map of the Sussita region and main rock formations (Fm.); modified after a Geological Survey, 2008.
- Emr- Eocene Maresha Fm.
- Of- Fiq Fm.
- Os- Sussita Fm.
- Me- En Gev Fm.
- Mh- Hordos Fm.
- Mβl- Lower Basalt Fm.
- Mbi- Bira Fm.
- Pg- Gesher Fm.
- Pβc Cover Basalt
- Al-Alluvium
Segal et al. (2013)
- Fig. 26 Streams and springs
around Hippos Sussita from Segal et al. (2013)
Fig. 26
Geographical settings of the Sussita region. For transect T-T' see fig. 32 below.
Segal et al. (2013) - Fig. 28 Geologic Map of
Hippos Sussita from Segal et al. (2013)
Fig. 28
Geological map of the Sussita region and main rock formations (Fm.); modified after a Geological Survey, 2008.
- Emr- Eocene Maresha Fm.
- Of- Fiq Fm.
- Os- Sussita Fm.
- Me- En Gev Fm.
- Mh- Hordos Fm.
- Mβl- Lower Basalt Fm.
- Mbi- Bira Fm.
- Pg- Gesher Fm.
- Pβc Cover Basalt
- Al-Alluvium
Segal et al. (2013)
- Annotated Aerial View of
Hippos Sussita from Segal et al. (2013)
 Annotated Aerial View of Hippos Sussita
Segal et al. (2013) - Hippos-Sussita in Google Earth
 Hippos-Sussita
click on image to explore this site on a new tab in Google Earth - Hippos-Sussita on govmap.gov.il
 Hippos-Sussita
click on image to explore this site on a new tab in govmap.gov.il
- Annotated Aerial View of
Hippos Sussita from Segal et al. (2013)
Annotated Aerial View of Hippos Sussita
Segal et al. (2013)
- Plan of Hippos-Sussita
from BibleWalks.com
- Plan of Hippos-Sussita
from Stern et. al. (2008)
 Hippos: plan of the site.
Stern et. al. (2008) - Fig. 3 - Plan of Hippos-Sussita
with excavation areas from Eisenberg and Osband (2022)
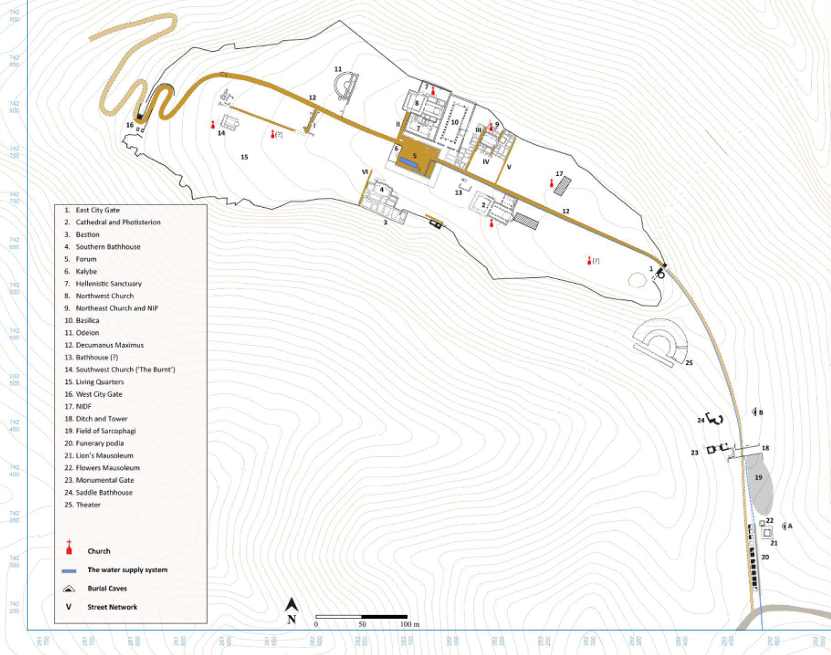 Figure 3
Hippos, a plan with main building complexes and excavation areas
(M. Eisenberg and I. Nakas)
Eisenberg and Osband (2022) - Fig. 1 - Plan of Hippos-Sussita
with excavation areas from Kowalewska and Eisenberg (2021)
 Figure 1
Plan of the site showing the main excavated areas.
Kowalewska and Eisenberg (2021) - Fig. 150 Illustration of
a suggested artistic reconstruction of the Hippos Sussita during the Roman period from Segal et al. (2013)
 Fig. 150
Hippos, a suggested artistic reconstruction of the city during the Roman period and the ancient road leading to the Sussita saddle ridge.
Segal et al. (2013)

- Plan of Hippos-Sussita
from BibleWalks.com
- Plan of Hippos-Sussita
from Stern et. al. (2008)
Hippos: plan of the site.
Stern et. al. (2008) - Fig. 3 - Plan of Hippos-Sussita
with excavation areas from Eisenberg and Osband (2022)
Figure 3
Hippos, a plan with main building complexes and excavation areas
(M. Eisenberg and I. Nakas)
Eisenberg and Osband (2022) - Fig. 1 - Plan of Hippos-Sussita
with excavation areas from Kowalewska and Eisenberg (2021)
Figure 1
Plan of the site showing the main excavated areas.
Kowalewska and Eisenberg (2021) - Fig. 150 Illustration of
a suggested artistic reconstruction of the Hippos Sussita during the Roman period from Segal et al. (2013)
Fig. 150
Hippos, a suggested artistic reconstruction of the city during the Roman period and the ancient road leading to the Sussita saddle ridge.
Segal et al. (2013)
- Aerial Photo and plan
of central Hippos from Stern et. al. (2008)
 Hippos: aerial photograph and plan of the site
Stern et. al. (2008) - Plan of the Forum,
Hellenistic compound, and Northwest Church from Segal and Eisenberg (2007)
 Plan of the Forum. Hellenistic compound, and Northwest Church
Segal and Eisenberg (2007) - Fig. 9.7 Aerial View
of northern part of the Hellenistic Compound and the North-West Church from Eisenberg and Kowalewska (2025)
 Fig. 9.7
A vertical view towards the northern part of the Hellenistic Compound and the North-West Church built in its centre.
- W — wine production
- B — bread production/cooking
- 0 — olive oil production
(M. Eisenberg).
Click on image to open in a new tab
Eisenberg and Kowalewska (2025) - Fig. 9 - Aerial View
of the Cathedral from Kowalewska and Eisenberg (2021)
 Figure 9
The Cathedral at the end of the 2021 excavation, aerial view from 3D model.
Kowalewska and Eisenberg (2021) - Fig. 3 - Aerial Photo
of Hippos City Center from Eisenberg (2021)
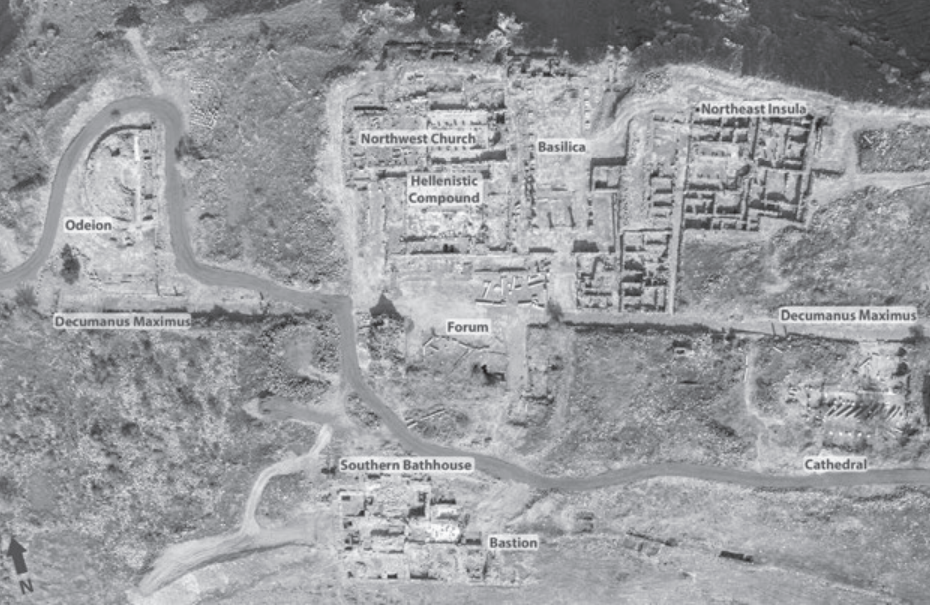 Figure 3
VERTICAL AERIAL PHOTOGRAPH OF HIPPOS CITY CENTER
(M. EISENBERG)
Eisenberg (2021) - Fig. 4 - Aerial Photo
of the Basilica and environs from Eisenberg (2021)
 Figure 4
VERTICAL AERIAL OF THE BASILICA AND ITS ENVIRONS
(M. EISENBERG)
Eisenberg (2021)
- Aerial Photo and plan
of central Hippos from Stern et. al. (2008)
Hippos: aerial photograph and plan of the site
Stern et. al. (2008) - Plan of the Forum,
Hellenistic compound, and Northwest Church from Segal and Eisenberg (2007)
Plan of the Forum. Hellenistic compound, and Northwest Church
Segal and Eisenberg (2007) - Fig. 9.7 Aerial View
of northern part of the Hellenistic Compound and the North-West Church from Eisenberg and Kowalewska (2025)
Fig. 9.7
A vertical view towards the northern part of the Hellenistic Compound and the North-West Church built in its centre.
- W — wine production
- B — bread production/cooking
- 0 — olive oil production
(M. Eisenberg).
Click on image to open in a new tab
Eisenberg and Kowalewska (2025) - Fig. 9 - Aerial View
of the Cathedral from Kowalewska and Eisenberg (2021)
Figure 9
The Cathedral at the end of the 2021 excavation, aerial view from 3D model.
Kowalewska and Eisenberg (2021) - Fig. 3 - Aerial Photo
of Hippos City Center from Eisenberg (2021)
Figure 3
VERTICAL AERIAL PHOTOGRAPH OF HIPPOS CITY CENTER
(M. EISENBERG)
Eisenberg (2021) - Fig. 4 - Aerial Photo
of the Basilica and environs from Eisenberg (2021)
Figure 4
VERTICAL AERIAL OF THE BASILICA AND ITS ENVIRONS
(M. EISENBERG)
Eisenberg (2021)
- Plan of Northeast Church
from Stern et. al. (2008)
 Northeast church
Stern et. al. (2008) - Fig. 26 - Plan of the northeast Church
from Segal et al (2004)
 Figure 26
Hippos, North-East Church, schematic plan showing walls and loci
Segal et al (2004)
- Plan of Northeast
Church from Stern et. al. (2008)
Northeast church
Stern et. al. (2008) - Fig. 26 - Plan of
the northeast Church from Segal et al (2004)
Figure 26
Hippos, North-East Church, schematic plan showing walls and loci
Segal et al (2004)
- Fig. 255 Aerial View of
the Northwest Church Complex from Segal et al. (2013)
 Fig. 255
Northwest Church Complex. Aerial view.
Segal et al. (2013) - Fig. 256 General plan of
the Northwest Church Complex with numbers of loci and walls from Segal et al. (2013)
 Fig. 256
General plan of the Northwest Church Complex with numbers of loci and walls mentioned in the text.
Segal et al. (2013) - Fig. 16 - Plan of the
northwest Church from Segal et al (2004)
 Figure 16
plan of of the North-West Church (2000-2004)
Segal et al (2004)
- Fig. 255 Aerial View of
the Northwest Church Complex from Segal et al. (2013)
Fig. 255
Northwest Church Complex. Aerial view.
Segal et al. (2013) - Fig. 256 General plan of
the Northwest Church Complex with numbers of loci and walls from Segal et al. (2013)
Fig. 256
General plan of the Northwest Church Complex with numbers of loci and walls mentioned in the text.
Segal et al. (2013) - Fig. 16 - Plan of the
northwest Church from Segal et al (2004)
Figure 16
plan of of the North-West Church (2000-2004)
Segal et al (2004)
- Fig. 3 - Aerial Photo
of Hippos City Center from Eisenberg (2021)
Figure 3
VERTICAL AERIAL PHOTOGRAPH OF HIPPOS CITY CENTER
(M. EISENBERG)
Eisenberg (2021) - Fig. 4 - Aerial Photo
of the Basilica and environs from Eisenberg (2021)
Figure 4
VERTICAL AERIAL OF THE BASILICA AND ITS ENVIRONS
(M. EISENBERG)
Eisenberg (2021) - Fig. 5 - Plan of the
Basilica and environs from Eisenberg (2021)
 Figure 5
THE BASILICA
- A PLAN WITH BUILDING PHASES
- A SCHEMATIC PLAN
(Y. NAKAS AND M. EISENBERG)
Eisenberg (2021) - Fig. 6 - Aerial Photo
of the Basilica towards the SW from Eisenberg (2021)
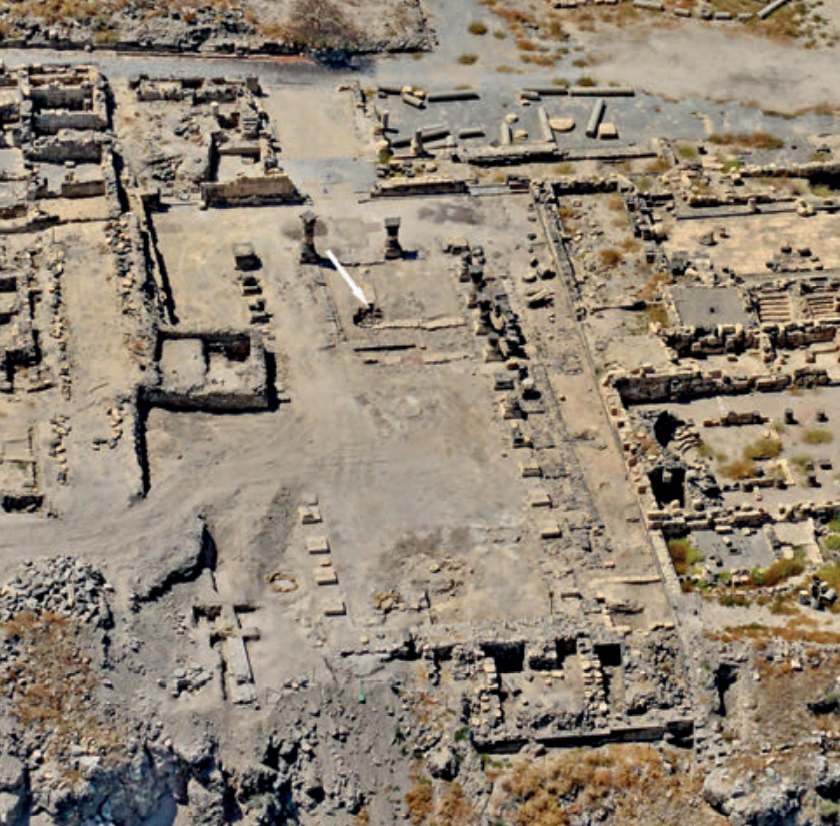 Figure 6
THE BASILICA, AN AERIAL PHOTOGRAPH TOWARDS SOUTHWEST. THE ARROW IS MARKING THE CAVITY IN THE BASALT BEDROCK
(M. EISENBERG)
Eisenberg (2021) - Fig. 7 - Southern part
of the Basilica from Eisenberg (2021)
 Figure 7
THE SOUTHERN PART OF THE BASILICA. NOTE THE PREBASILICA STYLOBATE FOUNDATION ON THE BOTTOM AND NARI AND BASALT WALLS IN THE CENTER. A VERTICAL AERIAL PHOTOGRAPH
(M. EISENBERG)
Eisenberg (2021) - Fig. 18 - Suggested Reconstruction
of the Basilica from Eisenberg (2021)
 Figure 18
HIPPOS’ BASILICA SUGGESTED RECONSTRUCTIONS:
- SECTION OF THE NORTHERN SIDE
- LENGTH SECTION
- SIDE VIEW OF THE SOUTHERN FACADE
(Y. NAKAS)
Eisenberg (2021) - Fig. 19 - Suggested Reconstruction
of the Basilica from Eisenberg (2021)
 Figure 19
HIPPOS’ BASILICA, A SUGGESTED RECONSTRUCTION. VIEW TOWARDS NORTHEAST
(Y. NAKAS)
Eisenberg (2021) - Fig. 20 - Suggested Reconstruction
of the interior of the Basilica from Eisenberg (2021)
 Figure 20
HIPPOS’ BASILICA, A SUGGESTED RECONSTRUCTION OF THE INTERIOR. VIEW TOWARDS NORTH
(Y. NAKAS)
Eisenberg (2021)
- Fig. 3 - Aerial Photo
of Hippos City Center from Eisenberg (2021)
Figure 3
VERTICAL AERIAL PHOTOGRAPH OF HIPPOS CITY CENTER
(M. EISENBERG)
Eisenberg (2021) - Fig. 4 - Aerial Photo
of the Basilica and environs from Eisenberg (2021)
Figure 4
VERTICAL AERIAL OF THE BASILICA AND ITS ENVIRONS
(M. EISENBERG)
Eisenberg (2021) - Fig. 5 - Plan of the
Basilica and environs from Eisenberg (2021)
Figure 5
THE BASILICA
- A PLAN WITH BUILDING PHASES
- A SCHEMATIC PLAN
(Y. NAKAS AND M. EISENBERG)
Eisenberg (2021) - Fig. 6 - Aerial Photo
of the Basilica towards the SW from Eisenberg (2021)
Figure 6
THE BASILICA, AN AERIAL PHOTOGRAPH TOWARDS SOUTHWEST. THE ARROW IS MARKING THE CAVITY IN THE BASALT BEDROCK
(M. EISENBERG)
Eisenberg (2021) - Fig. 7 - Southern part
of the Basilica from Eisenberg (2021)
Figure 7
THE SOUTHERN PART OF THE BASILICA. NOTE THE PREBASILICA STYLOBATE FOUNDATION ON THE BOTTOM AND NARI AND BASALT WALLS IN THE CENTER. A VERTICAL AERIAL PHOTOGRAPH
(M. EISENBERG)
Eisenberg (2021)
- Fig. 1 - Annotated Aerial
View of Hippos-Sussita necropoleis from Eisenberg and Kowalewska (2024)
 Figure 1
Mt. Sussita and its environs with the three necropoleis and the Saddle Necropolis monuments indicated:
- funerary podia
- Lion’s Mausoleum
- Flowers Mausoleum
- Burial Cave A
- sarcophagi field
- ditch
- Burial Cave B
drone view towards north (photo M. Eisenberg)
Eisenberg and Kowalewska (2024) - Fig. 2 - Aerial View
of Lion’s Mausoleum and the Flowers Mausoleum from Eisenberg and Kowalewska (2024)
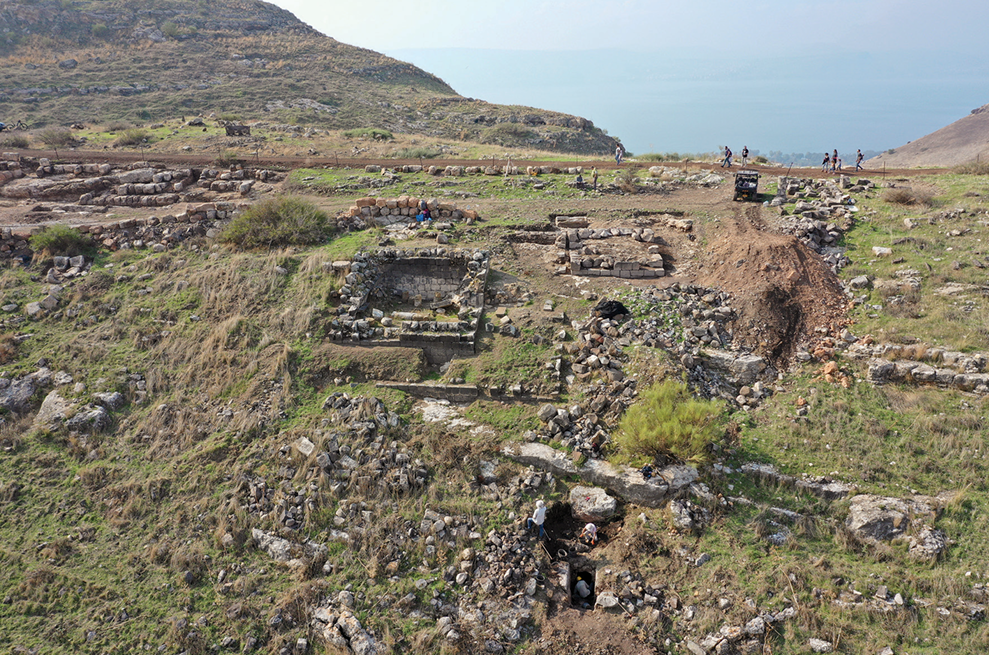 Figure 2
Drone’s view towards west looking at the Lion’s Mausoleum (left), the Flowers Mausoleum (right), and Burial Cave A beneath them (photo M. Eisenberg)
Eisenberg and Kowalewska (2024) - Fig. 3 - Aerial View
of Flowers Mausoleum and perimeter wall of the Lion’s Mausoleum from Eisenberg and Kowalewska (2024)
 Figure 3
The Flowers Mausoleum and the perimeter wall of the Lion’s Mausoleum at the end of excavations; vertical view from the photogrammetric model (photo and modeling M. Eisenberg)
Eisenberg and Kowalewska (2024) - Fig. 5 - architectural fragments
of the Flowers Mausoleum from Eisenberg and Kowalewska (2024)
 Figure 5
The Flowers Mausoleum northern wall and architectural fragments at its foot during excavations; view towards east (photo M. Eisenberg)
Eisenberg and Kowalewska (2024) - Fig. 8 - Artist's reconstruction
of the funerary monuments along the main road in the Saddle Necropolis from Eisenberg and Kowalewska (2024)
 Figure 8
An artistic reconstruction of the funerary monuments along the main road in the Saddle Necropolis with the funerary podia series and the two mausolea (Y. Nakas and M. Eisenberg)
Eisenberg and Kowalewska (2024)
- Fig. 1 - Annotated Aerial
View of Hippos-Sussita necropoleis from Eisenberg and Kowalewska (2024)
Figure 1
Mt. Sussita and its environs with the three necropoleis and the Saddle Necropolis monuments indicated:
- funerary podia
- Lion’s Mausoleum
- Flowers Mausoleum
- Burial Cave A
- sarcophagi field
- ditch
- Burial Cave B
drone view towards north (photo M. Eisenberg)
Eisenberg and Kowalewska (2024) - Fig. 2 - Aerial View
of Lion’s Mausoleum and the Flowers Mausoleum from Eisenberg and Kowalewska (2024)
Figure 2
Drone’s view towards west looking at the Lion’s Mausoleum (left), the Flowers Mausoleum (right), and Burial Cave A beneath them (photo M. Eisenberg)
Eisenberg and Kowalewska (2024) - Fig. 3 - Aerial View
of Flowers Mausoleum and perimeter wall of the Lion’s Mausoleum from Eisenberg and Kowalewska (2024)
Figure 3
The Flowers Mausoleum and the perimeter wall of the Lion’s Mausoleum at the end of excavations; vertical view from the photogrammetric model (photo and modeling M. Eisenberg)
Eisenberg and Kowalewska (2024) - Fig. 5 - architectural fragments
of the Flowers Mausoleum from Eisenberg and Kowalewska (2024)
Figure 5
The Flowers Mausoleum northern wall and architectural fragments at its foot during excavations; view towards east (photo M. Eisenberg)
Eisenberg and Kowalewska (2024) - Fig. 8 - Artist's reconstruction
of the funerary monuments along the main road in the Saddle Necropolis from Eisenberg and Kowalewska (2024)
Figure 8
An artistic reconstruction of the funerary monuments along the main road in the Saddle Necropolis with the funerary podia series and the two mausolea (Y. Nakas and M. Eisenberg)
Eisenberg and Kowalewska (2024)
- Fig. 2 - Vertical view of
Hippos cathedral from Eisenberg and Kowalewska (2026)
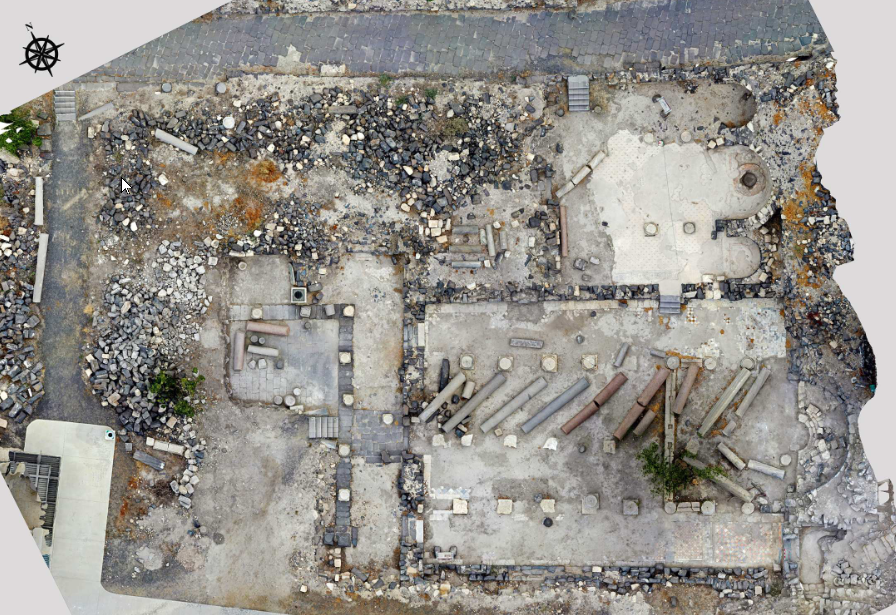 Figure 2
Vertical view of Hippos cathedral. Extracted from a photogrammetric model (07/2025; M. Eisenberg)
click on image to open in a new tab
Eisenberg and Kowalewska (2026) - Fig. 3 - Plan of Hippos
cathedral from Eisenberg and Kowalewska (2026)
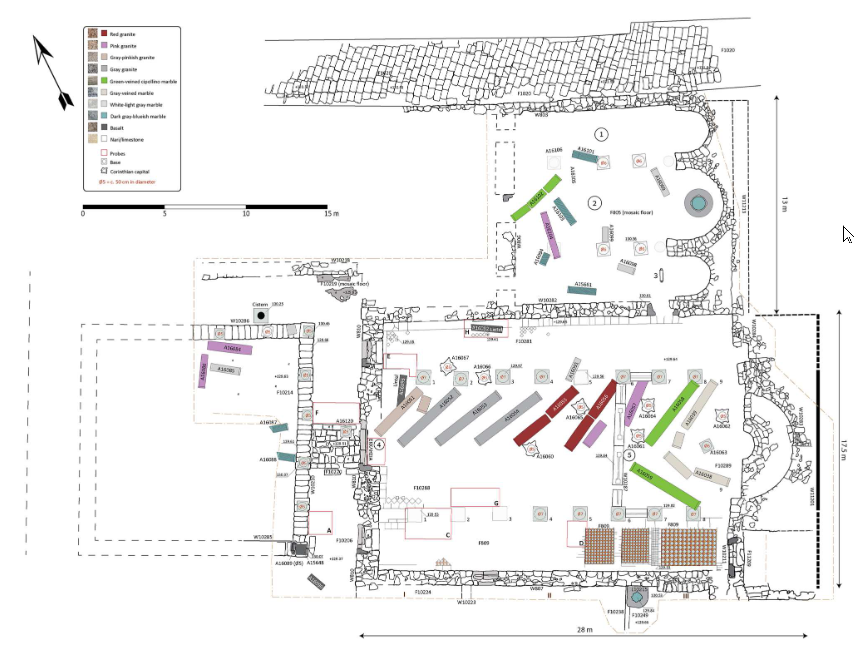 Figure 3
Hippos cathedral, a plan (M. Eisenberg)
click on image to open in a new tab
Eisenberg and Kowalewska (2026) - Fig. 4 - Schematic Plan of Hippos
cathedral from Eisenberg and Kowalewska (2026)
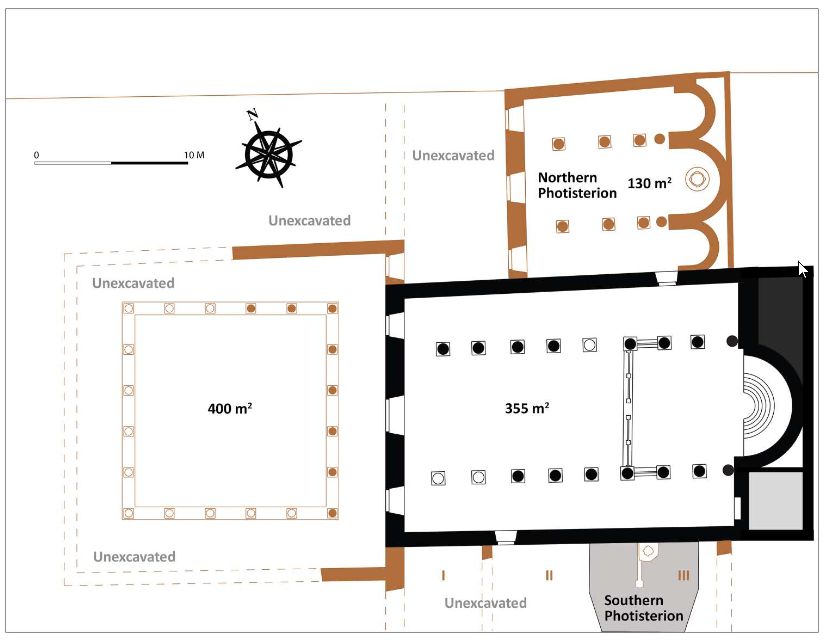 Figure 4
Hippos cathedral, a schematic plan (Y. Nakas and M. Eisenberg).
click on image to open in a new tab
Eisenberg and Kowalewska (2026)
- Fig. 2 - Vertical view of
Hippos cathedral from Eisenberg and Kowalewska (2026)
Figure 2
Vertical view of Hippos cathedral. Extracted from a photogrammetric model (07/2025; M. Eisenberg)
click on image to open in a new tab
Eisenberg and Kowalewska (2026) - Fig. 3 - Plan of Hippos
cathedral from Eisenberg and Kowalewska (2026)
Figure 3
Hippos cathedral, a plan (M. Eisenberg)
click on image to open in a new tab
Eisenberg and Kowalewska (2026) - Fig. 4 - Schematic Plan of Hippos
cathedral from Eisenberg and Kowalewska (2026)
Figure 4
Hippos cathedral, a schematic plan (Y. Nakas and M. Eisenberg).
click on image to open in a new tab
Eisenberg and Kowalewska (2026)
- Fig. 4 - Column drums
in Basilica in original position after 363 CE Quake from Eisenberg and Osband (2022)
 Figure 4
The southeastern side of the Basilica at Hippos. Some of the columns are partly reconstructed, while the drums in the eastern aisle rest in their original position following the 363 CE earthquake. Looking south.
(M. Eisenberg)
Eisenberg and Osband (2022) - Fig. 6 - Southern part
of southern bathhouse from Eisenberg and Osband (2022)
 Figure 6
Hippos, the southern part of the Southern Bathhouse. On the left is the cold room (frigidarium) and a pool, and to its right a furnace room (praefurnium) that was covered by several meters high refuse dump that does not postdate the late 3rd century CE.
(M. Eisenberg)
Eisenberg and Osband (2022) - Fig. 7 - Saddle Propylaeum
from Eisenberg and Osband (2022)
 Figure 7
Hippos, the Saddle Propylaeum looking northwest. The staircase and the reused pavement (0.51 m above the original gate pavement) were built after the 363 CE earthquake.
(M. Eisenberg)
Eisenberg and Osband (2022) - Fig. 5 - architectural fragments
of the Flowers Mausoleum from Eisenberg and Kowalewska (2024)
Figure 5
The Flowers Mausoleum northern wall and architectural fragments at its foot during excavations; view towards east (photo M. Eisenberg)
Eisenberg and Kowalewska (2024) - Fig. 267 Collapsed Mosaic
floor in the Northwest Church from Segal et al. (2013)
 Fig. 267
Mosaic floor of the gallery [of the Northwest Church] as collapsed on the floor of the southern aisle, at its eastern end.
Segal et al. (2013) - Fig. 281 Mosaic repairs
in the Northwest Church which may have been a response to seismic damage from Segal et al. (2013)
 Fig. 281
The mosaic under the arched entrance to the southern pastophorion (the martyrion chapel) with evidence of repairs.
Segal et al. (2013) - Fig. 9.6 Collapsed Columns
of the northern portico of the forum from Eisenberg and Kowalewska (2025). Collapse ocurred in the mid-8th century CE.
 Fig. 9.6
The northern portico of the forum with monolithic column shafts (toppled in AD 749) lying on the forum pavers, with the kalybe temple and Sea of Galilee in the far west (M. Eisenberg) JW: Columns not in original post quake position - see Eisenberg and Kowalewska (2025:n. 26)
Click on image to open in a new tab
Eisenberg and Kowalewska (2025) - Fig. 9.9 Umayyad-period
structure in the eastern part of the basilica arce from Eisenberg and Kowalewska (2025)
 Fig. 9.9
The Umayyad-period structure in the eastern part of the basilica arce. View towards the south. Note the secondary use of the civic basilica architectural fragments at the corner foundations reaching the civic basilica floor level (M. Eisenberg)
Click on image to open in a new tab
Eisenberg and Kowalewska (2025) - Fig. 9.12 Collapsed Columns
of the Cathedral from Eisenberg and Kowalewska (2025)
 Fig. 9.12
A vertical extract from a photogrammetric model of the cathedral (M. Eisenberg)
Click on image to open in a new tab
Eisenberg and Kowalewska (2025) - Fig. 9.15 Blocked Doorway
at the Northeast Insula from Eisenberg and Kowalewska (2025)
 Fig. 9.15
One of the doorways at the Northeast Insula blocked prior to AD 749. View towards the south-west (M. Eisenberg)
Click on image to open in a new tab
Eisenberg and Kowalewska (2025) - Fig. 9 - Earthquake Debris
from 749 CE from Eisenberg and Kowalewska (2026)
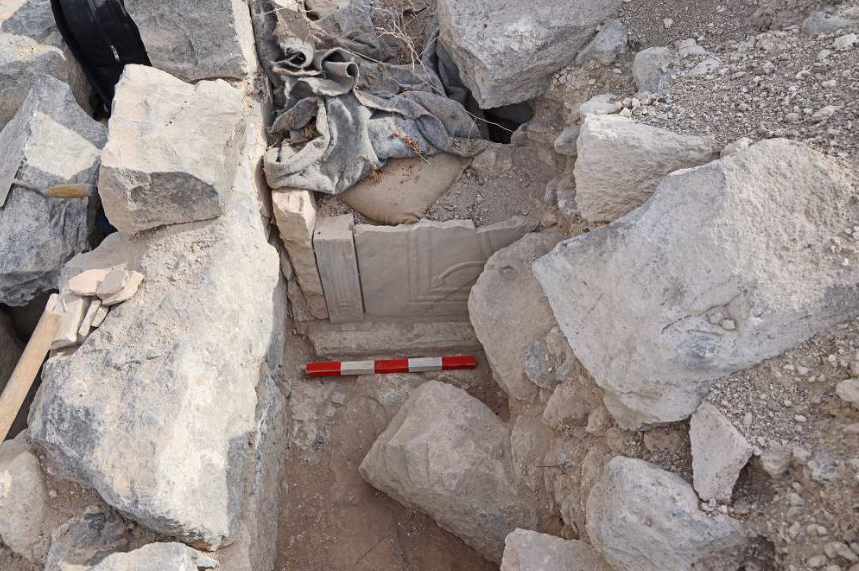 Figure 9
The chancel screen of the southern photisterion during excavations, buried under the 749 CE earthquake collapse, looking east (M. Eisenberg).
click on image to open in a new tab
Eisenberg and Kowalewska (2026)
- Fig. 4 - Column drums
in Basilica in original position after 363 CE Quake from Eisenberg and Osband (2022)
Figure 4
The southeastern side of the Basilica at Hippos. Some of the columns are partly reconstructed, while the drums in the eastern aisle rest in their original position following the 363 CE earthquake. Looking south.
(M. Eisenberg)
Eisenberg and Osband (2022) - Fig. 6 - Southern part
of southern bathhouse from Eisenberg and Osband (2022)
Figure 6
Hippos, the southern part of the Southern Bathhouse. On the left is the cold room (frigidarium) and a pool, and to its right a furnace room (praefurnium) that was covered by several meters high refuse dump that does not postdate the late 3rd century CE.
(M. Eisenberg)
Eisenberg and Osband (2022) - Fig. 7 - Saddle Propylaeum
from Eisenberg and Osband (2022)
Figure 7
Hippos, the Saddle Propylaeum looking northwest. The staircase and the reused pavement (0.51 m above the original gate pavement) were built after the 363 CE earthquake.
(M. Eisenberg)
Eisenberg and Osband (2022) - Fig. 5 - architectural fragments
of the Flowers Mausoleum from Eisenberg and Kowalewska (2024)
Figure 5
The Flowers Mausoleum northern wall and architectural fragments at its foot during excavations; view towards east (photo M. Eisenberg)
Eisenberg and Kowalewska (2024) - Fig. 267 Collapsed Mosaic
floor in the Northwest Church from Segal et al. (2013)
Fig. 267
Mosaic floor of the gallery [of the Northwest Church] as collapsed on the floor of the southern aisle, at its eastern end.
Segal et al. (2013) - Fig. 281 Mosaic repairs
in the Northwest Church which may have been a response to seismic damage from Segal et al. (2013)
Fig. 281
The mosaic under the arched entrance to the southern pastophorion (the martyrion chapel) with evidence of repairs.
Segal et al. (2013) - Fig. 9.6 Collapsed Columns
of the northern portico of the forum from Eisenberg and Kowalewska (2025). Collapse ocurred in the mid-8th century CE.
Fig. 9.6
The northern portico of the forum with monolithic column shafts (toppled in AD 749) lying on the forum pavers, with the kalybe temple and Sea of Galilee in the far west (M. Eisenberg) JW: Columns not in original post quake position - see Eisenberg and Kowalewska (2025:n. 26).
Click on image to open in a new tab
Eisenberg and Kowalewska (2025) - Fig. 9.9 Umayyad-period
structure in the eastern part of the basilica arce from Eisenberg and Kowalewska (2025)
Fig. 9.9
The Umayyad-period structure in the eastern part of the basilica arce. View towards the south. Note the secondary use of the civic basilica architectural fragments at the corner foundations reaching the civic basilica floor level (M. Eisenberg)
Click on image to open in a new tab
Eisenberg and Kowalewska (2025) - Fig. 9.12 Collapsed Columns
of the Cathedral from Eisenberg and Kowalewska (2025)
Fig. 9.12
A vertical extract from a photogrammetric model of the cathedral (M. Eisenberg)
Click on image to open in a new tab
Eisenberg and Kowalewska (2025) - Fig. 9.15 Blocked Doorway
at the Northeast Insula from Eisenberg and Kowalewska (2025)
Fig. 9.15
One of the doorways at the Northeast Insula blocked prior to AD 749. View towards the south-west (M. Eisenberg)
Click on image to open in a new tab
Eisenberg and Kowalewska (2025) - Fig. 9 - Earthquake Debris
from 749 CE from Eisenberg and Kowalewska (2026)
Figure 9
The chancel screen of the southern photisterion during excavations, buried under the 749 CE earthquake collapse, looking east (M. Eisenberg).
click on image to open in a new tab
Eisenberg and Kowalewska (2026)
- Fig. 1 - Plan of Hippos-Sussita
with excavation areas from Kowalewska and Eisenberg (2021)
Figure 1
Plan of the site showing the main excavated areas.
Kowalewska and Eisenberg (2021) - Fig. 5 - Plan of the
Basilica and environs from Eisenberg (2021)
Figure 5
THE BASILICA
- A PLAN WITH BUILDING PHASES
- A SCHEMATIC PLAN
(Y. NAKAS AND M. EISENBERG)
Eisenberg (2021) - Fig. 5 - Plan of the
Basilica and environs from Eisenberg (2021) - magnified
Figure 5
THE BASILICA
- A PLAN WITH BUILDING PHASES
- A SCHEMATIC PLAN
(Y. NAKAS AND M. EISENBERG)
Eisenberg (2021) - Fig. 6 - Aerial Photo
of the Basilica towards the SW from Eisenberg (2021)
Figure 6
THE BASILICA, AN AERIAL PHOTOGRAPH TOWARDS SOUTHWEST. THE ARROW IS MARKING THE CAVITY IN THE BASALT BEDROCK
(M. EISENBERG)
Eisenberg (2021) - Fig. 7 - Southern part
of the Basilica from Eisenberg (2021)
Figure 7
THE SOUTHERN PART OF THE BASILICA. NOTE THE PREBASILICA STYLOBATE FOUNDATION ON THE BOTTOM AND NARI AND BASALT WALLS IN THE CENTER. A VERTICAL AERIAL PHOTOGRAPH
(M. EISENBERG)
Eisenberg (2021) - Fig. 18 - Suggested Reconstruction
of the Basilica from Eisenberg (2021)
Figure 18
HIPPOS’ BASILICA SUGGESTED RECONSTRUCTIONS:
- SECTION OF THE NORTHERN SIDE
- LENGTH SECTION
- SIDE VIEW OF THE SOUTHERN FACADE
(Y. NAKAS)
Eisenberg (2021) - Fig. 19 - Suggested Reconstruction
of the Basilica from Eisenberg (2021)
Figure 19
HIPPOS’ BASILICA, A SUGGESTED RECONSTRUCTION. VIEW TOWARDS NORTHEAST
(Y. NAKAS)
Eisenberg (2021) - Fig. 20 - Suggested Reconstruction
of the interior of the Basilica from Eisenberg (2021)
Figure 20
HIPPOS’ BASILICA, A SUGGESTED RECONSTRUCTION OF THE INTERIOR. VIEW TOWARDS NORTH
(Y. NAKAS)
Eisenberg (2021)
- Fig. 1 - Annotated Aerial
View of Hippos-Sussita necropoleis from Eisenberg and Kowalewska (2024)
Figure 1
Mt. Sussita and its environs with the three necropoleis and the Saddle Necropolis monuments indicated:
- funerary podia
- Lion’s Mausoleum
- Flowers Mausoleum
- Burial Cave A
- sarcophagi field
- ditch
- Burial Cave B
drone view towards north (photo M. Eisenberg)
Eisenberg and Kowalewska (2024) - Fig. 2 - Aerial View
of Lion’s Mausoleum and the Flowers Mausoleum from Eisenberg and Kowalewska (2024)
Figure 2
Drone’s view towards west looking at the Lion’s Mausoleum (left), the Flowers Mausoleum (right), and Burial Cave A beneath them (photo M. Eisenberg)
Eisenberg and Kowalewska (2024) - Fig. 3 - Aerial View
of Flowers Mausoleum and perimeter wall of the Lion’s Mausoleum from Eisenberg and Kowalewska (2024)
Figure 3
The Flowers Mausoleum and the perimeter wall of the Lion’s Mausoleum at the end of excavations; vertical view from the photogrammetric model (photo and modeling M. Eisenberg)
Eisenberg and Kowalewska (2024) - Fig. 5 - architectural fragments
of the Flowers Mausoleum from Eisenberg and Kowalewska (2024)
Figure 5
The Flowers Mausoleum northern wall and architectural fragments at its foot during excavations; view towards east (photo M. Eisenberg)
Eisenberg and Kowalewska (2024) - Fig. 8 - Artist's reconstruction
of the funerary monuments along the main road in the Saddle Necropolis from Eisenberg and Kowalewska (2024)
Figure 8
An artistic reconstruction of the funerary monuments along the main road in the Saddle Necropolis with the funerary podia series and the two mausolea (Y. Nakas and M. Eisenberg)
Eisenberg and Kowalewska (2024)
- Plan of Hippos-Sussita
from BibleWalks.com
- Fig. 16 - Plan of the northwest Church
from Segal et al (2004)
Figure 16
plan of of the North-West Church (2000-2004)
Segal et al (2004) - Fig. 9 - Aerial View of the Cathedral
from Kowalewska and Eisenberg (2021)
Figure 9
The Cathedral at the end of the 2021 excavation, aerial view from 3D model.
Kowalewska and Eisenberg (2021)
| Effect | Location | Image(s) | Description |
|---|---|---|---|
| Collapsed Walls and re-used building elements |
Basilica
Figure 5 THE BASILICA
(Y. NAKAS AND M. EISENBERG) Eisenberg (2021) |
|
|
| Collapsed Roof | Northern part of the nave of the Basilica
Figure 5 THE BASILICA
(Y. NAKAS AND M. EISENBERG) Eisenberg (2021) |
The sole evidence for a sudden disaster is the find of parts of skeletons of at least four humans that were buried under the collapsed roof in the northern part of the nave. Two of the almost intact skeletons belonged to an adult male and a young female. The female was found with an iron nail (most probably from the roof ) stuck in her knee bones and a dove-shaped pendant resting between her neck bones.- Eisenberg (2021:171-173) |
|
| Human Remains | Northern part of the nave of the Basilica
Figure 5 THE BASILICA
(Y. NAKAS AND M. EISENBERG) Eisenberg (2021) |
The sole evidence for a sudden disaster is the find of parts of skeletons of at least four humans that were buried under the collapsed roof in the northern part of the nave. Two of the almost intact skeletons belonged to an adult male and a young female. The female was found with an iron nail (most probably from the roof ) stuck in her knee bones and a dove-shaped pendant resting between her neck bones.- Eisenberg (2021:171-173) |
|
| Foundation Damage | Saddle Necroplis (Lion and Flower Mausoleum)
Figure 1 Mt. Sussita and its environs with the three necropoleis and the Saddle Necropolis monuments indicated:
drone view towards north (photo M. Eisenberg) Eisenberg and Kowalewska (2024)
Figure 2Drone’s view towards west looking at the Lion’s Mausoleum (left), the Flowers Mausoleum (right), and Burial Cave A beneath them (photo M. Eisenberg) Eisenberg and Kowalewska (2024)
Figure 8An artistic reconstruction of the funerary monuments along the main road in the Saddle Necropolis with the funerary podia series and the two mausolea (Y. Nakas and M. Eisenberg) Eisenberg and Kowalewska (2024) |
Figure 5 The Flowers Mausoleum northern wall and architectural fragments at its foot during excavations; view towards east (photo M. Eisenberg) Eisenberg and Kowalewska (2024) |
|
| Collapsed colonnade? | Forum |
The devastating earthquake that occurred in the region in 363 CE did not spare the forum. It may be assumed that the colonnades collapsed and as a result, some of the stylobates were also dismantled.- Segal et al. (2013:160) |
|
|
the propylaeum, and the theatre of the Saddle Compound |
|
|
|
the hypocausta of the Southern Bathhouse
Figure 1 Plan of the site showing the main excavated areas. Kowalewska and Eisenberg (2021) |
|
|
|
Odeion |
|
|
|
Roman temple in the Hellenistic Compound |
|
|
|
porticoes of the colonnaded decumanus maximus |
|
| Effect | Location | Image(s) | Description |
|---|---|---|---|
|
Nave of the Northwest Church
Fig. 256 General plan of the Northwest Church Complex with numbers of loci and walls mentioned in the text. Segal et al. (2013) |
Fig. 281
Fig. 281 The mosaic under the arched entrance to the southern pastophorion (the martyrion chapel) with evidence of repairs. Segal et al. (2013) |
The final phase of the church (Phase III) was the decline of the basilica which must have been the result of some unspecified disaster of an unknown date but which clearly caused serious damage to the nave; it was probably one of the earthquakes which affected this region in the second half of the 7th century (658 CE) or at the beginning of the 8th century (717 CE). Indeed, eloquent testimony to the ancient repairs made to the mosaic floor can be seen at the southern pastophorion. Right under the arched entrance to this room, the mosaic bears traces of repairs carried out after it was damaged, probably during an earthquake (fig. 281).- Segal et al. (2013:210) |
| Effect | Location | Image(s) | Description |
|---|---|---|---|
| Tilted and displaced walls (tilted and displaced to the west) |
Wall W1386 in the area east of the Hellenistic Compound (HLC 5)
Plan of the Forum. Hellenistic compound, and Northwest Church Segal and Eisenberg (2007) |
 Figure 21
Hippos 2009, area to the east of the HLC (Hellenistic Compound). Wall 1386. Note the extent of damage, most probably the results of the landslide caused by the earthquake JW: located in HLC 5 Segal et al (2019) |
|
| Collapsed walls | Cathedral |
Figure 9 The Cathedral at the end of the 2021 excavation, aerial view from 3D model. Kowalewska and Eisenberg (2021)
Figure 9
The chancel screen of the southern photisterion during excavations, buried under the 749 CE earthquake collapse, looking east (M. Eisenberg). click on image to open in a new tab Eisenberg and Kowalewska (2026) |
The atrium and the southern aisle floors were covered with collapsed building debris, composed mainly of basalt ashlars. Only the lowest ashlar courses of the building’s walls were extant, and in some places even the lowest course was tilted and pushed out of place. The eastern area of the opus sectile floor of the southern aisle was well preserved.- Kowalewska and Eisenberg (2021) |
| Collapsed Building (collapsed walls) | Umayyad-period structure was built above the middle of the basilica's eastern aisle and eastern wall |
Fig. 9.9
Fig. 9.9 The Umayyad-period structure in the eastern part of the basilica area. View towards the south. Note the secondary use of the civic basilica architectural fragments at the corner foundations reaching the civic basilica floor level (M. Eisenberg) Click on image to open in a new tab Eisenberg and Kowalewska (2025) |
|
|
Northeast
Insula and Northeast Church |
|
|
| Tilted Walls | Cathedral |
Figure 9 The Cathedral at the end of the 2021 excavation, aerial view from 3D model. Kowalewska and Eisenberg (2021) |
The atrium and the southern aisle floors were covered with collapsed building debris, composed mainly of basalt ashlars. Only the lowest ashlar courses of the building’s walls were extant, and in some places even the lowest course was tilted and pushed out of place. The eastern area of the opus sectile floor of the southern aisle was well preserved.- Kowalewska and Eisenberg (2021) |
| Displaced Walls | Cathedral |
Figure 9 The Cathedral at the end of the 2021 excavation, aerial view from 3D model. Kowalewska and Eisenberg (2021) |
The atrium and the southern aisle floors were covered with collapsed building debris, composed mainly of basalt ashlars. Only the lowest ashlar courses of the building’s walls were extant, and in some places even the lowest course was tilted and pushed out of place. The eastern area of the opus sectile floor of the southern aisle was well preserved.- Kowalewska and Eisenberg (2021) |
|
Cathedral |
Figure 9 The Cathedral at the end of the 2021 excavation, aerial view from 3D model. Kowalewska and Eisenberg (2021)  Fallen Columns in the Cathedral
Click on image to open a higher resolution magnifiable image in a new tab Photo by Jefferson Williams 17 April 2025  Fallen Columns in the Cathedral
Photo by Jefferson Williams 17 April 2025 Fig. 9.12
Fig. 9.12A vertical extract from a photogrammetric model of the cathedral (M. Eisenberg) Click on image to open in a new tab Eisenberg and Kowalewska (2025) |
|
| Fallen columns ? (? because the collapse is undated but likely due to this earthquake) |
Cathedral |
Figure 9 The Cathedral at the end of the 2021 excavation, aerial view from 3D model. Kowalewska and Eisenberg (2021)
Fallen Columns in the CathedralClick on image to open a higher resolution magnifiable image in a new tab Photo by Jefferson Williams 17 April 2025
Fallen Columns in the CathedralPhoto by Jefferson Williams 17 April 2025 |
|
| Fallen columns | Forum
Figure 3 VERTICAL AERIAL PHOTOGRAPH OF HIPPOS CITY CENTER (M. EISENBERG) Eisenberg (2021)
Plan of the Forum. Hellenistic compound, and Northwest ChurchSegal and Eisenberg (2007) Fig.9.7
Fig. 9.7A vertical view towards the northern part of the Hellenistic Compound and the North-West Church built in its centre.
(M. Eisenberg). Click on image to open in a new tab Eisenberg and Kowalewska (2025) |
Fig. 9.6
Fig. 9.6 The northern portico of the forum with monolithic column shafts (toppled in AD 749) lying on the forum pavers, with the kalybe temple and Sea of Galilee in the far west (M. Eisenberg) JW: Columns not in original post quake position - see Eisenberg and Kowalewska (2025:n. 26). Click on image to open in a new tab Eisenberg and Kowalewska (2025) |
|
|
Northwest Church
Fig. 256 General plan of the Northwest Church Complex with numbers of loci and walls mentioned in the text. Segal et al. (2013) |
|
| Effect | Location | Image(s) | Description |
|---|---|---|---|
| Tilted walls | ? |
 Figure 9
Tilted wall,Susita. In addition to the effects of construction and ground instability, the unequal load distribution of the rubble should be considered (i.e. post-destruction effects) Karcz and Kafri (1978)  Figure 10
Tilted building, Susita. Karcz and Kafri (1978) |
Tilted wall and building - Karcz and Kafri (1978) |
| Re-used Building Elements | Decumanus Maximus |
 Re-used Building Elements along Decumanus Maximus
Photo by Jefferson Williams 17 April 2025 |
Re-used Building Elements |
| Sheared Column Column Pedestal | Decumanus Maximus |
 Sheared Column Column Pedestal along Decumanus Maximus
Photo by Jefferson Williams 17 April 2025 |
Sheared Column Column Pedestal |
| Displaced and Rotated Stones | W side of Site |
 Displaced and Rotated Stones on western side of site
Photo by Jefferson Williams 17 April 2025 |
Displaced and Rotated Stones - Note: unsure how much restoration was done here |
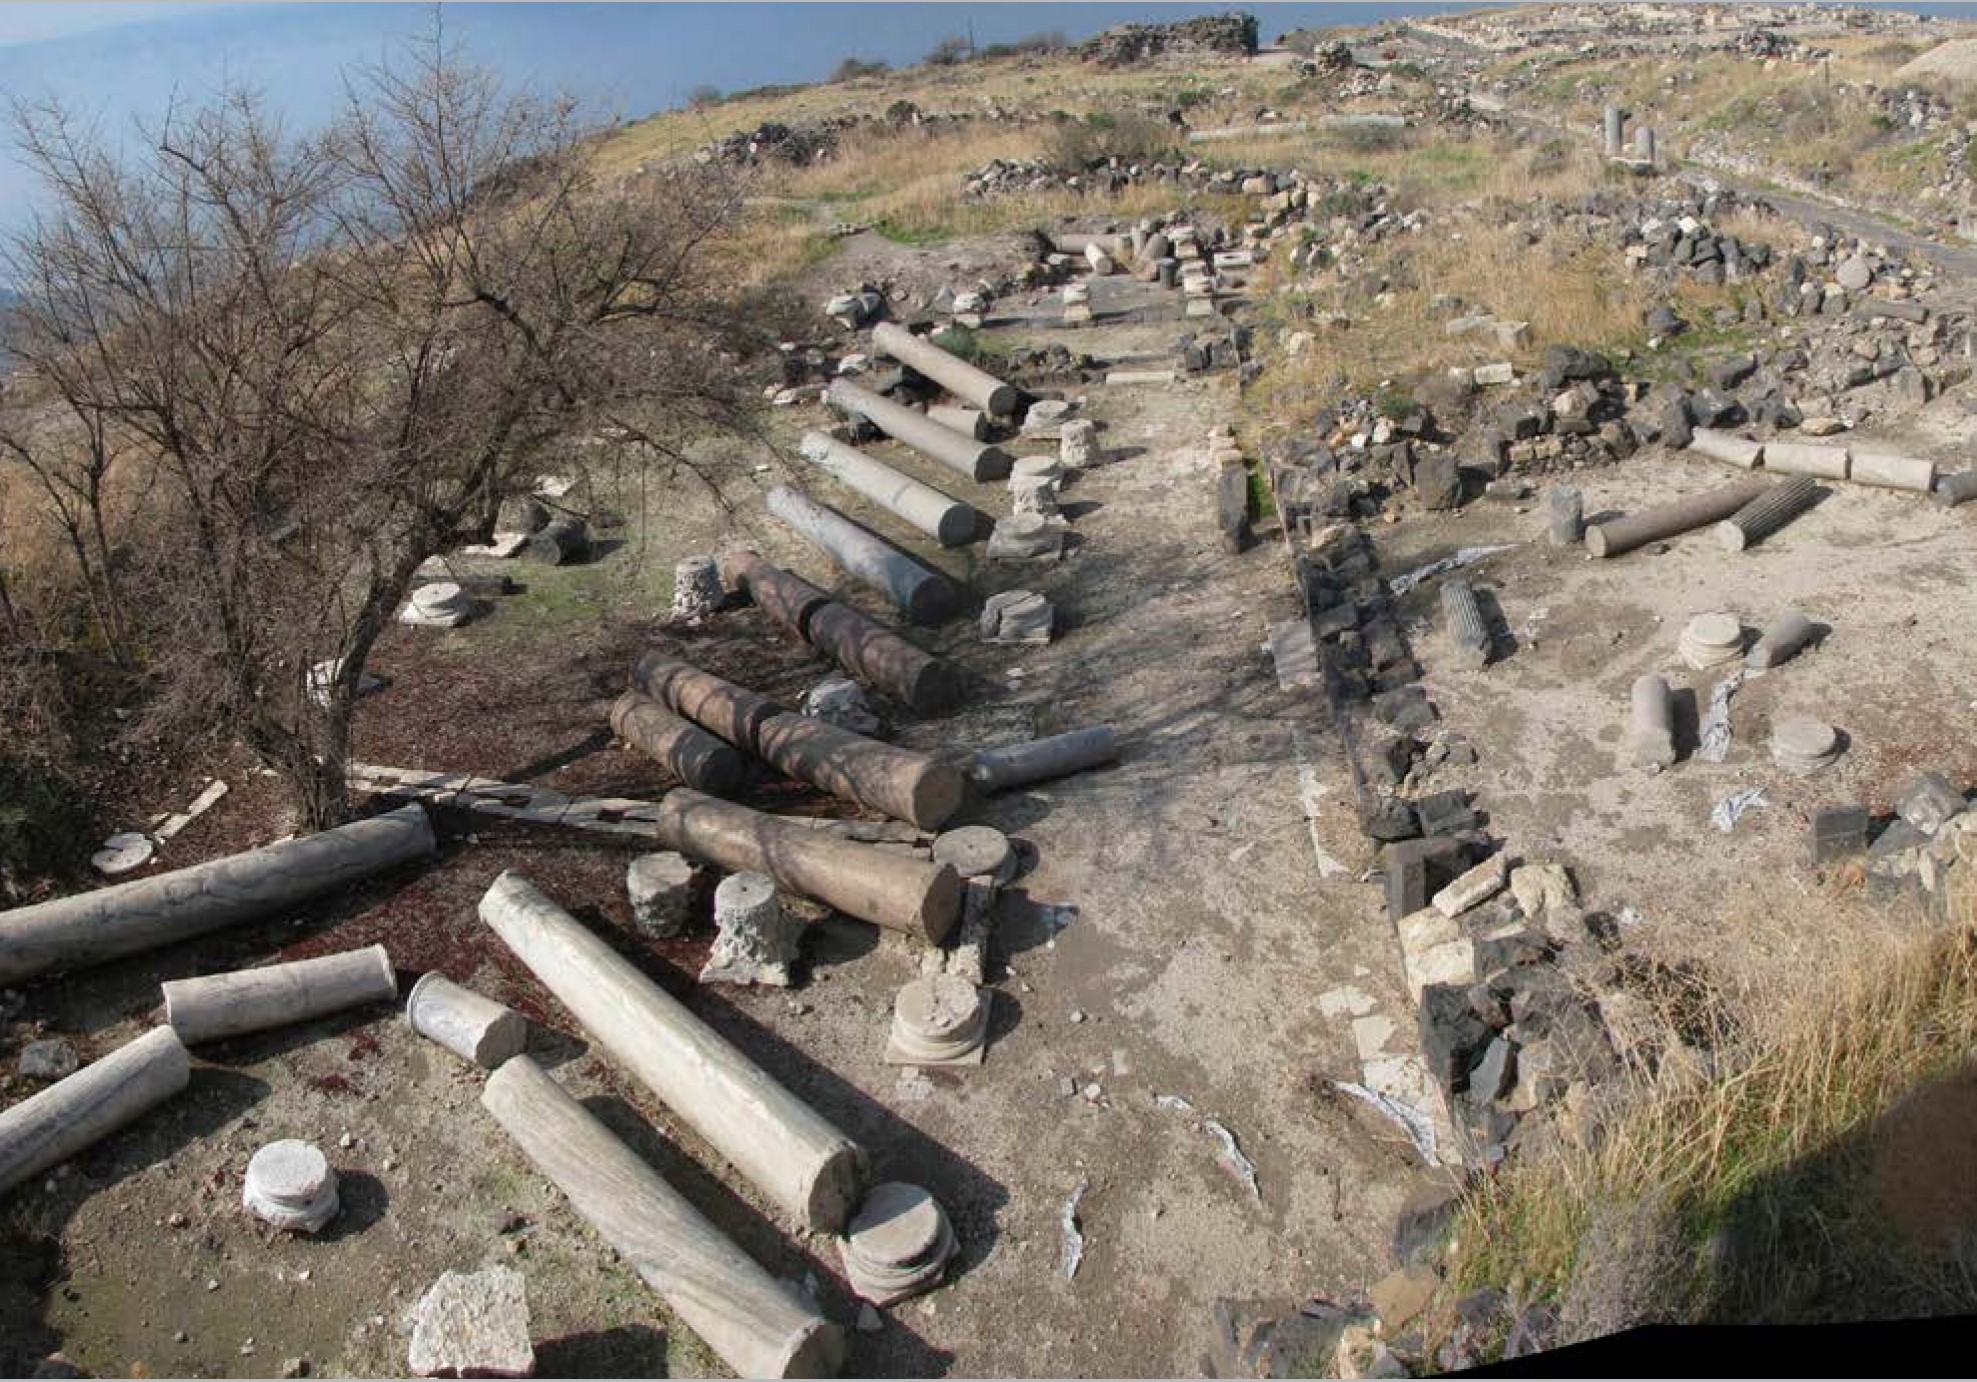 Fig. 2.3
Photo of the cathedral with the fallen columns, looking west.
Wechsler et al (2018)
- Plan of Hippos-Sussita
from BibleWalks.com
- Fig. 9 - Aerial View of the Cathedral
from Kowalewska and Eisenberg (2021)
Figure 9
The Cathedral at the end of the 2021 excavation, aerial view from 3D model.
Kowalewska and Eisenberg (2021) - Fig. 2c - DDA model for
a characteristic Hippos/Sussita column from Yagoda-Biran and Hatzor (2010)
 Figure 2 (C)
The DDA model for a characteristic Susita column.
Yagoda-Biran and Hatzor (2010) - Fig. 3 - Model Results -
PGA required to topple a column from Yagoda-Biran and Hatzor (2010)
 Figure 3
Required PGA for overturning the modeled Susita column under one (A) and three (B) input loading cycles.
- Solid triangles-stable columns
- solid diamonds—overturned columns
Yagoda-Biran and Hatzor (2010) - Fig. 2.4 - 3D laser scan
of the Cathedral from Wechsler et al (2018)
 Fig. 2.4
Perspective clear view to a 3D laser scan model of the Cathedral of Hippos with a view from the northeast.
Wechsler et al (2018)
Nine columns of the northern row of the cathedral are oriented N220°E ± 10° and two remaining columns of the southern row are oriented N295°E ± 10° (Wechsler et al, 2018).
Yagoda-Biran and Hatzor (2010) utilized a two-dimensional formulation of the discontinuous deformation analysis (DDA) method (Shi, 1993) to produce a lower bound of 0.2 - 0.4 g for Peak Horizontal Ground Acceleration (PGA) required to topple the columns. The model for their columns was free standing as shown in Figure 2c of their paper and does not include a superstructure such as an architrave or a roof indicating it is likely to produce a conservative (i.e. low) value of minimum PGA required to topple the columns. Input material values for the columns, consisting of red and gray granite possibly imported from Aswan1, were
- E = 40 GPa
- ν =0.18
- ρ = 2700 kg/m3
Recognizing the fairly wide range of threshold PGA's resulting from this analysis, Yagoda-Biran and Hatzor (2010) performed a subsequent set of simulations using strong motion records applied to the centroid of the column and base. The strong motion records came from instrumentally recorded earthquakes thought to be representative of the Dead Sea Transform2. The predominant frequencies of these strong motion records varied from 0.45 - 2.2 Hz. and produced threshold PGA's between 0.2 and 0.4 g. Although Yagoda-Biran and Hatzor (2010) did not conclude that their column analysis resulted in an estimated threshold PGA of 0.2 - 0.4 g to topple the columns, it can be reasonably assumed that this is result. However, as mentioned previously, these threshold PGA's are likely underestimated as they modeled free standing columns without a superstructure.
The Cathedral is, so far, the only structure that has been at the center of quantitative archaeoseimsic studies. Yagoda-Biran and Hatzor (2010) tried to estimate minimum levels of peak ground acceleration (PGA) during the earthquake ground motion which was necessary to topple the Cathedral columns. However, they used the model of a freestanding column of the same size as the ones found in the Cathedral, but with no capital, architrave or other superstructure. Since 2D models were used and forces were applied to the center of gravity of the columns and pedestals, the reported 0.2 - 0.4 m/s2 PGA threshold at frequencies between 0.2 and 4.4 Hz can only be regarded as a rough estimate and are not necessarily representative for the complete structure of the Cathedral which has a significantly different response to earthquake ground motions than a solitary column. Hinzen (2010) used 3D discrete element models conforming to the size of the toppled columns of the Cathedral and showed that the toppling direction during a realistic earthquake ground motion in three dimensions is a matter of chance. A column that is being rocked by earthquake ground motions is in a nonlinear dynamic system and its behavior tends to be of a chaotic character. Small changes to the initial conditions can have a strong influence on the general dynamic reaction and significantly alter the toppling direction. The same paper shows that the parallel orientation is probably an effect of the superstructure connecting the columns mechanically and not a consequence of the ground motion character. This interpretation is also strongly supported by the fact that the two remaining columns of the southern row rest at angles of ~90° compared with the columns from the northern row, as shown in a 3D laser scan model of the site (Fig. 2.4). A similar analysis of the Hippos columns was performed by Hinzen (2010)
- Modified by JW from Fig. 9 of Kowalewska and Eisenberg (2021)
 Deformation Map
Modified by JW from Fig. 9 of Kowalewska and Eisenberg (2021)
- Earthquake Archeological Effects chart
of Rodríguez-Pascua et al (2013: 221-224).
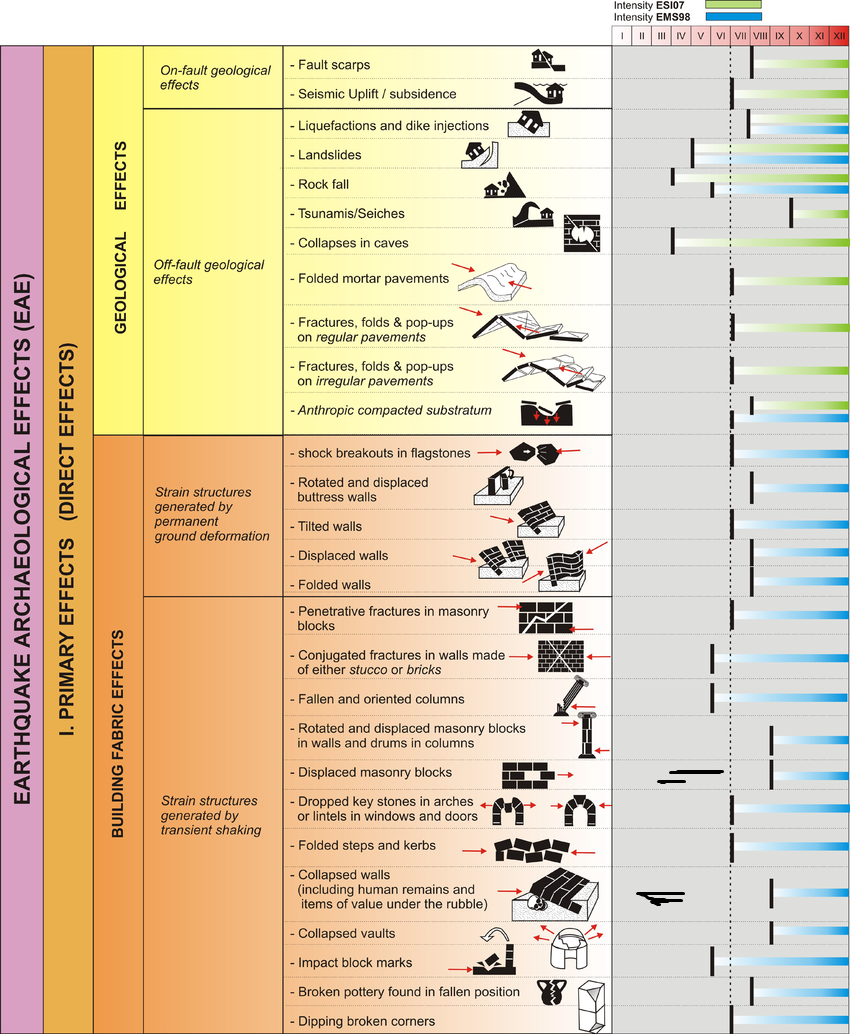 Earthquake Archeological Effects (EAE)
Rodríguez-Pascua et al (2013: 221-224)
| Effect | Location | Image(s) | Description | Intensity |
|---|---|---|---|---|
| Collapsed Walls and re-used building elements |
Basilica
Figure 5 THE BASILICA
(Y. NAKAS AND M. EISENBERG) Eisenberg (2021) |
|
VIII+ | |
| Collapsed Roof suggesting displaced walls | Northern part of the nave of the Basilica
Figure 5 THE BASILICA
(Y. NAKAS AND M. EISENBERG) Eisenberg (2021) |
The sole evidence for a sudden disaster is the find of parts of skeletons of at least four humans that were buried under the collapsed roof in the northern part of the nave. Two of the almost intact skeletons belonged to an adult male and a young female. The female was found with an iron nail (most probably from the roof ) stuck in her knee bones and a dove-shaped pendant resting between her neck bones.- Eisenberg (2021:171-173) |
VII+ | |
| Foundation Damage | Saddle Necroplis (Lion and Flower Mausoleum)
Figure 1 Mt. Sussita and its environs with the three necropoleis and the Saddle Necropolis monuments indicated:
drone view towards north (photo M. Eisenberg) Eisenberg and Kowalewska (2024)
Figure 2Drone’s view towards west looking at the Lion’s Mausoleum (left), the Flowers Mausoleum (right), and Burial Cave A beneath them (photo M. Eisenberg) Eisenberg and Kowalewska (2024)
Figure 8An artistic reconstruction of the funerary monuments along the main road in the Saddle Necropolis with the funerary podia series and the two mausolea (Y. Nakas and M. Eisenberg) Eisenberg and Kowalewska (2024) |
Figure 5 The Flowers Mausoleum northern wall and architectural fragments at its foot during excavations; view towards east (photo M. Eisenberg) Eisenberg and Kowalewska (2024) |
|
IX+ |
| Collapsed colonnade? | Forum |
The devastating earthquake that occurred in the region in 363 CE did not spare the forum. It may be assumed that the colonnades collapsed and as a result, some of the stylobates were also dismantled.- Segal et al. (2013:160) |
V+? or VIII+? | |
|
the propylaeum, and the theatre of the Saddle Compound |
|
|
|
|
the hypocausta of the Southern Bathhouse
Figure 1 Plan of the site showing the main excavated areas. Kowalewska and Eisenberg (2021) |
|
|
|
|
Odeion |
|
|
|
|
Roman temple in the Hellenistic Compound |
|
|
|
|
porticoes of the colonnaded decumanus maximus |
|
|
-
Earthquake Archeological Effects chart
of Rodríguez-Pascua et al (2013: 221-224).
Earthquake Archeological Effects (EAE)
Rodríguez-Pascua et al (2013: 221-224)
| Effect | Location | Image(s) | Description | Intensity |
|---|---|---|---|---|
|
Nave of the Northwest Church
Fig. 256 General plan of the Northwest Church Complex with numbers of loci and walls mentioned in the text. Segal et al. (2013) |
Fig. 281
Fig. 281 The mosaic under the arched entrance to the southern pastophorion (the martyrion chapel) with evidence of repairs. Segal et al. (2013) |
The final phase of the church (Phase III) was the decline of the basilica which must have been the result of some unspecified disaster of an unknown date but which clearly caused serious damage to the nave; it was probably one of the earthquakes which affected this region in the second half of the 7th century (658 CE) or at the beginning of the 8th century (717 CE). Indeed, eloquent testimony to the ancient repairs made to the mosaic floor can be seen at the southern pastophorion. Right under the arched entrance to this room, the mosaic bears traces of repairs carried out after it was damaged, probably during an earthquake (fig. 281).- Segal et al. (2013:210) |
|
-
Earthquake Archeological Effects chart
of Rodríguez-Pascua et al (2013: 221-224)
Earthquake Archeological Effects (EAE)
Rodríguez-Pascua et al (2013: 221-224)
| Effect | Location | Image(s) | Description | Intensity |
|---|---|---|---|---|
| Tilted and displaced walls (tilted and displaced to the west) |
Wall W1386 in the area east of the Hellenistic Compound (HLC 5)
Plan of the Forum. Hellenistic compound, and Northwest Church Segal and Eisenberg (2007) |
Figure 21 Hippos 2009, area to the east of the HLC (Hellenistic Compound). Wall 1386. Note the extent of damage, most probably the results of the landslide caused by the earthquake JW: located in HLC 5 Segal et al (2019) |
|
VI-VII+ |
| Collapsed walls | Cathedral |
Figure 9 The Cathedral at the end of the 2021 excavation, aerial view from 3D model. Kowalewska and Eisenberg (2021)
Figure 9
The chancel screen of the southern photisterion during excavations, buried under the 749 CE earthquake collapse, looking east (M. Eisenberg). click on image to open in a new tab Eisenberg and Kowalewska (2026) |
The atrium and the southern aisle floors were covered with collapsed building debris, composed mainly of basalt ashlars. Only the lowest ashlar courses of the building’s walls were extant, and in some places even the lowest course was tilted and pushed out of place. The eastern area of the opus sectile floor of the southern aisle was well preserved.- Kowalewska and Eisenberg (2021) |
VIII+ |
| Collapsed Building (collapsed walls) | Umayyad-period structure was built above the middle of the basilica's eastern aisle and eastern wall |
Fig. 9.9
Fig. 9.9 The Umayyad-period structure in the eastern part of the basilica area. View towards the south. Note the secondary use of the civic basilica architectural fragments at the corner foundations reaching the civic basilica floor level (M. Eisenberg) Click on image to open in a new tab Eisenberg and Kowalewska (2025) |
|
VIII+ |
|
Northeast
Insula and Northeast Church |
|
|
|
| Tilted Walls | Cathedral |
Figure 9 The Cathedral at the end of the 2021 excavation, aerial view from 3D model. Kowalewska and Eisenberg (2021) |
The atrium and the southern aisle floors were covered with collapsed building debris, composed mainly of basalt ashlars. Only the lowest ashlar courses of the building’s walls were extant, and in some places even the lowest course was tilted and pushed out of place. The eastern area of the opus sectile floor of the southern aisle was well preserved.- Kowalewska and Eisenberg (2021) |
VI+ |
| Displaced Walls | Cathedral |
Figure 9 The Cathedral at the end of the 2021 excavation, aerial view from 3D model. Kowalewska and Eisenberg (2021) |
The atrium and the southern aisle floors were covered with collapsed building debris, composed mainly of basalt ashlars. Only the lowest ashlar courses of the building’s walls were extant, and in some places even the lowest course was tilted and pushed out of place. The eastern area of the opus sectile floor of the southern aisle was well preserved.- Kowalewska and Eisenberg (2021) |
VII+ |
|
Cathedral |
Figure 9 The Cathedral at the end of the 2021 excavation, aerial view from 3D model. Kowalewska and Eisenberg (2021)
Fallen Columns in the CathedralClick on image to open a higher resolution magnifiable image in a new tab Photo by Jefferson Williams 17 April 2025
Fallen Columns in the CathedralPhoto by Jefferson Williams 17 April 2025 Fig. 9.12
Fig. 9.12A vertical extract from a photogrammetric model of the cathedral (M. Eisenberg) Click on image to open in a new tab Eisenberg and Kowalewska (2025) |
|
|
| Fallen columns | Forum
Figure 3 VERTICAL AERIAL PHOTOGRAPH OF HIPPOS CITY CENTER (M. EISENBERG) Eisenberg (2021)
Plan of the Forum. Hellenistic compound, and Northwest ChurchSegal and Eisenberg (2007) Fig.9.7
Fig. 9.7A vertical view towards the northern part of the Hellenistic Compound and the North-West Church built in its centre.
(M. Eisenberg). Click on image to open in a new tab Eisenberg and Kowalewska (2025) |
Fig. 9.6
Fig. 9.6 The northern portico of the forum with monolithic column shafts (toppled in AD 749) lying on the forum pavers, with the kalybe temple and Sea of Galilee in the far west (M. Eisenberg) JW: Columns not in original post quake position - see Eisenberg and Kowalewska (2025:n. 26). Click on image to open in a new tab Eisenberg and Kowalewska (2025) |
|
VI+ (EAE) |
|
Northwest Church
Fig. 256 General plan of the Northwest Church Complex with numbers of loci and walls mentioned in the text. Segal et al. (2013) |
|
|
 Fig. 2.5
Simplified north-south trending geological profile through the saddle-like structure of the Sussita hill. On top of the profile, a frequency-dependent seismic amplification is shown which was derived for ten one-dimensional linear elastic models of the subsurface. Abbreviations for the geologic units are given at the bottom of the figure.
Wechsler et al (2018)
Wechsler et al (2018) pointed out that a topographic or ridge effect is likely present Hippos Sussita:
The saddle-like structure of the Sussita hill is prone to topographic amplification of strong ground motion during earthquakes, especially at the hilltop. The focusing effects of seismic waves in similar situations have been reported to lead to significant ground motion amplification (e.g., Massa et al., 2010). In the case of Hippos, the special geometry of the hill is combined with the unusual situation of high impedance material in the form of a basalt flow on top of weaker conglomerates. Figure 2.5 (above) shows a simplified north-south trending profile through the site and the neighboring valleys of Ein-Gev and Sussita. Estimates of ground motion amplification of vertically traveling shear waves from 1D model calculations indicate amplification factors at the hilltop in the range of 8 at frequencies of 2-3 Hz, a frequency range at which constructions such as colonnades show high vulnerability. In any further archaeoseismic studies of the damaged structures in Hippos, the exceptional location of the site and the local conditions must be taken into account.
- Figure 13a -
PGA vs. frequency (period is the inverse of frequency) from Massa et al (2010)
 Figure 13. (a)
Residuals between predicted acceleration response spectra (5% damping) for reference station (NRN2) and for station NRN7, for periods up to 1 s. The results are reported for the west—east component and are presented in terms of logarithmic differences. PGHA indicates peak ground horizontal component (in this case, the east—west component).
Massa et al (2010)
Output with site effect removed assumes that PGA is higher than it would be if there was no site effect. In this situation, Intensity (I) with site effect removed is calculated pre-amplification (i.e. it will be lower). This is because an Intensity estimate with the site effect removed is helpful in producing an Intensity Map that will do a better job of "triangulating" the epicentral area. Site Effect is based on Figure 13a and Equation 2 of Massa et al (2010)
Equation 2
log10(Y) = a + b*M+ c*log10(R) + St + σ
where
Y = PGA
M = Magnitude
R = Hypocentral Distance (km.)
St = additional PGA from Topographic Effect
σ = standard deviation of PGA
a,b,c = coefficients relating to attenuation of source energy away from the source
In their study, they estimated a frequency dependent additional PGA (St in Eqn. 2) which is added by a topographic site effect. The additional topographic site effect PGA varied from ~0.1 g to 0.5 g for dominant frequencies of approximately 1 - 5 Hz.. Higher PGA's were shown to be present for higher frequencies which are more likely to occur when the earthquake producing fault is closer to the site. They also noted that a greater topographic effect was observed when the seismic energy arrived orthogonal (perpendicular in their words) to the ridge. Both of these considerations suggest that a topographic ridge effect should be considered at Hippos Sussita when other evidence suggests that one of the Sea of Galilee faults broke during the earthquake. The additional Site Effect PGA is linearly scaled from 0 - 0.5 g for site effects where amplitude increases from 1x to 10x. It's not the greatest transform to remove site effect from the Intensity estimate but may be useful for crude estimates.