Jordan River Delta Slumps
 Figure 2
North-south 3.5 kHz seismic-reflection profile A showing cross-sectional detail of submarine slump and correlation of seismic reflectors (B-E; with major, radiocarbon-dated lowstands of Dead Sea (Frumkin et al., 1991); m bsl is metres below sea level. Arrow indicates headwall scarp of slump. Two seismically triggered slump events are labeled 1 and 2 (see text for description).
Niemi and Ben-Avraham (1994)
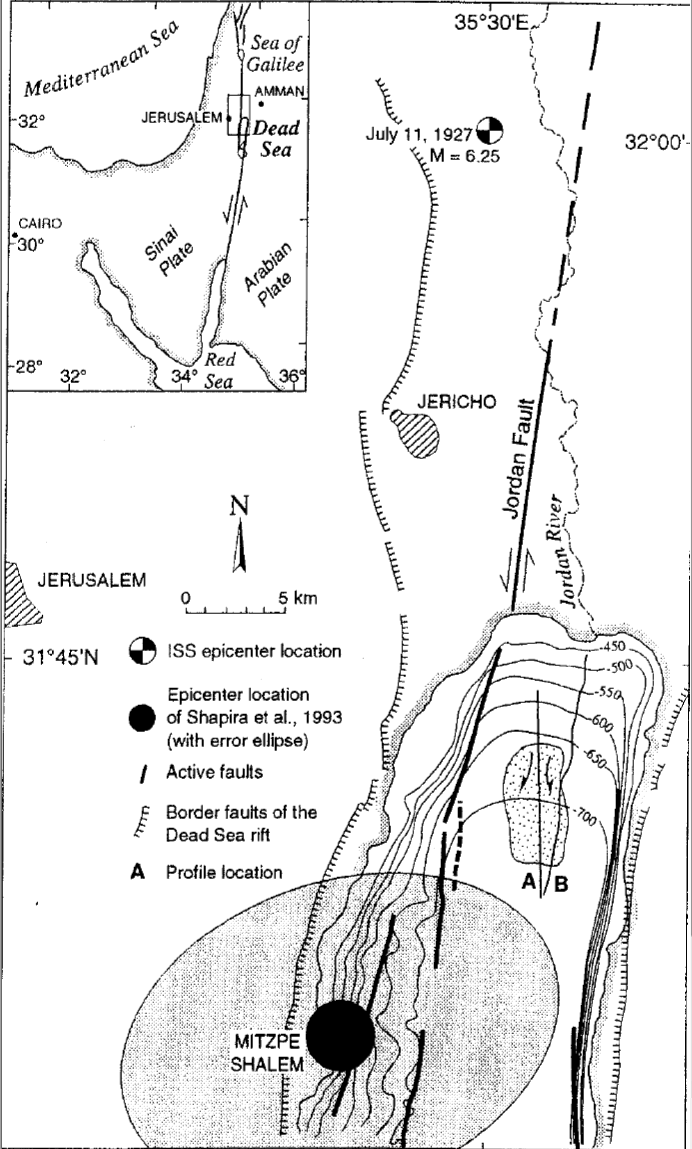 Figure 1
Mapped faults and slump In northern Dead Sea. Location of active faults that deform subbottom strata in north basin of Dead Sea are based on analyses of 3.5 kHz and Sparker high-resolution seismic-reflection data (Neev and Hall, 1976). Seismic-reflection profiles A and B across submarine slump (stippled area) are shown in Figures 2 and 3, respectively. Map also shows International Seismological Summary (ISS) catalogue epicenter of July 11, 1927, Jericho earthquake, although location of epicenter beneath Dead Sea fits seismological data better (Shapira et al., 1993). Contours are in metres below sea level.
Niemi and Ben-Avraham (1994)
Figure 1Mapped faults and slump In northern Dead Sea. Location of active faults that deform subbottom strata in north basin of Dead Sea are based on analyses of 3.5 kHz and Sparker high-resolution seismic-reflection data (Neev and Hall, 1976). Seismic-reflection profiles A and B across submarine slump (stippled area) are shown in Figures 2 and 3, respectively. Map also shows International Seismological Summary (ISS) catalogue epicenter of July 11, 1927, Jericho earthquake, although location of epicenter beneath Dead Sea fits seismological data better (Shapira et al., 1993). Contours are in metres below sea level.
Niemi and Ben-Avraham (1994)
- Jordan River Delta in Google Earth
 Jordan River Delta in Google Earth
click on image to explore this site on a new tab in Google Earth
| Image | Description | Source |
|---|---|---|
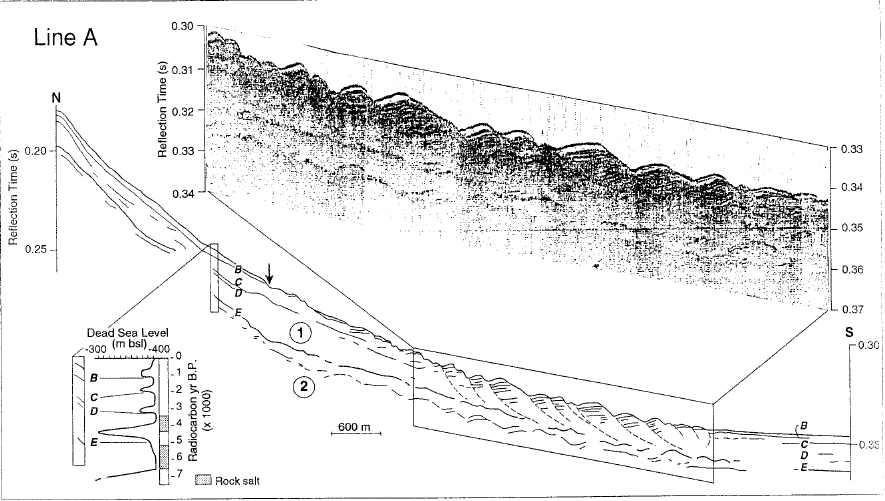 Figure 2
North-south 3.5 kHz seismic-reflection profile A showing cross-sectional detail of submarine slump and correlation of seismic reflectors (B-E; with major, radiocarbon-dated lowstands of Dead Sea (Frumkin et al., 1991); m bsl is metres below sea level. Arrow indicates headwall scarp of slump. Two seismically triggered slump events are labeled 1 and 2 (see text for description). Niemi and Ben-Avraham (1994) |
Fig. 2 - Line A | Niemi and Ben-Avraham (1994) |
 Figure 3
Sparker profile B of Jordan River delta. Triangle marks base of delta wedge. Line drawing shows our interpretation of vertically stacked slumped sediments. Upper four slumps have better definition with shallow failure planes and chaotic reflectors separated by undisturbed parallel reflectors. Location of these slump deposits beneath 1927 slump suggests that they formed by similar slip on adjacent fault segment and represent succession of older seismic-triggering events. Reches and Hoexter (1981) |
Fig. 3 - Line B | Niemi and Ben-Avraham (1994) |
- Earthquake Archeological
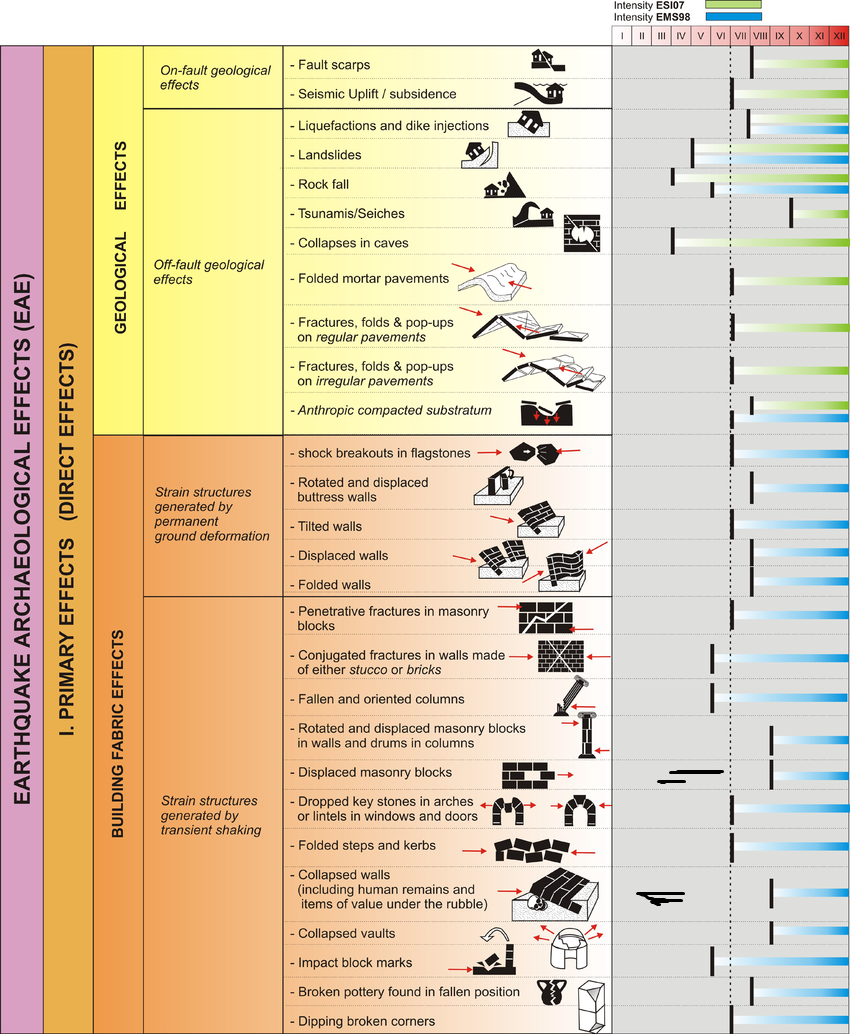
Effects from Rodríguez-Pascua et al (2013: 221-224)
 Earthquake Archeological
Effects Chart
Earthquake Archeological
Effects Chart
Click on image to open in a new tab
Rodríguez-Pascua et al (2013) - Environmental Effects (ESI 2007)
 Graphic Representation of
ESI 2007 Intensity
Graphic Representation of
ESI 2007 Intensity
Click on image to open in a new tab
- Synoptic Table of ESI 2007
Intensity Degrees from Michetti et al. (2007)
 Synoptic Table of ESI 2007
Intensity Degrees
Synoptic Table of ESI 2007
Intensity Degrees
Accuracy improves in higher degrees, especially VIII–XII.
Click on image to open in a new tab
Michetti et al. (2007) - Environmental Effects vs. Intensity
from Michetti et al. (2007)
 Diagnostic ranges for
environmental effects by intensity
Diagnostic ranges for
environmental effects by intensity
Click on image to open in a new tab
Michetti et al. (2007)

| Effect | Location | Image(s) | Description | Intensity |
|---|---|---|---|---|
| Submarine Debris Flows | Dead Sea Seismic Line A
Figure 1 Mapped faults and slump In northern Dead Sea. Location of active faults that deform subbottom strata in north basin of Dead Sea are based on analyses of 3.5 kHz and Sparker high-resolution seismic-reflection data (Neev and Hall, 1976). Seismic-reflection profiles A and B across submarine slump (stippled area) are shown in Figures 2 and 3, respectively. Map also shows International Seismological Summary (ISS) catalogue epicenter of July 11, 1927, Jericho earthquake, although location of epicenter beneath Dead Sea fits seismological data better (Shapira et al., 1993). Contours are in metres below sea level. Niemi and Ben-Avraham (1994) |
Line A
Figure 2 North-south 3.5 kHz seismic-reflection profile A showing cross-sectional detail of submarine slump and correlation of seismic reflectors (B-E; with major, radiocarbon-dated lowstands of Dead Sea (Frumkin et al., 1991); m bsl is metres below sea level. Arrow indicates headwall scarp of slump. Two seismically triggered slump events are labeled 1 and 2 (see text for description). Niemi and Ben-Avraham (1994) |
|
IV-VIII+ |