Fishing Dock Landslide
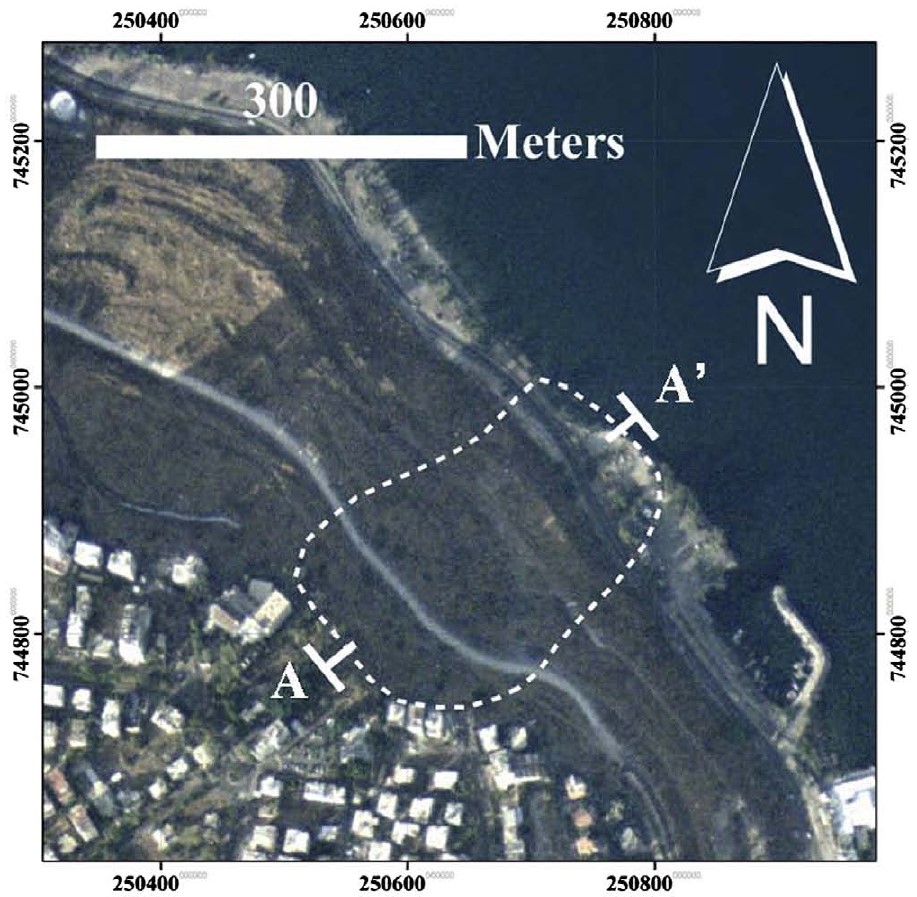 Fig. 8 - Aerial view of Fishing Dock landslide scar.
Yagoda-Biran et al (2010)
- Fig. 8 Aerial view of
Fishing Dock landslide scar from Yagoda-Biran et al (2010)
Fig. 8 - Aerial view of Fishing Dock landslide scar.
Yagoda-Biran et al (2010) - Fishing Dock Landslide in Google Earth
 Fishing Dock Landslide in Google Earth
click on image to explore this site on a new tab in Google Earth - Fishing Dock Landslide on govmap.gov.il
 Fishing Dock Landslide on govmap.gov.il
click on image to explore this site on a new tab in govmap.gov.il
- Fig. 8 Aerial view of
Fishing Dock landslide scar from Yagoda-Biran et al (2010)
Fig. 8 - Aerial view of Fishing Dock landslide scar.
Yagoda-Biran et al (2010) - Fishing Dock Landslide in Google Earth
Fishing Dock Landslide in Google Earth
click on image to explore this site on a new tab in Google Earth - Fishing Dock Landslide on govmap.gov.il
Fishing Dock Landslide on govmap.gov.il
click on image to explore this site on a new tab in govmap.gov.il
- Fig. 8 Cross section
through the Fishing Dock landslide fromYagoda-Biran et al (2010)
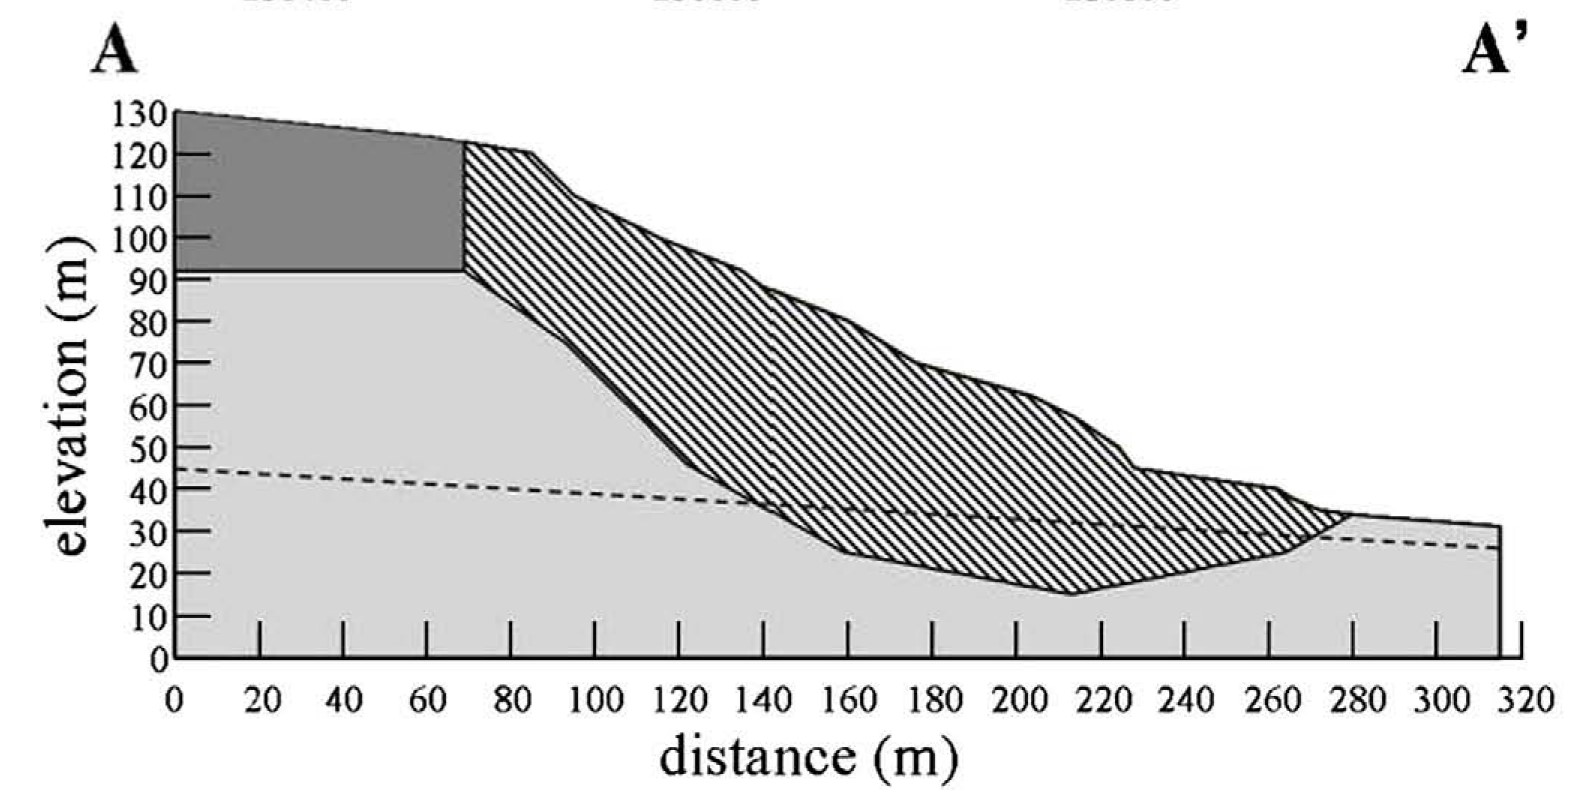 Fig. 8
Cross section through the Fishing Dock landslide.
Legend
- sliding mass — diagonal pattern
- sheared material — light grey
- Cover Basait — dark grey
- recent GWT — dashed line
- GWT = Ground Water Table
Yagoda-Biran et al (2010)
- Fig. 8 Cross section
through the Fishing Dock landslide fromYagoda-Biran et al (2010)
Fig. 8
Cross section through the Fishing Dock landslide.
Legend
- sliding mass — diagonal pattern
- sheared material — light grey
- Cover Basait — dark grey
- recent GWT — dashed line
- GWT = Ground Water Table
Yagoda-Biran et al (2010)
2 D Model
Fig. 8Cross section through the Fishing Dock landslide.
Legend
- sliding mass — diagonal pattern
- sheared material — light grey
- Cover Basait — dark grey
- recent GWT — dashed line
- GWT = Ground Water Table
Yagoda-Biran et al (2010)
The geometry of the slope model shown above is based on a profile suggested by Keisar and Peferbaum (2001).
Soil Properties
The slide itself is part of the Pliocene Bira formation which is composed of marls, chalks, and some clay. In parts, this formation is unconformably overlain by the Cover Basalt Formation (Saltzman, 1964). Mechanical properties of the sheared materials were determined by tests performed at commercial labs in Israel as reported by Saltzman (2005). Consolidated drained (CD) direct shear and consolidated undrained (CU) triaxial shear tests were performed. Results of the tests are summarized in the table below:| Test | Water Content | Cohesion (C) | Friction Angle (Φ) |
|---|---|---|---|
| Consolidated Drained (CD) | Natural Water Content | 400 kPa | 46º |
| Consolidated Drained (CD) | Saturated | 35 kPa | 42º |
| Consolidated Undrained (CU) | Saturated | 86 kPa | 33º |
Static Analysis
A Factor of Safety (FS) for the slope was estimated first to determine if the slope was stable under aseismic conditions. The method of slices by Morgenstern and Price (1965) was used which divides the soil model into vertical slices and determines Factor of Safety as a ratio from a sum of moment balances performed on each vertical slice. This accounts for changes in topography and lateral changes in unit thicknesses and elevation of the water table. The generalized equation is shown below.FS = Σ Mr / Σ Md
where
Mr = Resisting Moment
Md = Driving Moment
Resisting Moment is the ability of the soil mass to avoid moving. The driving moment is the forces such as gravity and water saturated layers pushing the soil mass down slope. FS less than 1 indicates that the slope is unstable. FS greater than 1 indicates that the slope is stable. Yagoda-Biran et al (2010) evaluated FS for a variety of scenarios and came up with a range of FS values from 1.35 to 4.9 - indicating that the slope is aseismically stable - but, in some cases, not by much. In fact, the authors report that recent rejuvenation of the slide is what prompted their study. The commercial software Slope/W™ was used to perform the Static Analysis.
Pseudo-Static Analysis
The authors simulated a pseudo-static, horizontal, inertia force as the additional external load required to trigger sliding in their slope model. Yagoda-Biran et al (2010) proposed that only the CU tests simulated the rapid shear loading and increased pore pressures that would develop during an earthquake and suggested that CD tests be ignored because they would only be representative of a slide that developed under slow rates of shearing where increases in pore pressure had time to dissipate. The results for FS and horizontal PGA for five different scenarios are presented in the table below where the two tests that the authors suggest are relevant are bolded. Minimum PGA to initiate a slide at the Fishing Dock landslide was determined to vary between 0.15 and 0.5 g where the elevation of the water table is the driving factor in determining how high the PGA must be before the slope would fail. The higher the water table, the less stable the slope which results in a lower PGA required to induce sliding. For ground water levels at the time of the study, the minimum PGA to induce sliding is estimated at 0.5 g. 0.15 g to 0.5 g translates into local intensities of 6.5 to 8.2 respectively when using Wald et al (1999) for the conversion.| Scenario | Water Content | Soil Test Data | GWT Level | FS | Minimum PGA (g) |
|---|---|---|---|---|---|
| A | Natural Water Content | CD | Recent Level | 4.9 | 1.61 |
| B1 | Saturated | CD | Recent Level | 2.8 | 0.85 |
| B2 | Saturated | CD | at surface | 1.52 | 0.28 |
| C1 | Saturated | CU | Recent Level | 2.3 | 0.5 |
| C2 | Saturated | CU | at surface | 1.35 | 0.15 |
| Effect | Location | Image(s) | Description | Intensity | ||||||||||||||||||||||||||||||||||||
|---|---|---|---|---|---|---|---|---|---|---|---|---|---|---|---|---|---|---|---|---|---|---|---|---|---|---|---|---|---|---|---|---|---|---|---|---|---|---|---|---|
| Landslide | Fishing Dock
Fig. 8 - Aerial view of Fishing Dock landslide scar. Yagoda-Biran et al (2010) |
|
6.5-8.2 |