En Gev Landslides and Trenches (aka Ha'on escarpment)

 Left
LeftNorth and South En Gev Landslides are outlined in purple
click on image to explore this site on a new tab in Google Earth
Right
Figure 2
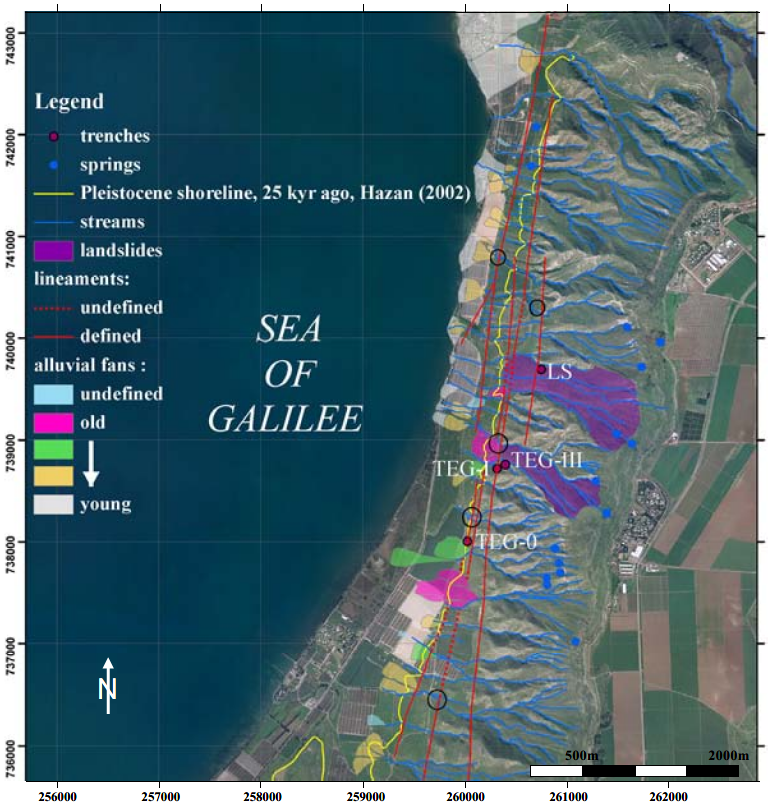
Morphotectonic map of the studied area (coordinates are in Israeli TM grid). The map is based mainly on areal photos (dated 1945), interpretation, and complementary field work. Mapped are all lineaments, landslides, fluvial systems (with sites of channel displacement marked by open black circle) and alluvial fans located within the study area. Also shown are the sites of the paleoseismic trenches and the highest shore line of the Sea of Galilee, 170 m below sea level, achieved at 25 ka (Hazan et al., 2005).
JW: Ein Gev landslides are shaded purple
Katz et al (2009)
- from Katz et al (2009)
Figure 2
Morphotectonic map of the studied area (coordinates are in Israeli TM grid). The map is based mainly on areal photos (dated 1945), interpretation, and complementary field work. Mapped are all lineaments, landslides, fluvial systems (with sites of channel displacement marked by open black circle) and alluvial fans located within the study area. Also shown are the sites of the paleoseismic trenches and the highest shore line of the Sea of Galilee, 170 m below sea level, achieved at 25 ka (Hazan et al., 2005).
JW: Ein Gev landslides are shaded purple
Katz et al (2009)
- from Katz et al (2009)

Figure 13
Map of landslide hazard around the Sea of Galilee (coordinates are in Israeli TM grid). This qualitative hazard map is a result of integration of the mechanical properties of the exposed rocks, the dip of the geological structure, and the slope gradient, where I to X mark the lowest to greatest hazard, respectively; Negl.—negligible hazard (Katz and Almog, 2006). Tiberias city premises and the studied area are marked by black lines; the sites of the studied landslide (EGLS) and the Berniki Beach landslide (BBLS) are also marked.
Katz et al (2009)
- from Katz et al (2009)
Figure 2
Morphotectonic map of the studied area (coordinates are in Israeli TM grid). The map is based mainly on areal photos (dated 1945), interpretation, and complementary field work. Mapped are all lineaments, landslides, fluvial systems (with sites of channel displacement marked by open black circle) and alluvial fans located within the study area. Also shown are the sites of the paleoseismic trenches and the highest shore line of the Sea of Galilee, 170 m below sea level, achieved at 25 ka (Hazan et al., 2005).
JW: Ein Gev landslides are shaded purple
Katz et al (2009)
- from Katz et al (2009)
Figure 13
Map of landslide hazard around the Sea of Galilee (coordinates are in Israeli TM grid). This qualitative hazard map is a result of integration of the mechanical properties of the exposed rocks, the dip of the geological structure, and the slope gradient, where I to X mark the lowest to greatest hazard, respectively; Negl.—negligible hazard (Katz and Almog, 2006). Tiberias city premises and the studied area are marked by black lines; the sites of the studied landslide (EGLS) and the Berniki Beach landslide (BBLS) are also marked.
Katz et al (2009)
- En Gev in Google Earth
 En Gev in Google Earth
click on image to explore this site on a new tab in Google Earth - Annotated En Gev in Google Earth
North and South En Gev Landslides are outlined in purple
click on image to explore this site on a new tab in Google Earth - En Gev on govmap.gov.il
 En Gev on govmap.gov.il
click on image to explore this site on a new tab in govmap.gov.il
- from Katz et al (2009)

Fig. 5
Age of earthquake events found in the studied trenches (for location, see Fig. 2). Age determined using OSL (solid diamonds; Table 1) or according to field considerations (solid diamonds with question marks). Also shown are: ages of landslide events (squares) and the age of the slopes away from the fault trace at the different trench sites (open diamonds). Error bars are from Table 1.
Katz et al (2009)
- from Katz et al (2009)

Fig. 12
Age and magnitude of earthquakes identified in the studied area. The moment magnitude is calculated using the observed (normal) slip on the fault surfaces and the regression presented by Wells and Coppersmith (1994). Error bars are 95% confidence interval of Wells and Coppersmith (1994). Age determined using OSL (solid diamonds) or ac cording to field considerations (open diamonds with question marks). Error bars for age determination are according to Table 1 or according to field consideration. One earthquake, Figure 12 with age of ~47 ka, has unconstrained magnitude (marked by triangles in the estimated possible magnitude range). Also shown are ages of landslides identified in the studied area.
Katz et al (2009)
- from Katz et al (2009)

Geometrical comparison of the northern landslide and the slope to its south. (a) Geological cross section of the slope south of the northern landslide
- Me —Ein-Gev Fm.
- Mh—Hordos Fm.
- Pβc —Cover Basalt Fm.
- Al— alluvium
- point 1 is the slide base where the sliding plane daylights, points 2 and 3 are the landslide scar base and top, respectively.
- Geological cross section of the northern landslide (the bedrock is not exposed on the slope below the Pβc and therefore the mapped unit is LS: landslide material and colluvium).
- Geometrical comparison of the northern landslide (black line) and the slope to its south (gray line), showing the area of material depletion (landslide source) and area of material excess (landslide toe). Overlap is based on the contact of Mh and Pβc and the local slope profile at this contact.
- from Katz et al (2009)
Figure 2
Morphotectonic map of the studied area (coordinates are in Israeli TM grid). The map is based mainly on areal photos (dated 1945), interpretation, and complementary field work. Mapped are all lineaments, landslides, fluvial systems (with sites of channel displacement marked by open black circle) and alluvial fans located within the study area. Also shown are the sites of the paleoseismic trenches and the highest shore line of the Sea of Galilee, 170 m below sea level, achieved at 25 ka (Hazan et al., 2005).
JW: Ein Gev landslides are shaded purple
Katz et al (2009)
- from Katz et al (2009)

Fig. 4
Log of the northern wall of trench TEG-0 (for location, see Fig. 2)
Katz et al (2009)
- from Katz et al (2009)

Fig. 6
Log of the southern wall of trench TEG-III (for location, see Fig. 2)
Katz et al (2009)
- from Katz et al (2009)
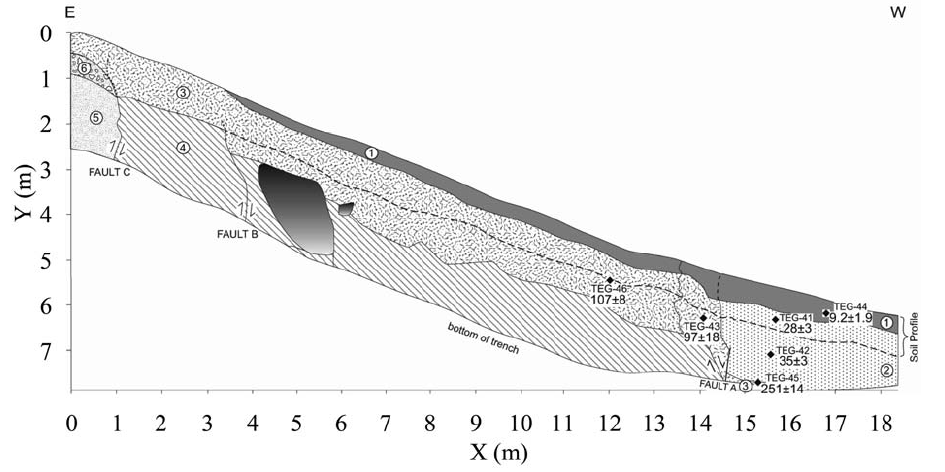
Fig. 8
Log of the southern wall of trench TEG-I (for location, see Fig. 2)
Katz et al (2009)
- from Katz et al (2009)

Fig. 11
Log (a) and a picture (b) of the southern wall of the northern landslide trench (for location, see Fig. 2). Hatched areas marked by A1–A3 are the colluvium proiles described in the text. Some basalt blocks are marked by dark gray numbers 1–3 on the log and on the picture.
Katz et al (2009)
- from Amit. R., Katz, O., Yagoda-Biran G., Hatzor, Y.H., 2009. Paleoseismology of the eastern Sea of Galilee . Dead Sea Workshop Field Guide. 49-53.
- This may explain discrepancies between dates reported in theses of Braun and Kagan and the article by Katz et al (2009)

Fig. 2a
Paleoseismic trenches: Two events: ~ 11ka and ~4ka
Amit et al. (2009)

Fig. 2b
Paleoseismic trenches: two events: ~40ka and ~4 ka
Amit et al. (2009)

Fig. 2c
Paleoseismic trenches: Two events: ~40ka and ~10ka
Amit et al. (2009)
- from Katz et al (2009)
 Figure 10a
High resolution reflection profile along the northern landslide (coordinates are in Israeli TM grid).
- The trace of the reflection profile (in green)
- the northern landslide outline (dashed line)
- mapped faults (blue lines; appear also in Fig. 2)
- projection of the faults (F) and the listric discontinuities (L) on the surface, interpreted from the reflection section
- T marks the site of the trench (shown in Fig. 11)
- from Katz et al (2009)

Figure 10b
Interpreted reflection profile (time domain; two way travel).
- projection of the faults (F) and the listric discontinuities (L) on the surface, interpreted from the reflection section
- T marks the site of the trench (shown in Fig. 11)
- from Katz et al (2009)

Figure 10c
Uninterpreted reflection profile (time domain; two way travel).
Katz et al (2009)
- Fig. 3 - Surface rupture and
scarp of the youngest fault studied from Katz et al (2009)
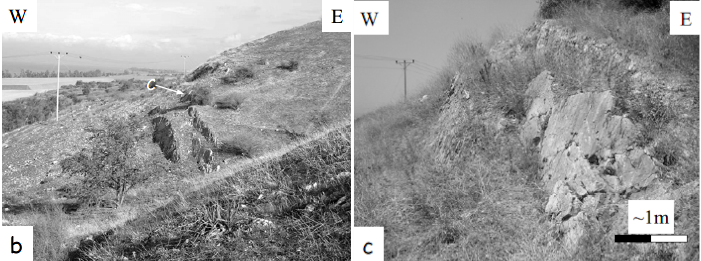
 Figure 3
Surface rupture and the scarp of the youngest fault studied
- Surface rupture of a colluvium unit. This site was later used for paleoseismic trenching (trench TEG-0 in Fig. 2).
- Surface rupture of bedrock (Eocene Maresha Fm.), about 100 m north of (a).
- Close-up of one of the scarps that appear in (b).
Katz et al (2009) - Fig. 7 - Highly fractured
bedrock of Ein-Gev Fm. exposed in Trench TEG-III from Katz et al (2009)
 Figure 7
Highly fractured bedrock of Ein-Gev Fm. (marked by dashed ellipse) bounding the fault exposed in trench TEG-III (Unit 6b in Fig. 6).
Katz et al (2009)
- Fig. 3 - Surface
rupture and scarp of the youngest fault studied from Katz et al (2009)
Figure 3
Surface rupture and the scarp of the youngest fault studied
- Surface rupture of a colluvium unit. This site was later used for paleoseismic trenching (trench TEG-0 in Fig. 2).
- Surface rupture of bedrock (Eocene Maresha Fm.), about 100 m north of (a).
- Close-up of one of the scarps that appear in (b).
Katz et al (2009) - Fig. 7 - Highly fractured
bedrock of Ein-Gev Fm. exposed in Trench TEG-III from Katz et al (2009)
Figure 7
Highly fractured bedrock of Ein-Gev Fm. (marked by dashed ellipse) bounding the fault exposed in trench TEG-III (Unit 6b in Fig. 6).
Katz et al (2009)
- Fig. 3 - Surface rupture and
scarp of the youngest fault studied from Katz et al (2009)
Figure 3
Surface rupture and the scarp of the youngest fault studied
- Surface rupture of a colluvium unit. This site was later used for paleoseismic trenching (trench TEG-0 in Fig. 2).
- Surface rupture of bedrock (Eocene Maresha Fm.), about 100 m north of (a).
- Close-up of one of the scarps that appear in (b).
Katz et al (2009)
The study area hosts two large landslides (Fig. 2). The length of the northern and southern landslides (scar to toe) is 1500 m and 1000 m respectively, ranging in width from tens to hundreds of meters. The landslides span the entire slope height of about 500 m, and are the only places along the study area where large rock-blocks (volume >1 m3) of the Cover Basalt Fm. (exposed in situ at the upper part of the slope) are widely distributed at its foot. The scar and toe morphology suggests that sliding took place in a slump mechanism (Varnes, 1978). The landslides are spatially correlated with the studied fault segments, either covering the faults or being cut and displaced (normally) by them (Fig. 2). These field relations point to correlated events of earthquakes and landslides, thus to the working assumption that the landslides might be earthquake-induced.
Fig. 2
Figure 2Morphotectonic map of the studied area (coordinates are in Israeli TM grid). The map is based mainly on areal photos (dated 1945), interpretation, and complementary field work. Mapped are all lineaments, landslides, fluvial systems (with sites of channel displacement marked by open black circle) and alluvial fans located within the study area. Also shown are the sites of the paleoseismic trenches and the highest shore line of the Sea of Galilee, 170 m below sea level, achieved at 25 ka (Hazan et al., 2005).
JW: Ein Gev landslides are shaded purple
Katz et al (2009)
We studied the deep structure of the northern landslide and the sliding surface depth using geometrical analysis following Masson et al. (2002), as well as a high-resolution seismic reflection survey.
Assuming that the intact slope south of the land slide is similar in its topography and geology to the pre-failure slope of the studied landslide, a geometrical comparison by overlapping the geological cross sections of the intact and the landslide slopes, with hinge points along the contact of the Ein Gev with the overlaying Cover Basalt formations, reveals areas with respective material depletion (Fig. 9, intact slope proile above landslide profile) and material excess (Fig. 9, intact slope profile below landslide profile). These are the source and the deposition parts of the landslide, respectively. This structure of source and deposition martial is in agreement with the slump type assumed for this landslide according to the surface geometry. The vertical difference between the two profiles, about 30 m, is a reasonable approximation of the landslide thickness. This thickness is in accordance with other field-observed ratios of landslide thickness t, vs. landslide length l, of 0.05–0.15 (Guzzetti et al., 2009; where l is defined as √A and A is the landslide surface area). For the landslide studied, √A is ~500 m and t is ~30 m, thus t/l is ~0.06.
Fig. 9
Geometrical comparison of the northern landslide and the slope to its south. (a) Geological cross section of the slope south of the northern landslide
- Me —Ein-Gev Fm.
- Mh—Hordos Fm.
- Pβc —Cover Basalt Fm.
- Al— alluvium
- point 1 is the slide base where the sliding plane daylights, points 2 and 3 are the landslide scar base and top, respectively.
- Geological cross section of the northern landslide (the bedrock is not exposed on the slope below the Pβc and therefore the mapped unit is LS: landslide material and colluvium).
- Geometrical comparison of the northern landslide (black line) and the slope to its south (gray line), showing the area of material depletion (landslide source) and area of material excess (landslide toe). Overlap is based on the contact of Mh and Pβc and the local slope profile at this contact.
The high resolution seismic reflection survey profile reveals several faults and discontinuities along the studied landslide (Fig. 10). All discontinuities can be detected very close to the slope surface and thus they are apparently displacing the mass of the landslide, and therefore are assumed to be active post sliding. Discontinuities mapped by the seismic reflection survey can be divided into two types:
- Faults, steeply dipping westwards and cutting the entire section (infferred depth of about 200 m). Most of these detected faults have an expression at the surface and were mapped north and south of the landslide (Fig. 10). Only one of the faults interpreted from the reflection proile ruptures the surface, across the landslide toe (Fig. 2).
- Listric faults. These are sub-vertical close to the landslide surface, and turn shallow at a depth of few tens of meters where they terminate, apparently along a common surface (Fig. 10).
Fig. 2
Figure 2Morphotectonic map of the studied area (coordinates are in Israeli TM grid). The map is based mainly on areal photos (dated 1945), interpretation, and complementary field work. Mapped are all lineaments, landslides, fluvial systems (with sites of channel displacement marked by open black circle) and alluvial fans located within the study area. Also shown are the sites of the paleoseismic trenches and the highest shore line of the Sea of Galilee, 170 m below sea level, achieved at 25 ka (Hazan et al., 2005).
JW: Ein Gev landslides are shaded purple
Katz et al (2009)
- from Katz et al (2009)
Figure 10aHigh resolution reflection profile along the northern landslide (coordinates are in Israeli TM grid).
- The trace of the reflection profile (in green)
- the northern landslide outline (dashed line)
- mapped faults (blue lines; appear also in Fig. 2)
- projection of the faults (F) and the listric discontinuities (L) on the surface, interpreted from the reflection section
- T marks the site of the trench (shown in Fig. 11)
- from Katz et al (2009)
Figure 10b
Interpreted reflection profile (time domain; two way travel).
- projection of the faults (F) and the listric discontinuities (L) on the surface, interpreted from the reflection section
- T marks the site of the trench (shown in Fig. 11)
- from Katz et al (2009)
Figure 10c
Uninterpreted reflection profile (time domain; two way travel).
Katz et al (2009)
We opened a trench across the northern landslide where one of the faults leaves a morphological expression on the landslide surface (Fig. 2). The trench, 2 m deep and 13 m long, exposed a sequence of colluvial sediments (Fig. 11). Due to its relatively shallow depth, it did not reveal a discrete sliding plane marking the base of the landslide.
Fig. 2
Figure 2Morphotectonic map of the studied area (coordinates are in Israeli TM grid). The map is based mainly on areal photos (dated 1945), interpretation, and complementary field work. Mapped are all lineaments, landslides, fluvial systems (with sites of channel displacement marked by open black circle) and alluvial fans located within the study area. Also shown are the sites of the paleoseismic trenches and the highest shore line of the Sea of Galilee, 170 m below sea level, achieved at 25 ka (Hazan et al., 2005).
JW: Ein Gev landslides are shaded purple
Katz et al (2009)
Fig. 11
Fig. 11Log (a) and a picture (b) of the southern wall of the northern landslide trench (for location, see Fig. 2). Hatched areas marked by A1–A3 are the colluvium proiles described in the text. Some basalt blocks are marked by dark gray numbers 1–3 on the log and on the picture.
Katz et al (2009)
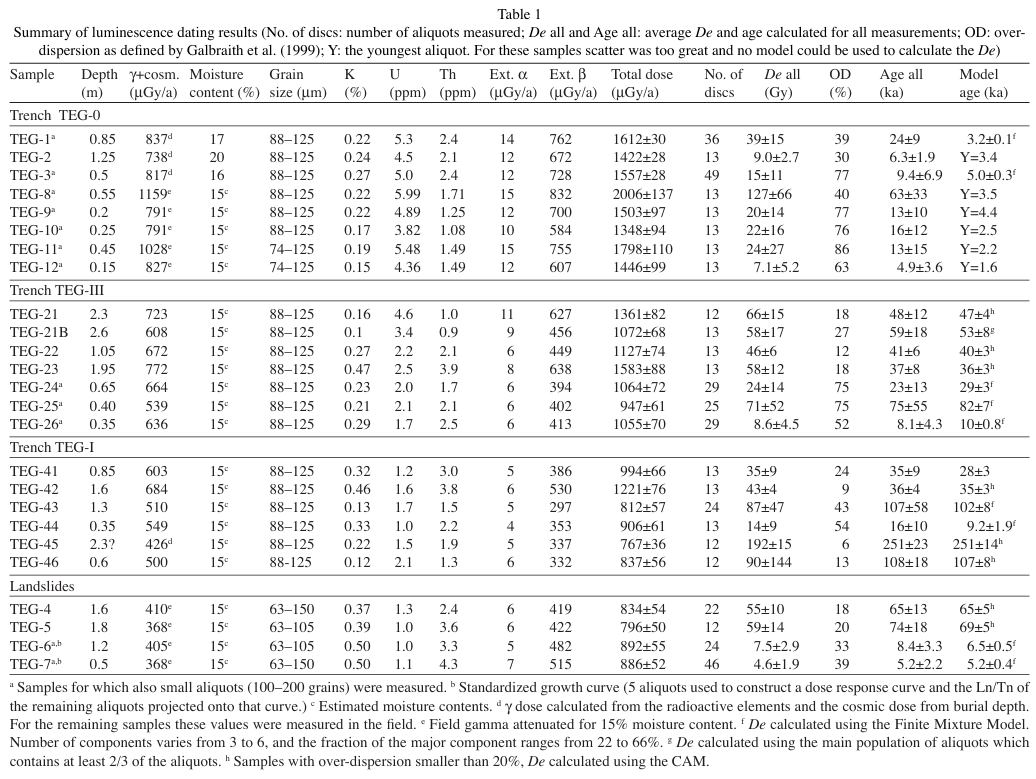
The colluvium at this site is composed of three colluvial units, in each of which a soil was developed. The lower unit A1 (Fig. 11) is composed of clayey material with 10% gravel (0.1 m in average). A well developed calcic soil was formed in the colluvium (A1) with a high amount of calcic nodules and gravel coated by secondary calcium carbonate. This unit is dated 65±5 ka and 69±5 ka (Table 1; Fig. 5). Unit A2 is a mixture of clay with 40% gravel. The gravel is bi-modal with 80% granules (2–3 mm) and ~20% large (>0.3 m) boulders. A moderately developed calcic soil was developed in this unit, with scattered calcic nodules and a small amount of coated gravel. This unit is dated 6.5±0.5 ka (Table 1; Fig. 5). The soils in Units A1 and A2 are calcic but differ in their degree of development, supporting different time periods of slope instability. Unit A3 is silty–clay with 20% gravel (0.03 m size, some >0.1 m) and weak AC soil, non-calcic. This colluvial unit, which covers the recent landslide surface, was dated at 5.2±0.4 ka (Table 1; Fig. 5). The relatively young age of this unit (~ ca. 5 ka) might explain the lack of diagnostic calcic horizon.
Fig. 5
Fig. 5Age of earthquake events found in the studied trenches (for location, see Fig. 2). Age determined using OSL (solid diamonds; Table 1) or according to field considerations (solid diamonds with question marks). Also shown are: ages of landslide events (squares) and the age of the slopes away from the fault trace at the different trench sites (open diamonds). Error bars are from Table 1.
Katz et al (2009)
The ages of the colluvial units support different time periods of slope instability and rule out the possibility of a single sliding event. The lower unit (A1) is the oldest and the two upper units (A2 and A3) were deposited later, after a long period during which no colluviation occurred along the slope. This suggests multiple sliding events separated by long periods of quiescence.
The colluvium at this site shows local deviation from slope parallel deposition, probably as a result of changing local topography and relief above the trace of the fault (Fig. 11). The proximity of the landslide deposit, fault trace, and disturbed colluvium suggests both seismic triggering for the landslide, and deposition of the three colluvium units on an existing fault scarp.
- from Katz et al (2009)
Figure 2
Morphotectonic map of the studied area (coordinates are in Israeli TM grid). The map is based mainly on areal photos (dated 1945), interpretation, and complementary field work. Mapped are all lineaments, landslides, fluvial systems (with sites of channel displacement marked by open black circle) and alluvial fans located within the study area. Also shown are the sites of the paleoseismic trenches and the highest shore line of the Sea of Galilee, 170 m below sea level, achieved at 25 ka (Hazan et al., 2005).
JW: Ein Gev landslides are shaded purple
Katz et al (2009)
- from Katz et al (2009)
Fig. 4
Log of the northern wall of trench TEG-0 (for location, see Fig. 2)
Katz et al (2009)
Phase 1 - A faulting event that displaced the slope surface vertically by ca. 0.5 m. This event was followed by deposition of colluvial wedge (Fig. 4; Unit 3) that did not yield reliable age determination (Fig. 5). During the build up of this colluvial wedge, a weak AC soil profile was developed. The soil is composed of an organic A horizon and a C horizon composed of brown silty-clay matrix, weak soil structure (angular) with no calcic nodules or any other secondary deposition.
Fig. 5
Fig. 5Age of earthquake events found in the studied trenches (for location, see Fig. 2). Age determined using OSL (solid diamonds; Table 1) or according to field considerations (solid diamonds with question marks). Also shown are: ages of landslide events (squares) and the age of the slopes away from the fault trace at the different trench sites (open diamonds). Error bars are from Table 1.
Katz et al (2009)
Phase 2 - A second event dated to about 5±0.3 ka (Table 1; Fig. 5) displaced the slope surface vertically by about 0.8 m (Fig. 4). This event caused the deposition of a short colluvial wedge (Unit 4) that buried part of the previous slope (Unit 3). The most indicative feature characterizing the two colluvial wedges is two organic horizons located at the top of each wedge. The soil developed along colluvial wedge 4 is more developed than the soil that was buried by colluvial wedge 3, suggesting a longer time of soil formation.
To summarize, the slope at the site of Trench TEG-0 was faulted at least twice (Fig. 5), with the second event occurring during the upper Holocene (ca. 5 ka). The weakly developed soil proile in colluvial Unit 3 might indicate that the first event was close in time to the second event (ca. 5 ka), probably occurred during the Holocene. The fresh rocky free face exposed further north along the fault suggests that an additional, third, faulting event, might have occurred after the last dated event (i.e., LT 5 ka).
- from Katz et al (2009)
Fig. 6
Log of the southern wall of trench TEG-III (for location, see Fig. 2)
Katz et al (2009)
Fig. 5
Fig. 5Age of earthquake events found in the studied trenches (for location, see Fig. 2). Age determined using OSL (solid diamonds; Table 1) or according to field considerations (solid diamonds with question marks). Also shown are: ages of landslide events (squares) and the age of the slopes away from the fault trace at the different trench sites (open diamonds). Error bars are from Table 1.
Katz et al (2009)
Phase 1: A faulting event that displaced the slope surface vertically but with unknown displacement magnitude. This event was followed by deposition of gravelly alluvial material on top of the faulted block by a local alluvial fan draining the eastern steep slopes (Unit 1; Fig. 6). The age of the alluvial material, mostly reworked gravel from the Hordos Fm., is be tween 47.4±4 and 53±8 ka (Fig. 5). No soil was found on top of the gravelly material, suggesting a short time between the deposition of the alluvium and the burial of the down faulted block by the colluvial unit (Unit 2; Fig. 6).
Phase 2: A second faulting event displaced the slope by about 0.5 m, followed by the deposition of colluvial Unit 2 on top of Unit 1 (Fig. 6). This colluvial wedge (Unit 2) is composed of a large amount of intensely jointed and shattered rock blocks (ca. 50% of the rock blocks), most of which were derived from the fault zone and shattered in situ (e.g., 6b Fig. 6). This shattering (Fig. 7) is indicative of fault zones (Sagy et al., 2001; Katz et al., 2003). The paleosol developed in the colluvium (Unit 2) is calcic soil stage I, the silty–clay matrix is slightly cemented by calcium carbonate, with no clear calcic nodules or clay cutans and a low amount of organic material. The degree of soil development indicates a short time period of surface exposure. This event occurred at ca. 36±3 ka, a short time (several thousand of years) after the deposition of the alluvium of phase 1 (Figs. 5, 6).
Fig. 7
Figure 7Highly fractured bedrock of Ein-Gev Fm. (marked by dashed ellipse) bounding the fault exposed in trench TEG-III (Unit 6b in Fig. 6).
Katz et al (2009)
Phase 3: A third faulting event displaced the surface by ca. 0.15 m. The colluvial wedge (Unit 3; Fig. 6) formed after this faulting event is composed mainly of silty–clay ine material and 20–30% gravel. Calcic soil developed in this unit reaches stage IV, with a Bk horizon. The upper 0.2–0.3 m has a high amount of root holes, fragments of snail shells, and borrows. Patinated gravel and rock fragments are scattered in the colluvial material derived from the damaged, faulted slope. In contrast to colluvial Unit 2, the degree of soil development in colluvial Unit 3 supports a long time period of slope stability. The colluvium age is 40±3, indistinguishable from phase 2 (Fig. 5).
Phase 4: A faulting event that displaced the slope by about 0.4 m (Fig. 6) occurred at ca.10±0.8 ka (Fig. 5), after a long period of quiescence (ca. 35 ka). The event was followed by the deposition of colluvial Unit 4 (Fig. 6). Most of the colluvium is composed of ine material (silty–clay) with a small amount of gravel and rock fragments. Most of the rock fragments are patinated, indicating sources from the pre-faulted slope surface. The soil of Unit 4 is calcic, with a clear organic A horizon and a B horizon slightly cemented by calcium carbonate. The lower part of the soil is less cemented by calcium carbonate, followed by deposition of gypsum mycelia.
To summarize, this slope has a long history of tectonic activity, only part of which is exposed in the trench. At least four events were identified (Fig. 5): three events during the upper Pleistocene and one during the Early Holocene after a long period of quiescence.
- from Katz et al (2009)
Fig. 8
Log of the southern wall of trench TEG-I (for location, see Fig. 2)
Katz et al (2009)
Phase 1: Displacement of colluvial Unit 3 by about 1.60 m, which occurred ca. 35±3 ka. The faulted unit is composed of sand (coarse and fine) with a small amount of silt and gravel, 3–4 cm in size. The gravel consists of sandstone, limestone, and chert. Calcic soil developed in this unit and reached stage II-III, with calcium carbonate enveloping the gravel and disseminated in the sandy matrix. The age of this unit at the downthrown block is 251±14 ka (Fig. 8); this should be considered a minimum age. At the fault zone and at the up-thrown block close to the surface of Unit 3, the ages are 102±8 ka and 107±8 ka, respectively. The colluvial Unit 2, deposited on top of Unit 3 on the down thrown block (Fig. 8), consists of massive clay–silty colluvium mixed with small gravel (3–5 cm). A calcic soil developed in this unit and reached stage II-III. Most of the calcium carbonate is deposited at the up per 1 m of the unit, its amount decreasing downward. Orthic and disorthic calcium carbonate nodules are scattered in the fine matrix, most of them ca. 0.5 cm. Some of the gravel is coated with calcic crust. The disorthic nodules and the coated clasts scattered in the colluvium are a result of soil erosion and deposition on the down-faulted block. The orthic calcic nodules were formed during the quiescence in between the tectonic events.
Phase 2: A second tectonic event occurred at 9.2±1.9 ka, displacing the slope surface by ca. 0.4 m (Fig. 8). As a result, colluvial Unit 1 was deposited on the downthrown block and covered the entire slope. This colluvial unit (Unit 1) consists of non-sorted gravel ranging between 0.03 m and 0.2 m. In addition, 0.005-0.01 m granules are scattered in the matrix. The matrix consists of silt and fine sand, with a high amount of organic material. A weak clayey-gypsic soil developed continuously along the slope and welded into the calcic soil at Unit 2.
We identified two events in trench TEG-I, one event at ca. 35 ka (Fig. 5) and the other at ca. 9 ka. The well developed soil in Unit 2 and the weak soil profile in Unit 1 suggest long quiescence between events.
Fig. 5
Fig. 5Age of earthquake events found in the studied trenches (for location, see Fig. 2). Age determined using OSL (solid diamonds; Table 1) or according to field considerations (solid diamonds with question marks). Also shown are: ages of landslide events (squares) and the age of the slopes away from the fault trace at the different trench sites (open diamonds). Error bars are from Table 1.
Katz et al (2009)
| Effect | Location | Image(s) | Description | Intensity | ||||||||||||||||||
|---|---|---|---|---|---|---|---|---|---|---|---|---|---|---|---|---|---|---|---|---|---|---|
| Landslide | TEG-0
Figure 2 Morphotectonic map of the studied area (coordinates are in Israeli TM grid). The map is based mainly on areal photos (dated 1945), interpretation, and complementary field work. Mapped are all lineaments, landslides, fluvial systems (with sites of channel displacement marked by open black circle) and alluvial fans located within the study area. Also shown are the sites of the paleoseismic trenches and the highest shore line of the Sea of Galilee, 170 m below sea level, achieved at 25 ka (Hazan et al., 2005). JW: Ein Gev landslides are shaded purple Katz et al (2009) |
|
7.7-9.2 |
- Environmental Effects (ESI 2007)
 Graphic Representation of
ESI 2007 Intensity
Graphic Representation of
ESI 2007 Intensity
Click on image to open in a new tab
- Synoptic Table of ESI 2007
Intensity Degrees from Michetti et al. (2007)
 Synoptic Table of ESI 2007
Intensity Degrees
Synoptic Table of ESI 2007
Intensity Degrees
Accuracy improves in higher degrees, especially VIII–XII.
Click on image to open in a new tab
Michetti et al. (2007)

| Effect | Location | Image(s) | Description | Intensity |
|---|---|---|---|---|
| Fault Scarp | En Gev |
|
8-9 |
- from Amit. R., Katz, O., Yagoda-Biran G., Hatzor, Y.H., 2009. Paleoseismology of the eastern Sea of Galilee . Dead Sea Workshop Field Guide. 49-53.
- Note that trench names changed from Amit et al. (2009) to Katz et al (2009)
- TEG-A became TEG-0
- TEG-B became TEG-III
- TEG-C became TEG-I
 Figure 1
Morphotectonic map of the Eastern Sea of Galilee
Amit et al. (2009)
Field guide
The study site is located between the western slopes of the Golan Heights and the eastern coast of the Sea of Galilee (Fig1) in a seismically active area as part of the Dead Sea Rift (DSR). In this area landslides and faulted and tilted blocks shape the steep, 600 m high slopes of the southern Golan Heights. The Miocene–to-Quaternary sequence which is exposed on these slopes is composed of sedimentary rocks such as marls, sand, fluvial sediments, lake sediments and basalts of Pliocene-Pleistocene age. This geological setting and lithology enhance development of compound landslides of several kinds (e.g. earth flow, slump, creep) with slide units comprising, in places, complete rock sequences. The faulting, the westward dipping strata and the steep slopes play significant roles in the sliding process, resulting in a terraced morphology of these steep slopes.
Three trenches were opened crossing three of the mapped N-S oriented normal faults composing 800 m wide fault zone (Fig 1). These faults are ~ 200 m apart from each other, crossing a series of tilted blocks .
TEG –A (Fig 2a)
A normal fault displacing the slope of one of the tilted blocks. This tilted block is composed mainly of intercalation of chalky limestone (slightly sandy) of the Maresha Formation (Middle Eocene). The fault scarp is partly covered by colluvial material towards the top and part of the scarp has a free face exposing the chalky limestone of the Maresha Formation. The paleoseismological analysis revealed that the fault is a multiple type with two identifiable faulting events. The age of the faulted slope is between 47±8 ka and 3.5±1.4. The slope which was stable during the upper Pleistocene was faulted twice during the Holocene with one event during the early Holocene (~ 11 ka) displacing ~ 1m (colluvial wedge 3) and another event during the late Holocene (~ 3.5 ka) displacing ~80 cm (colluvial wedge 4). The fresh rocky free face, which is exposed more to the north along the fault trace, might suggest that an additional faulting event occurred later than the last dated event (LT 3.5±1.4 ka).
Fig. 2a
Paleoseismic trenches: Two events: ~ 11ka and ~4ka
Amit et al. (2009)
TEG –B (Fig 2b)
A normal eastern fault crossing a tilted block is displacing the Hordos and En Gev formations. The faulted slope has a minimal age of 78.6±13 ka. Three events were identified; two that occurred close in time (during the late Pleistocene) and one that occurred during the Holocene after a long quiescence of about 35 ky. The last event, which occurred ~ 5.7±2.2 ka, displaces the slope by ~ 40 cm and was also detected in trench TEG – A, a parallel fault line located more to the west (Fig 1).
Fig. 2b
Paleoseismic trenches: two events: ~40ka and ~4 ka
Amit et al. (2009)
TEG –C (Fig 2c)
A fault displacing the toe of the two landslides in the study site was trenched (Fig 1). The trench was opened along the southern margin of the southern landslide (Fig 1). The trenched area is composed mostly of colluvial material (unit 3) partly derived from the white-yellowish sandstone of the En-Gev formation exposed at the upper part of the slope (unit 5) and partly composed of limestone and chert lithoclasts. The colluvium is mostly rock supported with large angular rock blocks, some of which reach 50 cm, and gravel ~ 15 cm. The matrix is composed of unsorted coarse silt, sand, grit and granules. Calcic soil developed in this unit. The calcium carbonate envelopes the gravel and is disseminated in the sandy matrix. The soil reached stage II-III. At the fault zone, which is ~ 1 m wide, the colluvial unit 3 and 1 are intensely cracked and jointed (between 1–2 mm and 5-10 cm wide joints) (Fig 2).
Phase 1: Displacement of unit 3 by about 1.60 m which occurred ~ 37±3 ka (at TEG - C ~ 36 ka). The faulted unit is composed of sand (coarse and fine) with small amounts of silt and gravel of 3-4 cm size. The gravel is composed of sandstone, limestone and chert. Calcic soil developed in this unit and reached stage II-III with calcium carbonate enveloping the gravel and disseminated in the sandy matrix. The age of this unit in the downthrown block is 255±19 ka (Fig 2c; TEG-45). At the fault zone (Fig 2c; TEG-43) and in the upthrown block close to the surface (Fig 2c; TEG 46) the age of unit 3 is 97±18 and 99±12 ka, respectively. The colluvial unit 2 which is deposited on top of unit 3 on the downthrown block is composed of massive clay-silty colluvium mixed with small gravel (3-5 cm). A calcic soil developed in this unit and reached stage II-III. Most of the calcium carbonate is deposited in the upper 1 m of the unit, with decreasing amounts downward. Orthic and disorthic calcium carbonate nodules are scattered in the fine matrix, most of them ~ 2 mm. Some of the gravel is coated with calcic crust. The disorthic nodules and the coated clasts scattered in the colluvium are the result of soil erosion and deposition on the downfaulted block. The orthic calcic nodules were formed during the quiescence in between the tectonic events.
Phase 1: The second tectonic event occurred ~ 9 ka ago (Fig 2c), displacing the slope by ~40 cm. As a result, colluvial unit 1 was deposited on the downthrown block and covered the whole slope. This colluvial unit (unit 1) is composed of unsorted gravel which ranges between 20 cm, the largest, and 3 cm, the smallest. In addition, granules of the size of 0.5 – 1 cm are also scattered in the matrix. The matrix is composed of silt and fine sand and a high amount of organic material. A weak clayey-gypsic soil developed continuously along the slope and integrated into the calcic soil at unit 2.
Two events were identified in this trench. One occurred at ~ 37 ka (Fig.2c ;TEG-42: 37±3) and another occurred ~ 9 ka ago (TEG- 44; 9.2±1.9). The well-developed soil in unit 2 and the weak soil profile in unit 1 point to a long quiescence between events.
Summary
The oldest event occurred ~ 37 ka ago and was detected in two of the trenches, TEG-B and TEG-C. Another event occurred ~ 11 ka ago and was detected in all three trenches studied. The youngest event was detected in TEG-A and occurred ~3 ka ago.
A magnitude of Mw 6.6 was estimated. The calculated magnitude ranges between Mw 6.3 and Mw 6.8 and was estimated as Mw 6.6. The recurrence time of large earthquakes on this segment is ~ 9 ky.
Fig. 2c
Paleoseismic trenches: Two events: ~40ka and ~10ka
Amit et al. (2009)