al Harif Aqueduct

Displaced Al-Harif aqueduct in Google Earth - click on image to explore this site on a new tab in Google Earth
Right - Fig. 13
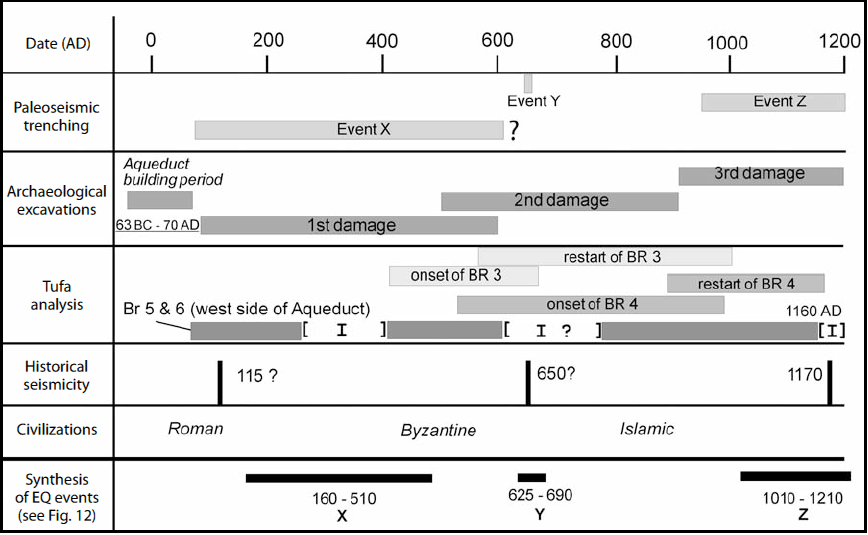
Correlation of results among paleoseismic trenching, archaeoseismic excavations, and tufa analysis. In paleoseismic trenching, the youngest age for event X is not constrained, but it is, however, limited by event Y. In archaeoseismic excavations, the period of first damage overlaps with that of the second damage due to poor age control. In tufa analysis, the onset and restart of Br-3 and Br-4 mark the damage episodes to the aqueduct; the growth of Br-5 and Br-6 shows interruptions (I) indicating the occurrence of major events. Except for the 29 June 1170 event, previous events have been unknown in the historical seismicity catalogue. The synthesis of large earthquake events results from the timing correlation among the faulting events, building repair, and tufa interruptions (also summarized in Fig. 12 and text). Although visible in trenches (faulting event X), archaeoseismic excavations (first damage), and first interruption of tufa growth (in Br-5 and Br-6 cores), the A.D. 160–510 age of event X has a large bracket. In contrast, event Y is relatively well bracketed between A.D. 625 and 690, with the overlapped dating from trench results, the second damage of the aqueduct, and the interruption and restart of Br-3 and onset of Br-4. The occurrence of the A.D. 1170 earthquake correlates well with event Z from the trenches, the age of third damage to the aqueduct, and the age of interruption of Br-4, Br-5, and Br-6.
Sbeinati et al (2010)
- Fig. 3 Location Map from
from Sbeinati et. al. (2010)
 Fig. 3
The 90-km-long Missyaf fault segment and the Al Harif Roman aqueduct site. The back-ground topography (SRTM 30 arc posting digital elevation model; Farr and Kobrick, 2000) clearly delineates the fault segment (arrowheads) in between the Ghab and Al Boqueaa pull-apart basins. The Roman aqueduct at Al Harif (see also Fig. 4) was designed to bring freshwater from western ranges to Apamea and Shaizar. LRB — Lebanese restraining bend.
Sbeinati et al (2010)
- Fig. 3 Location Map from
from Sbeinati et. al. (2010)
Fig. 3
The 90-km-long Missyaf fault segment and the Al Harif Roman aqueduct site. The back-ground topography (SRTM 30 arc posting digital elevation model; Farr and Kobrick, 2000) clearly delineates the fault segment (arrowheads) in between the Ghab and Al Boqueaa pull-apart basins. The Roman aqueduct at Al Harif (see also Fig. 4) was designed to bring freshwater from western ranges to Apamea and Shaizar. LRB — Lebanese restraining bend.
Sbeinati et al (2010)
- Displaced Al-Harif aqueduct in Google Earth
Displaced Al-Harif aqueduct in Google Earth
click on image to explore this site on a new tab in Google Earth

Figure 5
Microtopographic survey (0.05 m contour lines) of the Al-Harif aqueduct and related flat alluvial terrace. The aqueduct (thin blue crosses) shows a total of 13.6 ± 0.20 m left-lateral slip along the fault zone (Meghraoui et al., 2003).
Roman numbers indicate archaeoseismic excavations (in red-dish and orange, labeled 1 to IV)
Letters indicate paleoseismic trenches (in gray and black, labeled A, B, C, and E).
The dragged wall fragment is located between excavation IV and trench E and is marked by a dense cluster of survey points.
Sbeinati et. al. (2010)

Figure 10 A
Trench logs A, B, and C north of the aqueduct site (see location in Fig. 5). All trenches display the Dead Sea fault zone as a negative flower structure affecting all alluvial units below unit a. Calibrated 14C dates are in Table 1. Fault branches in trench C are labeled 1 to V (see text for explanation). The sedimentary units are very comparable and show three to four faulting events denoted W to Z (see text for explanation). Trench log A is in meters.
Sbeinati et. al. (2010)

Legend
Sbeinati et. al. (2010)

Figure 10
Trench logs A, B, and C north of the aqueduct site (see location in Fig. 5). All trenches display the Dead Sea fault zone as a negative flower structure affecting all alluvial units below unit a. Calibrated 14C dates are in Table 1. Fault branches in trench C are labeled 1 to V (see text for explanation). The sedimentary units are very comparable and show three to four faulting events denoted W to Z (see text for explanation). Trench log A is in meters.
Sbeinati et. al. (2010)
Legend
Sbeinati et. al. (2010)

Figure 10C
Trench logs A, B, and C north of the aqueduct site (see location in Fig. 5). All trenches display the Dead Sea fault zone as a negative flower structure affecting all alluvial units below unit a. Calibrated 14C dates are in Table 1. Fault branches in trench C are labeled 1 to V (see text for explanation). The sedimentary units are very comparable and show three to four faulting events denoted W to Z (see text for explanation). Trench log A is in meters.
Sbeinati et. al. (2010)
Legend
Sbeinati et. al. (2010)

(B) Mosaic of excavation 1 exhibits the main fallen wall (A and B) and dragged wall piece (C), scattered wall pieces and the fault zone; note also location of cement sample CS-1-4 (see text for explanation).
(C) Trench E (excavation 1, north wall) exposes faulted sedimentary units below the archaeological remains and wall fragment C visible in bottom of Figure 8B
fz-fault zone
sedimentary units are similar to those of trenches A, B, and C (see also Fig. 10); and dating characteristics are in Table 1.
- a - present-day soil and alluvial terrace (plough zone)
- d—reddish alluvial fine gravel
- e—dark-brown silty clay (with rich organic matter)
- f—gravels and pebbles in silty-clay matrix
- g—massive gey clay with scattered gravels
Sbeinati et. al. (2010)

Figure 14
Schematic reconstruction (with final stage from Fig. 5) of the A.D. 160-510, A.D. 625-690, and A.D. 1170 large earthquakes and related faulting of the Al Harif aqueduct. Except for the A.D. 1170 earthquake (see historical cata-logue of Sbeinati et al., 2005), the dating of earthquake events are from Figure 12. The white small section is the rebuilt wall after event X (see buried wall A and B in Fig. 8B); the subsequent gray piece corresponds to the rebuilt wall after event Y (see wall section C in Fig. 8B), which was damaged and dragged after event Z. The earlier aqueduct deformation (warping of the eastern wall near the fault rupture) may have recorded —4.3 m of coseismic left-lateral slip that remained relatively well preserved during the subsequent fault movements.
Sbeinati et. al. (2010)
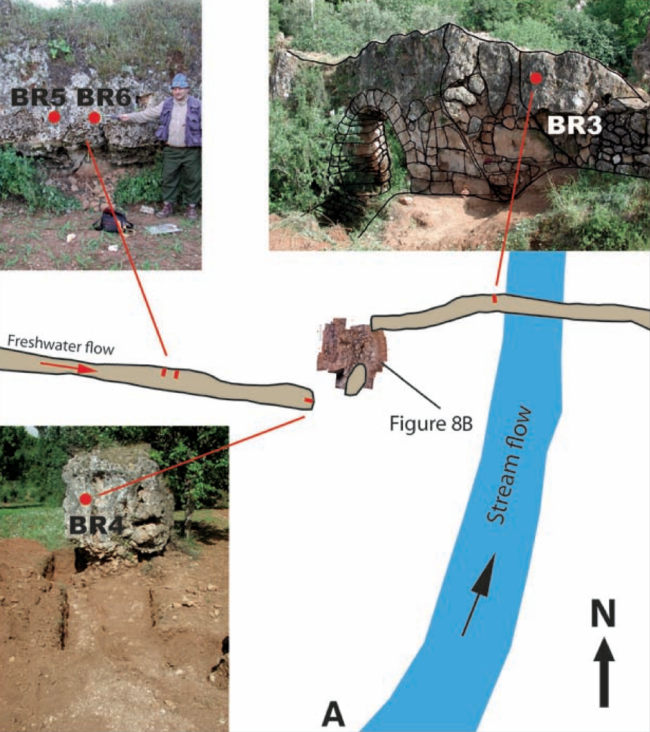
Figure 6 (A)
Schematic sketch of the aqueduct and locations of the selected cores BR-3, BR-5, and BR-6; BR-4 core sample consists of tufa accumulations at the location of the missing (broken) piece of the aqueduct wall near the fault. Mosaic of the archaeological excavation I is detailed in Figure 8B (see also location in Fig. 5).
Sbeinati et. al. (2010)

Figure 7
Schematic sections of the aqueduct western wall and related tufa deposits (B, C, D, and E indicate earlier core sections of tufa deposits (Meghraoui et al., 2003). Tufa samples AQ-Tr-B13 and AQ-Tr-D5 (Table 1) are from cores B and D, respectively. The right and left vertical sections show the relative tufa thickness of the originally built part (with Opus caementum and quadratum stones) and the rebuilt part, respectively. The plan view indicates the variation of tufa deposition and shows the core distribution and related thickness along the western wall of the aqueduct.
Sbeinati et. al. (2010)

Figure 11
Synthetic description of cores with lithologic content and sample number for radiocarbon dating (see Table 1 and Fig. 6 for core locations)
I stands for major interruption.
The very porous tufa indicates major interruptions in tufa growth (e.g. a major interruption of core growth in BR-3 is visible at —22 cm (Br-3-4 sample; see text for explanation). The correlation between major interruptions of tufa growth and faulting events in trenches and archaeoseismic building constrains the timing of repeated earthquakes along the Missyaf segment of the Dead Sea fault.
Sbeinati et. al. (2010)
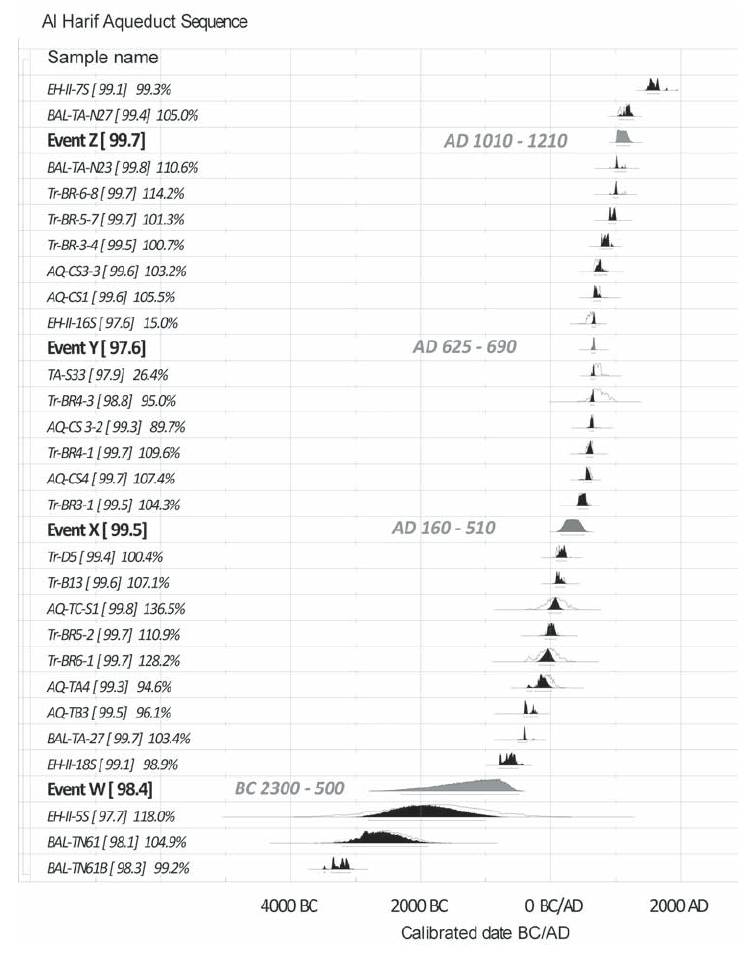
Fig. 12 (A)
Calibrated dating of samples (with calibration curve INTCAL04 from Reimer et al. [2004] with 2σ age range and 95.4% probability) and sequential distribution from Oxcal pro-gram (see also Table 1; Bronk Ramsey, 2001). The Bayesian distribution computes the time range of large earthquakes (events W, X, Y, and Z) at the Al Harif aqueduct according to faulting events, construction and repair of walls, and starts and interruptions of the tufa deposits (see text for explanation). Number in brackets (in %) indicates how much the sample is in sequence; the number in % indicates an agreement index of overlap with prior distribution.
Sbeinati et al (2010)
Correlation of results among paleoseismic trenching, archaeoseismic excavations, and tufa analysis. In paleoseismic trenching, the youngest age for event X is not constrained, but it is, however, limited by event Y. In archaeoseismic excavations, the period of first damage overlaps with that of the second damage due to poor age control. In tufa analysis, the onset and restart of Br-3 and Br-4 mark the damage episodes to the aqueduct; the growth of Br-5 and Br-6 shows interruptions (I) indicating the occurrence of major events. Except for the 29 June 1170 event, previous events have been unknown in the historical seismicity catalogue. The synthesis of large earthquake events results from the timing correlation among the faulting events, building repair, and tufa interruptions (also summarized in Fig. 12 and text). Although visible in trenches (faulting event X), archaeoseismic excavations (first damage), and first interruption of tufa growth (in Br-5 and Br-6 cores), the A.D. 160–510 age of event X has a large bracket. In contrast, event Y is relatively well bracketed between A.D. 625 and 690, with the overlapped dating from trench results, the second damage of the aqueduct, and the interruption and restart of Br-3 and onset of Br-4. The occurrence of the A.D. 1170 earthquake correlates well with event Z from the trenches, the age of third damage to the aqueduct, and the age of interruption of Br-4, Br-5, and Br-6.
Sbeinati et al (2010)

Figure 9
Excavations II (A) and III (B) that expose the aqueduct wall foundation (see also Fig. 5) and related sedimentary unit e underneath. The difference in the size of stones between excavation II (A) and excavation III (B) implies a rebuilding phase of the latter wall.
Sbeinati et. al. (2010)
Figure 5
Microtopographic survey (0.05 m contour lines) of the Al-Harif aqueduct and related flat alluvial terrace. The aqueduct (thin blue crosses) shows a total of 13.6 ± 0.20 m left-lateral slip along the fault zone (Meghraoui et al., 2003).
Roman numbers indicate archaeoseismic excavations (in red-dish and orange, labeled 1 to IV)
Letters indicate paleoseismic trenches (in gray and black, labeled A, B, C, and E).
The dragged wall fragment is located between excavation IV and trench E and is marked by a dense cluster of survey points.
Sbeinati et. al. (2010)
Two trenches, B and C (Figs. 5 and 10, trenches B and C), were dug across the Dead Sea fault north of the aqueduct in addition to the previously studied trench, A (Fig. 10A; Meghraoui et al., 2003). The two trenches exposed an ~1.5-m- wide fault zone that affects a succession of 2–3-m-thick fine and coarse alluvial sedimentary layers similar to the alluvial deposits of trench A. Alluvial units visible in all trenches exhibit here similar textures, structures, and color, and correspond to the same layers that belong to the same alluvial terrace. Although the three trenches A, B, and C may not expose a completed stratigraphic section, the comparisons among sedimentary units, faulting events, archaeoseismic observations, and tufa accumulation limit the possibility of a missing earthquake event that affected the aqueduct.
Figure 10
Trench logs A, B, and C north of the aqueduct site (see location in Fig. 5). All trenches display the Dead Sea fault zone as a negative flower structure affecting all alluvial units below unit a. Calibrated 14C dates are in Table 1. Fault branches in trench C are labeled 1 to V (see text for explanation). The sedimentary units are very comparable and show three to four faulting events denoted W to Z (see text for explanation). Trench log A is in meters.
Sbeinati et. al. (2010)
In trench B (south wall), the fault zone shows three main fault branches that affect sedimentary units g to d and form a negative flower structure. The central and western main branches are truncated by unit a, which forms a stratified 0.3–0.4-m-thick deposit of coarse gravels in a sandy matrix. The eastern fault branch is buried below unit d, made of well-sorted reddish fine gravels. Unit e, a 0.2–0.5-m-thick dark-brown silt-clay, thickens toward east. Units f and g are made of scattered clasts in a massive clay matrix of dark-brown and light-brown color, respectively. Although intense warping and faulting are marked by contrasting color and texture of unit e, faulted sedimentary layers of this trench do not allow the identification of all faulting events. However, buried fault branches indicate a faulting event postdated by unit d (event Y), while the other fault branches show at least another faulting event (event Z) overlain by unit a. While clearly visible in other trench walls, event Y is here likely concealed by the complex fault branches truncated by unit a.
Figure 10C
Trench logs A, B, and C north of the aqueduct site (see location in Fig. 5). All trenches display the Dead Sea fault zone as a negative flower structure affecting all alluvial units below unit a. Calibrated 14C dates are in Table 1. Fault branches in trench C are labeled 1 to V (see text for explanation). The sedimentary units are very comparable and show three to four faulting events denoted W to Z (see text for explanation). Trench log A is in meters.
Sbeinati et. al. (2010)
Trench C (Fig. 10C) exposes a stratigraphic succession affected by at least five main fault branches (labeled I to V in Fig. 10C). From trench bottom, fault branch I, which affects unit g, is overlain by unit f. A similar observation can be made for fault branch II, which also affects all units below unit d. Furthermore, the trench wall exposes an ~0.60-m-thick well- stratified, coarse and fine gravel layer above unit e and across the fault zone. Unit d thins significantly west of fault branch III and is overlapped by relatively thick coarse gravel units, which display a mix of fine and coarse gravels between fault branches III and IV, and unit d shows a succession of well-stratified alluvial units west of fault branch IV (Fig. 10C). Taking into account its alluvial origin made of well-stratified fine and coarse gravels, west of fault branch IV, unit d is subdivided into d1, d2, d3, and d4. Faulting movements at this site allows truncation of unit d1 (equivalent to d east of fault branch III) and sedimentation of units d2 to d4 (in a likely small pull-apart basin). Unit d3 consists of an ~0.20-m-thick dark-brown silt-sand overlain by unit d4, which is made of light-brown fine silt-sand. Below the plough zone a2, the well-stratified unit a1 shows flat-laying pebbles and gravels and intercalated fine gravels covering previous units and the fault zone.
Fault branches I to V in trench C indicate a negative flower structure that intersects a sedimentary sequence and reveal at least four faulting events (Fig. 10C):
- Event W, identified on fault branch I, is older than 800–510 B.C. (EH II-18S) in the lowermost layers of unit f and is younger than unit g, which was dated with sample EH II-5S (3400–300 B.C.).
- Next to fault branch II, buried below unit d, the vertical offsets between unit e and units d and d1 across fault branch III, and the absence of unit e between fault branches III and IV, determine the faulting event X between unit e and unit d. Since unit d overlies an erosional surface of unit e, faulting event X may have formed a depression (i.e., a small pull-apart basin) that allowed the deposition of d1 to d4 next to a thick unit d east of fault branch III. The faulting event X is here predated by 360–90 B.C. (EH II-12S), 360–50 B.C. (EH II-11S), and 360–60 B.C. (EH II-10S) of the uppermost layers of unit f (event X is postdated by sample EH I-TA-S33 of trench A).
- Faulting event Y can be identified at the westernmost fault branch V between unit d2 and unit d3. The dating of sample EH II-16S in d3 postdates event X to younger than A.D. 540–650, which we consider as a reliable age, taking into account its high carbon content (event Y is predated by sample EH I-TA-S33 of trench A).
- Faulting event Z corresponds to the main fault branches III and IV, which are overlain by the stratified unit a2 below the plough zone. Fault rupture IV affects unit d4 and indicates that the faulting event Z is older than radiocarbon age A.D. 1480–1800 (EH II-7S) and A.D. 1510–1670 (EH II-2N) of unit a2 and younger than unit d4.
Figure 6 (A)
Schematic sketch of the aqueduct and locations of the selected cores BR-3, BR-5, and BR-6; BR-4 core sample consists of tufa accumulations at the location of the missing (broken) piece of the aqueduct wall near the fault. Mosaic of the archaeological excavation I is detailed in Figure 8B (see also location in Fig. 5).
Sbeinati et. al. (2010)
The tufa thickness accumulated on the northern face of aqueduct wall suggests a continuous water flow during a relatively long period of time and may include the record of large earthquakes that affected the aqueduct. Hence, the relationships between tufa accumulation and earthquake events are established through the simultaneous major tufa interruptions and restarts observed in different cores. Except during major changes in the water-flow conditions, the permanent water flow coming from the nearby spring was responsible for the tufa accumulation that, in principle, is not interrupted on the western wall section (with regard to the fault). On the eastern wall section (and bridge) and broken pieces of western wall, however, the tufa accumulation was likely episodic due to the earthquake damage and related faulting events; new tufa accumulation appears in subsequent building-repair. Previous radiocarbon dating of early tufa deposits (A.D. 70–230 and A.D. 80–240; Table 1) postdated the initial construction of the aqueduct and revealed a Roman age consistent with the dates obtained from the archaeological and paleoseismic investigations (Meghraoui et al., 2003).
Figure 11
Synthetic description of cores with lithologic content and sample number for radiocarbon dating (see Table 1 and Fig. 6 for core locations)
I stands for major interruption.
The very porous tufa indicates major interruptions in tufa growth (e.g. a major interruption of core growth in BR-3 is visible at —22 cm (Br-3-4 sample; see text for explanation). The correlation between major interruptions of tufa growth and faulting events in trenches and archaeoseismic building constrains the timing of repeated earthquakes along the Missyaf segment of the Dead Sea fault.
Sbeinati et. al. (2010)
Six tufa cores (named Tr-B13, Tr-D5, and BR-3, BR-4, BR-5, and BR-6) reaching the stone construction were collected from the aqueduct wall in order to date major catastrophic events and infer the relationship with large earthquakes (Fig. 11). Tr-B13 and Tr-D5 were previously collected and analyzed mainly to date the early tufa deposits, which provide the maximum age of the aqueduct construction (Meghraoui et al., 2003). A subsequent selection of core locations on both eastern and western sections of the aqueduct wall was performed to study the completed tufa accumulation and successive growth. Figures 6 and 7 show the drilled wall location with the early cores Tr-B13 and Tr-D5 and three cores (BR-4, BR-5, and BR-6) on the western wall and one core (BR-3) on the eastern wall next to the bridge. Cores BR-5 and BR-6 correspond to the thickest tufa section. BR-4 is on the eastern edge of the west aqueduct wall, a section probably exposed after earthquake damage that induced the collapse of a 2.5-m-long wall section next to the fault zone. Each core is described to illustrate fabric (structure, texture, and color) and lamination changes, which provide evidence of tufa precipitation and successive growths (Fig. 11). Although marked by a high porosity, the cores were carefully drilled in order to preserve their structure and length continuity. An analysis in progress of cores using computer tomography (CT) and climatic-stratigraphy correlation details the physico-chemical and biochemical processes of tufa growth (Grootes et al., 2006). The cores show a variety of porous, dense, and biogenic tufa with growth laminae and stromatolitic markers of different colors. The end of tufa growth (i.e., very porous tufa in Fig. 11) and onset of biogenic tufa (indicating only a seasonal growth) can be interpreted as episodes of decreased accumulation, or a significant decrease in the chemical precipitation due a major change in the environmental conditions (Fig. 11). Discontinuities of tufa deposits marked by the interruption of core growths and initiation of biogenic tufa are interpreted as major changes in environment with a possible correlation with large earthquakes. The early tufa deposits on the aqueduct wall provide A.D. 70–230 and A.D. 80–240 (samples Tr-B13 and Tr-D5 in Table 1) ages, which postdate the aqueduct building and early function (Meghraoui et al., 2003). The tufa accumulation in BR-3 (core in eastern wall near the bridge, Fig. 6) started sometimes before A.D. 410–600 (sample Br 3-1, Table 1) and may have resulted from a repair of the aqueduct with water overflowing the eastern wall (and bridge) after a major damaging event. Similarly, the location of a growth interruption (very porous tufa, Fig. 11) in BR-5 at ~6 cm after Br-5-2 (110 B.C.–A.D. 130) and onset of biogenic tufa in BR-6 after Br-6-1 (400 B.C.–A.D. 250) coincide with the occurrence of the first damaging event X. In parallel, the beginning of BR-4 and tufa accumulation at the damaged eastern edge of the western wall (Fig. 6) and sample Br-4-1, dated A.D. 530–660 (Fig. 11; Table 1), postdates the occurrence of a major damaging event. Both Br-3-1 and Br-4-1 postdate here the record of a major damaging event that affected the aqueduct. However, while BR-4 may have accumulated only after a major damage, BR-3 deposits could only have accumulated after the repair of the aqueduct. It implies that the first major damaging event on the aqueduct took place between A.D. 70–230 and A.D. 410–600.
The interruption of tufa growth in BR-3 a few centimeters before sample Br-3-4, dated A.D. 770–940, probably resulted from a second damaging event. This observation coincides with the restart of BR-4 after a major interruption 3–4 cm after Br-4-3, dated at A.D. 540–980 (Fig. 11; Table 1). Furthermore, the sharp change (second interruption) from dense tufa to biogenic tufa in BR-5 and BR-6 may also have been contemporaneous with the damaging event. The age of this second damaging event can be bracketed between Br-4-3 (A.D. 540–980) and Br-3-4 (A.D. 770–940). Unless simply broken, the definite interruption of BR-3 (~10 cm after sample Br-3-4) marks the end of water overflow on the eastern aqueduct wall (and bridge) after the second damaging event.
The growth of dense tufa in BR-4 and biogenic tufa in BR-5 and BR-6 in the final sections of cores indicates a continuous water flow on the western aqueduct wall after the second damaging event. The almost simultaneous arrest of tufa growth ~2 cm after Br-5-7 (A.D. 890–1020), ~1 cm after Br-6-8 (A.D. 900–1160), and ~7 cm after Br-4-3 (A.D. 540–980) suggests the occurrence of a major damaging event. Indeed, the arrest of tufa accumulation (in core samples Br-3-4, Br-5-7, and Br-6-8) probably occurred after A.D. 900–1160 (Br-6-8, Table 1) and indicates the final stoppage of water flow over the aqueduct.
Correlation of results among paleoseismic trenching, archaeoseismic excavations, and tufa analysis. In paleoseismic trenching, the youngest age for event X is not constrained, but it is, however, limited by event Y. In archaeoseismic excavations, the period of first damage overlaps with that of the second damage due to poor age control. In tufa analysis, the onset and restart of Br-3 and Br-4 mark the damage episodes to the aqueduct; the growth of Br-5 and Br-6 shows interruptions (I) indicating the occurrence of major events. Except for the 29 June 1170 event, previous events have been unknown in the historical seismicity catalogue. The synthesis of large earthquake events results from the timing correlation among the faulting events, building repair, and tufa interruptions (also summarized in Fig. 12 and text). Although visible in trenches (faulting event X), archaeoseismic excavations (first damage), and first interruption of tufa growth (in Br-5 and Br-6 cores), the A.D. 160–510 age of event X has a large bracket. In contrast, event Y is relatively well bracketed between A.D. 625 and 690, with the overlapped dating from trench results, the second damage of the aqueduct, and the interruption and restart of Br-3 and onset of Br-4. The occurrence of the A.D. 1170 earthquake correlates well with event Z from the trenches, the age of third damage to the aqueduct, and the age of interruption of Br-4, Br-5, and Br-6.
Sbeinati et al (2010)
The analysis of field data in archaeoseismology, paleoseismology, and tufa coring provides some constraints on the successive past earthquakes along the Dead Sea fault at the Al Harif Roman aqueduct site (Figs. 12 and 13). The damage and repair of the aqueduct are here related to the total 13.6 m of left-lateral fault offset since construction of the aqueduct (Fig. 5). In addition, the tufa successive growth and interruptions visible in cores provide a direct relation between the water flow and the aqueduct function east and west of the fault zone. The correlation and timing coincidence between the faulting events visible in trenches, aqueduct construction damage and repair (see also Summary of Faulting Events from Archaeoseismology and Paleoseismology section), combined with tufa growth and interruptions, provide a better constraint on the timing of the successive large earthquakes:
Event W, observed in trench C, occurred before 800–510 B.C. (unit f) and after 3400–300 B.C. (unit g). This faulting event can be determined only in trench C and hence cannot be correlated with damaging events in the aqueduct archaeoseismic excavations and tufa cores. However, we suggest two possible ages for this event: (1) according to the textual inscriptions found in different archaeological sites in Syria, a damaging earthquake sequence around 1365 B.C. affected Ugharit near Latakia in Syria, and Tyre further south in Lebanon and east of the Dead Sea fault (Sbeinati et al., 2005) may be correlated to event W; or (2) the rate of sedimentation in unit f of trench C implies a minimum age of 962 B.C. for event W.
Event X, identified in trenches A and C between 350 B.C.– A.D. 30 and A.D. 532–641, postdates the construction of the aqueduct (younger than 65 B.C., i.e., the onset of Roman time in the Middle East and younger than A.D. 70–230 of early tufa deposits). Event X also predates the onset of BR-3 tufa growth (see Br-3-1 dated A.D. 410–600). Similarly, the tufa growth interruption in BR-5 (after Br-5-2 dated 110 B.C.–A.D. 130) and onset of tufa in BR-6 (after Br-6-1 dated 400 B.C.–A.D. 250) coincide with the occurrence of the first damaging event X. The first earthquake faulting that damaged the aqueduct took place between A.D. 70–230 and A.D. 410–600.
Event Y is younger than A.D. 650–810 (unit d in trench A) and older than A.D. 540–650 (unit d3 in trench C). This event postdates the first rebuilding phase of the aqueduct recognized from the fallen wall in excavation I and related cement sample AQ-CS-4 (A.D. 532–641) and tufa sample AQ-CS-3-2 (A.D. 560–690). Event Y predates the dragged wall fragment and related cement sample AQ-CS-1 (A.D. 650–780) and tufa sample AQ-CS-3-3 (A.D. 639–883; Table 1). Core samples of tufa deposits provide a bracket of the second damaging earthquake faulting between Br-4-3 (A.D. 540–980) and Br-3-4 (A.D. 770–940). The second interruption in both BR-5 and BR-6 may also have been contemporaneous with the damaging event. Taking into account only the archaeoseismic results, we can conclude that event Y likely occurred between A.D. 560–690 and A.D. 650–780; however, the consistency between all dates of paleoseismic, archaeoseismic, and tufa analysis suggest an earthquake event close to A.D. 650. Cement samples CS-1 and tufa sample CS-3-3 also indicate a rebuilding period after event Y, at the end of the Byzantine time and beginning of the Islamic period (fifth to sixth century A.D.).
Event Z, observed in trenches A, B, and C, is identified as younger than A.D. 960–1060, and older than A.D. 1030–1260. The definite interruption of tufa growth in all cores and mainly BR-5 and BR-6 indicates the final stoppage of water flow over the bridge section. The interruption postdates sample Br-6-8 (A.D. 900–1160) and can be correlated with the 29 June 1170 large earthquake that affected the Missyaf region (Mouty and Sbeinati, 1988; Sbeinati et al., 2005).
Fig. 12 (A)
Calibrated dating of samples (with calibration curve INTCAL04 from Reimer et al. [2004] with 2σ age range and 95.4% probability) and sequential distribution from Oxcal pro-gram (see also Table 1; Bronk Ramsey, 2001). The Bayesian distribution computes the time range of large earthquakes (events W, X, Y, and Z) at the Al Harif aqueduct according to faulting events, construction and repair of walls, and starts and interruptions of the tufa deposits (see text for explanation). Number in brackets (in %) indicates how much the sample is in sequence; the number in % indicates an agreement index of overlap with prior distribution.
Sbeinati et al (2010)
The Missyaf segment of the Dead Sea fault experienced four large earthquakes: event W in 3400–510 B.C., event X in A.D. 70–600, event Y in A.D. 560–780 (probably close to A.D. 650), and event Z in A.D. 960–1260 (probably in A.D. 1170). Using the Oxcal program (Bronk Ramsey, 2001), an attempt of sequential ordering of dates and events, presented in Figure 12, provides a time probability density function for events W (2300–500 B.C.), X (A.D. 160–510), Y (A.D. 625–690), and Z (A.D. 1010–1210). The timing of events obtained from the correlation and sequential distribution clearly indicate a temporal clustering of three large seismic events X, Y, and Z (Fig. 12) after event W, which may indicate a relatively long period of quiescence. Although our data and observations cannot precisely constrain event W, it may be correlated with the 1365 B.C. large earthquake that affected several sites between Lattakia and Tyre, as reported in the historical seismicity catalogue of Syria (Sbeinati et al., 2005). The Missyaf fault behavior is comparable to the temporal cluster of large seismic events that have occurred on other comparable major strike-slip faults (e.g., San Andreas fault—Weldon et al., 2004; Jordan Valley fault segment of the Dead Sea fault—Ferry et al., 2007).
 Figure 21
Idealized models for the major characteristics in cross-sectional view of the three types of flower structures present in the divergent-wrench fault zone.
- Negative
- Positive
- Hybrid
Huang and Liu (2017)
Flower structures are typical features of wrench fault zones.Identification is
based on differences in their internal structural architecture.Negative and Positive Flower Structures are widely known in Paleoseismology. Huang and Liu (2017) proposed a model of a 3rd type of flower structure - the Hybrid Flower Structure. All 3 types of flower structures are summarized below:
- Negative flower structures
- consists of a shallow synform bounded by upward spreading strands of a wrench fault with mostly normal separations
- occur in divergent-wrench fault zones where blocks move parallel to each other (i.e., pure strike-slip faults) and move with a component of divergence (i.e., divergent or transtensional wrench faults), especially easily occur in the regions of releasing bends and step overs along these wrench faults
- their presence indicates the combined effects of extensional and strike-slip motion.
- Positive flower structures
- consists of a shallow antiform displaced by upward diverging strands of a wrench fault with mostly reverse separations
- only occur in fault restraining bends and step overs where blocks move parallel to each other (i.e., pure strike-slip faults) and move with a component of convergence (i.e., convergent or transpressional wrench faults)
- Hybrid flower structures
- characterized by both antiforms and normal separations
- only occur in fault restraining bends and step overs
- can be considered as product of a kind of structural deformation typical of divergent-wrench zones
- is the result of the combined effects of extensional, compressional, and strike-slip strains under a locally appropriate compressional environment.
- The strain situation in it represents the transition stage that in between positive and negative flower structures.
- Kinematic and dynamic characteristics of the hybrid flower structures indicate the salient features of structural deformation in restraining bends and step overs along divergent-wrench faults, including the coexistence of three kinds of strains (i.e., compression, extension, and strike-slip) and synchronous presence of compressional (i.e., typical fault-bend fold) and extensional (normal faults) deformation in the same place.