Tekieh Trenches
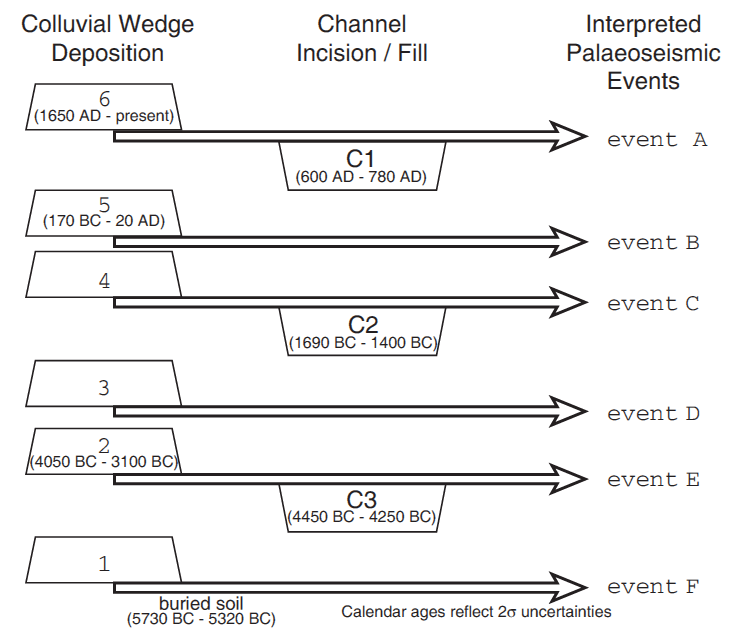 Figure 13
Summary of events observed in the trenches and the interpreted palaeoseismic history of the Serghaya fault. Colluvial wedge deposits post-date palaeoseismic events. Stratigraphic ties provide additional constraint on the relative timing of events. Ages represent calendar corrected radiocarbon ages for given features (2 σ uncertainties provided).
Gomez et al (2003)
- Fig. 2 Tectonic Location
Map from Gomez et al. (2003)
 Fig. 2
Shaded relief image depicting the gross morphology of the Serghaya fault. Faults and the main anticlinal hinges are shown. Geographic features:
- ZV = Zebadani Valley
- H = Mt Hermon
- D = Damascus
- B = Baalbek
- A = Aarsal
See Fig. 1 for location.
Gomez et al (2003) - Fig. 3 Geologic Location
Map from Gomez et al. (2003)
 Fig. 3
Geology of the southern Zebadani Valley (Syria). See Fig. 2 for location. Stereonet depicts fault planes and associated striations from faulted Late Pleistocene lake sediments. The dotted line depicts the catchment for the hillslope drainage at the trench site (white square). The white star denotes the excavation of the upper colluvial wedge described in Gomez et al# (2001). White discs denote small drainage deflections (values in metres), including the example shown in Fig. 4. Topographic contour interval = 50 m.
Gomez et al (2003) - Tekieh Trenches in Google Earth
 Tekieh Trenches
click on image to explore this site on a new tab in Google Earth
- Fig. 2 Tectonic Location
Map from Gomez et al. (2003)
Fig. 2
Shaded relief image depicting the gross morphology of the Serghaya fault. Faults and the main anticlinal hinges are shown. Geographic features:
- ZV = Zebadani Valley
- H = Mt Hermon
- D = Damascus
- B = Baalbek
- A = Aarsal
See Fig. 1 for location.
Gomez et al (2003) - Fig. 3 Geologic Location
Map from Gomez et al. (2003)
Fig. 3
Geology of the southern Zebadani Valley (Syria). See Fig. 2 for location. Stereonet depicts fault planes and associated striations from faulted Late Pleistocene lake sediments. The dotted line depicts the catchment for the hillslope drainage at the trench site (white square). The white star denotes the excavation of the upper colluvial wedge described in Gomez et al# (2001). White discs denote small drainage deflections (values in metres), including the example shown in Fig. 4. Topographic contour interval = 50 m.
Gomez et al (2003)

Fig. 5a
Map of trench site. 1 m relative contours are based on mapping with a total station. See Fig. 3 for location.
Gomez et al (2003)

Fig. 5c
Enlarged map of the trench site depicting the positions of the present channel (C1) and the precise locations of the buried channels (C2 and C3). Solid black lines indicate where the buried channels were observed and dashed lines indicate where buried channels were inferred. The patterns are consistent with Fig. 5(a).
Gomez et al (2003)

Fig. 12
Schematic block diagram illustrating the 3-D relationships of the features exposed in the trenches. A stratigraphic tie between the filling deposit of Channel C2 with the down-slope equivalent of Wedge 4 can be observed.
Gomez et al (2003)

Fig. 5b
Topographic profile and cross-section illustrating composite fault scarp approximately 4.5 m in height
Gomez et al (2003)

Fig. 6
Photograph of the trench site facing SE. Note the position of the trench system relative to the fault scarp and the small drainage. See Fig. 3 for location
Gomez et al (2003)

Fig. 8
Trench log for the northern wall of Trench 1 (see Fig. 7), exposing colluvial wedges, undifferentiated alluvium and Late Pleistocene lake sediments. Calibrated radiocarbon ages are shown.
Gomez et al (2003)

Fig. 7
Photomosaic of the north wall of Trench 1.
Gomez et al (2003)

Fig. 11
Cross-sections showing schematic reconstruction of the past five palaeoseismic events indicated in Trench 1. Numbers correspond to colluvial wedges 2-6. Bold lines depict the most recent fault splay in each stage; dashed lines denote restored faults.
- ls = lacustrine sediment
- a =undifferentiated alluvium
Gomez et al (2003)

Fig. 10
Trench log for the east wall of Trench 2. A sequence of three incised and filled channels is shown, with a northward sense of younging. Black discs denote the positions of samples for radiocarbon dating. The profile above the trench log depicts the hillslope channel morphology east of the fault zone. The relative positions of the channel mouth and the buried channels were mapped using a total station. Apparent offsets of the buried channels are shown.
Gomez et al (2003)

Fig. 9
Photo of incised and filled channel exposed in Trench 2. Channel C3 is incised into the older alluvium (unit a) and filled with clast-supported cobble, gravel, and sand. White string grid has 1 m spacing.
Gomez et al (2003)
Figure 13Summary of events observed in the trenches and the interpreted palaeoseismic history of the Serghaya fault. Colluvial wedge deposits post-date palaeoseismic events. Stratigraphic ties provide additional constraint on the relative timing of events. Ages represent calendar corrected radiocarbon ages for given features (2 σ uncertainties provided).
Gomez et al (2003)

Fig. 14
Plot of offset versus age for buried channels. The 2 m displacement of the youngest channel corresponds to a historically documented earthquake in the early or mid 18th century. The slope of the linear fit is the average Holocene slip rate for the Serghaya fault.
Gomez et al (2003)

Two simplined geometrical models for the restraining bend of the Dead Sea fault system and the role of the Serghaya fault. Predicted plate motion is based on the GPS-derived regional plate model of McClusky et al (2003, in press)
- Decomposing the predicted plate motion into N20E strike-slip fault and orthogonal shortening, the 1.4 mm/yr of slip on the Serghaya fault accounts for ~30 % of the expected strike-slip movement on faults striking N20E. The orthogonal shortening would be accommodated in the Mt Lebanon and/or AntiLebanon Mountains
- An alternative model in which the Serghaya fault acts as an oblique back-stop behind the Palmyride fold belt and contributes to internal deformation of the Arabian plate. The remaining portion of Arabian-African plate motion may then be composed into strike-slip movement (N20E faults) and orthogonal shortening.
Gomez et al (2003)
 Table 2
Radiocarbon dates of relevant samples from Trenches 1 and 2 and nearby areas
Click on image to open in a new tab
Gomez et al (2003)
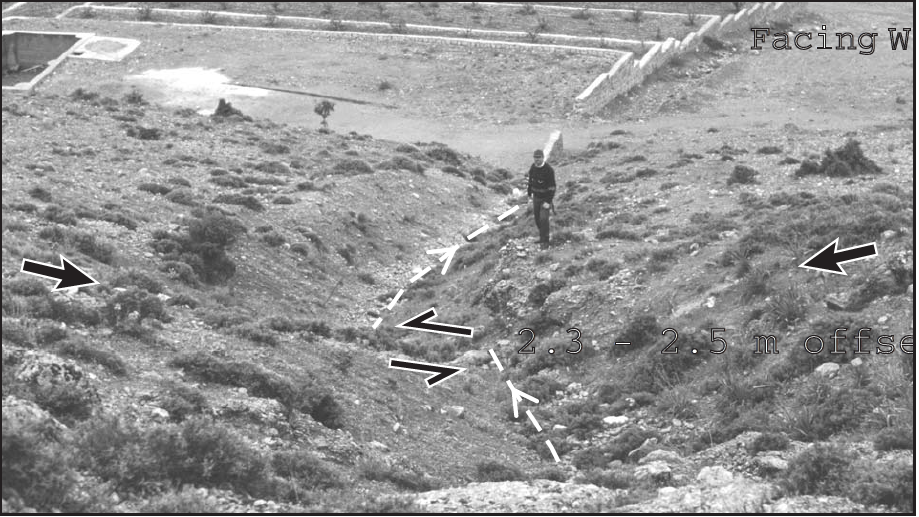 Fig. 4
An example of a small, displaced drainage crossing the Serghaya fault. The minimum offset is 2.3 - 2.5 m. The view is facing west; see Fig. 3 for location.
Gomez et al (2003)
Fig. 6
Photograph of the trench site facing SE. Note the position of the trench system relative to the fault scarp and the small drainage. See Fig. 3 for location
Gomez et al (2003)
The Serghaya fault is represented by a composite fault scarp ∼4.0–4.5 m high and comprising the boundary between the mountain front and the Late Quaternary alluvial apron (Fig. 6). As shown in the topographic profile (Fig. 5b), the lower alluvial surface appears to correspond to the bevelled bedrock in the upper surface. About 150 m to the south can be found some of the free faces reported by Gomez et al. (2001).
Fig. 5b
Topographic profile and cross-section illustrating composite fault scarp approximately 4.5 m in height
Gomez et al (2003)
The up-thrown eastern block of the fault comprises Late Quaternary lacustrine sediments (calcareous silt and gravel) and Pliocene–Quaternary conglomerates (Fig. 5). Radiocarbon dating of a charcoal fragment from a roadcut exposure of the lacustrine sediments about 0.5 km to the south yielded a radiocarbon age of 44.6 kyr BP (sample LS-1 in Table 2).
 Figure 3
Geology of the southern Zebadani Valley (Syria). See Fig. 2 for location. Stereonet depicts fault planes and associated striations from faulted Late Pleistocene lake sediments. The dotted line depicts the catchment for the hillslope drainage at the trench site (white square). The white star denotes the excavation of the upper colluvial wedge described in Gomez et al. (2001). White discs denote small drainage deflections (values in metres), including the example shown in Fig. 4. Topographic contour interval = 50 m.
click on image to open in a new tab
Gomez et al. (2003)
At the trench site, a hillslope drainage with a small catchment area of approximately 0.25 km2 exits the mountain front (Fig. 3). This ephemeral stream feeds a young alluvial fan that attains up to about 1 m of relief above the surface of the older alluvial apron (Fig. 5). Although today partially truncated on the north side by an orchard, the northern limit of the younger fan was mapped from aerial photos dating to 1983.
Emerging from the mouth of the drainage at the fault scarp, the active, ephemeral streambed deflects southward (i.e. left-lateral) approximately 2 m (Fig. 5). This deflection is consistent with the minimum deflections observed in other small drainages in the southern Zebadani Valley (Fig. 3; Gomez et al. 2001). Hence, we interpret this deflection as a displacement corresponding to the last surface-rupturing earthquake in the early or mid 18th century.
Fig. 6
Photograph of the trench site facing SE. Note the position of the trench system relative to the fault scarp and the small drainage. See Fig. 3 for location
Gomez et al (2003)
The system of three trenches shown in Figs 5 and 6 was designed to take advantage of both the vertical and lateral components of the locally oblique fault slip. The trenches were excavated using a backhoe, and the walls were subsequently cleaned by hand. A 1 m grid facilitated the careful logging of all six trench walls (three trenches with two walls each) at a scale of 1:20. Within the study site, we mapped the precise positions of the trenches with respect to the present-day stream channel and fault scarp using a total station.
Fig. 5a
Map of trench site. 1 m relative contours are based on mapping with a total station. See Fig. 3 for location.
Gomez et al (2003)
Fig. 5b
Topographic profile and cross-section illustrating composite fault scarp approximately 4.5 m in height
Gomez et al (2003)
Fig. 5c
Enlarged map of the trench site depicting the positions of the present channel (C1) and the precise locations of the buried channels (C2 and C3). Solid black lines indicate where the buried channels were observed and dashed lines indicate where buried channels were inferred. The patterns are consistent with Fig. 5(a).
Gomez et al (2003)
Trench 1 spanned approximately 8 m across the fault zone and exposed the Late Pleistocene lacustrine deposits and the alluvial sediments. This trench was excavated to depths from 2.5 to 4 m and provided a view of the relationships between faulting and different colluvial/alluvial deposits.
Trenches 2 and 3 were excavated 2–2.5 m deep, parallel to the fault scarp (NNE–SSW) from the mouth of the drainage southward across the alluvial fan. These fault-parallel trenches, located 4 and 7 m from the fault, were excavated in order to explore for indications of lateral displacement. Furthermore, the intersection of Trenches 1 and 2 provided possible stratigraphic ties within the excavation site.
The results presented below reflect all six trench logs. However, for the sake of simplicity, only two trench logs are shown: one wall of the trench crossing the fault (Trench 1; Figs 7 and 8), and one wall of the fault-parallel trench nearer the fault scarp (Trench 2; Figs 9 and 10).
Fig. 8
Trench log for the northern wall of Trench 1 (see Fig. 7), exposing colluvial wedges, undifferentiated alluvium and Late Pleistocene lake sediments. Calibrated radiocarbon ages are shown.
Gomez et al (2003)
Fig. 10
Trench log for the east wall of Trench 2. A sequence of three incised and filled channels is shown, with a northward sense of younging. Black discs denote the positions of samples for radiocarbon dating. The profile above the trench log depicts the hillslope channel morphology east of the fault zone. The relative positions of the channel mouth and the buried channels were mapped using a total station. Apparent offsets of the buried channels are shown.
Gomez et al (2003)
The critical age control in this study relied upon radiocarbon dating of buried organic material (Table 2). Samples of detrital charcoal, buried wood and buried seeds were collected from the trench walls, as well as a sample of charcoal collected from the lacustrine sediments approximately 0.5 km to the south of the trench site (see Table 2). In addition, bulk sediment samples were collected from stratigraphic units more than 1 m below the surface. Small samples were dated using accelerator mass spectrometry (AMS), and bulk samples from buried soils were crushed, slurried and sieved prior to chemical pretreatment and dating by decay counting.
Table 2
Radiocarbon dates of relevant samples from Trenches 1 and 2 and nearby areas
Click on image to open in a new tab
Gomez et al (2003)
Some of the samples, particularly those from shallow levels in the trenches, show evidence of probable contamination. These samples are evident with 14C concentrations greater than 100 per cent of the modern value in Table 1. These samples were typically very small and collected from the uppermost colluvial deposit. We interpret these as probable contamination based on previous information concerning the uppermost colluvial deposit. Previous dating of relatively intact exposures of the uppermost colluvial wedge (which we correlate with the uppermost colluvial deposit in this study) was reported by Gomez et al. (2001) as radiocarbon ‘modern’. Furthermore, in this study area, the uppermost colluvial wedge has been severely truncated by agricultural activity. These samples were collected just below the plow zone at depths of 0.2 m. Hence, there seems to be considerable potential for contamination of these small samples by post-bomb carbon.
The quality of the other reported charcoal samples (from deeper levels in the trenches) is generally good—these were typically larger samples (>120 µM of graphitized carbon). However, both of the bulk sediment samples yielded very small amounts of organic carbon (<0.5 g) and required extended counting.
We calibrated radiocarbon ages to calendar dates with the correction curve of Stuiver et al. (1998) using the OxCal program (Bronk Ramsey 1998), and these calibrated ages are reported as ranges of dates representing the probability density function at the 95 per cent (2σ) confidence limits (Table 2). In some cases, the calibrated age ranges were further constrained by applying rules of superposition and Bayesian analysis (e.g. Biasi & Weldon 1994; Bronk Ramsey 1998). This was particularly helpful in assigning probable ages to the base of the earthquake sequence where there is sufficient age control (i.e. relating Channel C3 incision and fill to Wedge 2, see below).
Fig. 8
Trench log for the northern wall of Trench 1 (see Fig. 7), exposing colluvial wedges, undifferentiated alluvium and Late Pleistocene lake sediments. Calibrated radiocarbon ages are shown.
Gomez et al (2003)
Across the fault zone, Trench 1 exposed a stratigraphy of Late Pleistocene lacustrine marl and sandy gravel in the up-thrown block and reddish brown to yellowish alluvium and colluvium on the down-thrown (western) side of the fault. The photomosaic of the northern trench wall in Fig. 7 and the associated trench log in Fig. 8 show the abrupt fault contact between the lacustrine sediments and the younger alluvium. The fault zone is 3–4 m wide, as revealed by shear fabrics in the silt and clay and by alignments of elongate clasts in the matrix-supported alluvium.
Undifferentiated reddish brown alluvium (unit a) characterizes much of the lower stratigraphy (Fig. 8). This deposit consists of gravel, sand, and occasional cobble supported by a clay matrix. This stratigraphic unit appears to correspond to the alluvial apron flanking the mountain front. Locally, it is buried beneath the younger alluvial fan deposit, and adjacent to the fault scarp, it has been buried beneath up to 1.5 m of scarp-derived colluvium. A bulk soil sample from the top of unit a (i.e. just below colluvial deposit W2) yielded an age of 5280 ± 230 BP. Applying Bayesian methods to the radiocarbon calibration (Biasi & Weldon 1994)— specifically, knowing that the undifferentiated alluvium predates buried channels incised into unit a (discussed below)—we calculate a calibrated age of 4720–4270 BC for the undifferentiated alluvium.
Colluvial ‘wedge’ deposits along fault scarps are important palaeoseismic indicators in cases where local fault movements involve repeated uplift (e.g. McCalpin 1996). In Trench 1, individual colluvial deposits are distinguished by pebbles and other larger clasts defining buried depositional surfaces. The colluvium consists of poorly sorted, matrix-supported clasts of Late Pliocene–Quaternary conglomerate and lacustrine marl, and the clasts are typically angular to subangular, suggesting proximal sources. The development of distinct soils in each colluvial wedge suggests long-term stability of the surface during the time between colluvial depositional events. These colluvial wedges are bounded on the up-thrown, eastern sides by buried scarps 20–40 cm in height. These scarps align with shear zones truncating the lower strata, implying that the buried scarps result from fault movements. Furthermore, some of these colluvial bodies are themselves truncated by subsequent faulting as indicated by shear fabrics and buried by younger colluvium.
In total, we distinguished five colluvial wedges above the undifferentiated alluvium (unit a), as well as one within. For this discussion, these are labelled in ascending order as Wedges 1 through 6 (Fig. 8). The colluvial wedges proved challenging for dating owing to a lack of sufficient organic material. Some of the samples show apparent contamination such as modern radiocarbon ages reported for samples from considerable depth. Dates from Wedges 6, 5 and 2 (corresponding to the uppermost, penultimate and earliest post-unit-a colluvium, respectively) were obtained.
At this site, the uppermost colluvial wedge (Wedge 6) was truncated by the plow zone—the thickness is minimal, and a plastic cigarette wrapper was found 25 cm below the surface, implying recent modification. The remnant of this wedge consisted of centimetre-size pebbles and gravel clasts of limestone and lake sediments. Dating of this wedge was difficult. From within Wedge 6, only small seeds were extracted yielding high concentrations of 14C in excess of 100 per cent modern. These ‘post-bomb’ samples may, in fact, be very recently deposited, particularly since the top of Wedge 6 has been truncated by modern cultivation (Fig. 8). One charcoal fragment from the sand immediately below Wedge 6 (sample T1-03N with 103.9 ± 1.8 per cent modern) yielded a calendar age of 1650 AD to present. Owing to its small size (<27 µM of graphitized carbon), a δ13C measurement was not possible, hence an assumed value of 25 per cent was used. Other pre-Wedge 6 charcoal samples (also small) yielded high percentage modern values, and these probably reflect contamination. Radiocarbon dating of a complete (i.e. not truncated) exposure of this upper wedge in a small excavation to the north (see Fig. 3) demonstrated modern and >modern radiocarbon ages (Gomez et al. 2001). In summary, this uppermost colluvial wedge can be assigned a probable age 1650 AD to present.
Wedge 5 had a yellowish colour and consisted of large clasts with a white patina in a silty–sandy matrix. Charcoal from Wedge 5 yielded an age of 170 BC to 20 AD (2060 ± 30 BP). The down-slope stratigraphic equivalent is a fine sand/silt that can be traced across the shear zone abutting Wedge 6.
Wedge 4 rests directly beneath Wedge 5 and consists of small gravel and cobble-sized clasts in a silty-sandy matrix. Clasts of limestone and lacustrine sediment are present. Appropriate material for radiocarbon dating could not be found within this deposit. The sandy silt and gravel unit in the western end of the trench appears to be the down-slope stratigraphic equivalent of this unit.
Wedge 3 comprises limestone pebbles (centimetre size) and gravel in a sandy matrix. This unit is covered by the down-slope stratigraphic equivalent of Wedge 4 and truncates against the undifferentiated alluvium.
The oldest colluvium above the undifferentiated alluvium was Wedge 2. This deposit consisted of rounded pebbles and flat gravel in a stratified, reddish-brown matrix. Weakly developed soil structures were observed. Clasts consisted of limestone and lacustrine sediment. A bulk sediment sample from Wedge 2 yielded an age of 4050–3100 BC (4870 ± 160 BP).
Wedge 1 was identified in the base of the trench, within the undifferentiated alluvium. Well rounded pebbles and flat gravel of limestone and lacustrine sediment rest within a reddish-brown matrix. A bulk sample of the soil buried by this colluvial wedge was dated at 5730–5320 BC (6590 ± 120 BP).
In summary, the upper five distinct colluvial deposits post-date 5280 ± 230 BP. Stratigraphic relations demonstrate that all five post-alluvium colluvial wedges represent separate depositional episodes; i.e. there is a clear sequence of deposition and burial by successive colluvial deposits. The presence of weakly developed soil structures in the colluvial wedges suggests surface stability between distinct depositional events and argues against creation of the buried scarp by multiple events or fault creep. Hence, we interpret each colluvial wedge to post-date a separate palaeoseismic event that created each buried scarp.
Fig. 10
Trench log for the east wall of Trench 2. A sequence of three incised and filled channels is shown, with a northward sense of younging. Black discs denote the positions of samples for radiocarbon dating. The profile above the trench log depicts the hillslope channel morphology east of the fault zone. The relative positions of the channel mouth and the buried channels were mapped using a total station. Apparent offsets of the buried channels are shown.
Gomez et al (2003)
Trenches 2 and 3, parallel to the fault scarp, exposed the reddish-brown alluvium incised by channels (Fig. 9). Each channel was filled with moderately to well sorted, frequently clast-supported gravel and occasional cobble, within a sandy matrix. This sedimentology indicates a moderately high-energy stream flow. Detrital charcoal collected from each of the channels provided age control of the filling sediments. In total, three channels, including the incision beneath the present-day drainage, were identified and correlated between the two trenches, with onlapping relationships demonstrating a consistent northward sense of younging (Fig. 10). For each channel, the magnitude of incision is greater in Trench 2 than in Trench 3, i.e. greater incision is found closer to the mouth of the drainage. In addition to stratigraphy, radiocarbon dating confirmed the correlation of channels between Trenches 2 and 3.
Channel C1 is filled by a fining upward sequence approximately 1 m thick. This is covered by about 1 m of recent alluvium that truncates and caps Channels C2 and C3. A charcoal fragment from the upper part of Channel C1 yields a calendar age of 600–780 AD (1354 ± 53 BP).
Channel C2 is very narrow and deeply incised (>2 m) into the older alluvium (unit a). During filling, small episodes of re-incision occurred, and the channel was capped by a thin veneer of alluvium that also caps Channel C3. The base of Channel C2 fill dates at 1690–1400 BC (3233 ± 57 BP).
Channel C3 depicts an initial incision followed by filling with minor episodes of entrenchment, meandering and widening of the original channel. Charcoal fragments from throughout the filling strata in Channel C3 yield statistically identical ages (χ2 = 0.6 < 7.8 (95 per cent), three degrees of freedom). Since these are from the same deposit, the ages and their Gaussian errors can be combined prior to calibration (Bronk Ramsey 1998) to yield a combined age of 5498 ± 46 BP for the fill. Recalling the 5280 ± 230 BP age from the top of the undifferentiated alluvium (unit a), which represents the incised surface, these ages are statistically very similar. This suggests that the cycle of incision and filling for Channel C3 was a relatively short-lived episode.
Channels 2 and 3 are exposed in both walls of trenches 2 and 3, and the positions of these channels depict linear traces approximately perpendicular to trenches 2 and 3 and to the fault trace (Fig. 5c). In addition, the active stream bed above incised Channel C1 also shows a very linear trace, aside from its abrupt deflection at the fault (Fig. 5c).
Fig. 12
Schematic block diagram illustrating the 3-D relationships of the features exposed in the trenches. A stratigraphic tie between the filling deposit of Channel C2 with the down-slope equivalent of Wedge 4 can be observed.
Gomez et al (2003)
Trench stratigraphy and associated chronological information allow the construction of a palaeoseismic record for the SFZ. The key palaeoseismic indicators in this study are the colluvial deposits exposed in Trench 1, along with the offsets of modern and buried stream channels. In Trench 1, Wedges 4–6 rest in depositional contact with the buried scarp located above shear zones. This suggests that each of these colluvial wedges corresponds to only one faulting event, i.e. that which produced the buried scarp. The sedimentary geometries of Wedges 1–3 suggest that they too each represent one depositional episode. Following the colluvial wedge model (McCalpin 1996), one colluvial wedge is deposited following each surface-rupturing earthquake. Stratigraphic relationships depict the colluvial wedges following a sequence, i.e. two wedges are not contemporaneous. Hence, we interpret six surface-rupturing earthquakes from this trench study (Fig. 11).
Fig. 11
Cross-sections showing schematic reconstruction of the past five palaeoseismic events indicated in Trench 1. Numbers correspond to colluvial wedges 2-6. Bold lines depict the most recent fault splay in each stage; dashed lines denote restored faults.
- ls = lacustrine sediment
- a =undifferentiated alluvium
Gomez et al (2003)
Combining the relative and absolute age control, a history of colluvial wedge deposition (each post-dating a palaeoseismic event) and channel scour-and-fill cycles can be assembled from the trench site. We interpret palaeoseismic events to pre-date colluvial wedges and to post-date channel incision/fill—if the fill post-dated an event, then it would be expected to comprise more chaotic colluvium derived from the channel wall, rather than the well-sorted sand and gravel that are observed. We also assume that the rapid incision/fill cycle of Channel C3 characterizes the incision and fill of Channels 1 and 2, although the geochronological data to test this assumption are lacking. We interpret these channel-scouring events to represent relatively short-lived climatic events within the increasing aridity during the Holocene.
Stratigraphic ties between Trenches 1 and 2 provide additional control on the relative timing of colluvial deposition and the scouring and filling of the buried channels. These stratigraphic ties are illustrated in the 3-D block diagram shown in Fig. 12. The upper fill of Channel C1 corresponds to the younger alluvial fan that locally buries the older alluvial apron. Stratigraphically, the remnant of Wedge 6 lies within this younger alluvial deposit. Another important stratigraphic tie is apparent between the upper part of the Channel C2 fill and the down-slope deposits interpreted to correspond to Wedge 4.
Figure 13Summary of events observed in the trenches and the interpreted palaeoseismic history of the Serghaya fault. Colluvial wedge deposits post-date palaeoseismic events. Stratigraphic ties provide additional constraint on the relative timing of events. Ages represent calendar corrected radiocarbon ages for given features (2 σ uncertainties provided).
Gomez et al (2003)
The channel incision/fill episodes and colluvial deposition events are summarized in Fig. 13, along with the interpreted palaeoseismic events, labelled A–F in order of increasing age. In total, five events are interpreted to post-date the older alluvium.
Remnants of Wedge 6 are within the younger alluvium and post-date the filling of Channel C1 (600–780 AD). Based on the remnants of Wedge 6, and the previous dating of the youngest colluvial wedge (Gomez et al. 2001), we interpret Wedge 6 as corresponding to an earthquake that occurred during the past two to three centuries (Event A), and this probably represents one of two well-documented, historical earthquakes that occurred in 1705 and 1759 (Table 1). Both earthquakes caused considerable damage in the AntiLebanon region. The 1705 earthquake caused considerable damage to Damascus (Poirier & Taher 1980). The earthquake of 1759 has been well documented (e.g. Ambraseys & Barazangi 1989) and most intensely affected towns in the western part of the AntiLebanon Mountains and the Bekaa Valley. The macroseismic data suggest a magnitude of about 7.4 and up to 100 km of surface rupture. Reports of surface rupturing ‘north of Baalbek’ (Ambraseys & Barazangi 1989) are ambiguous concerning which side of the Bekaa Valley, and the surface rupture has not yet been identified in the field. From the dating in this trench alone, it is not possible to distinguish between these two events, as they occurred relatively close in time to one another during a time period for which radiocarbon age calibration is poorly controlled (e.g. Stuiver et al. 1998).
Wedges 5 is radiometrically constrained to pre-date the Channel C1 fill, and Wedge 4 is stratigraphically constrained to post-date the Channel C2 fill. Hence, two palaeoseismic events (events B and C) are interpreted as being between 170 BC–20 AD (Wedge 5) and 1690 BC–1400 BC (Channel C2). It may be possible that Wedge 5 (170 BC–20 AD) corresponds to a poorly documented earthquake that occurred in 198 BC. Although the reports for this earthquake come primarily from Sidon on the coast of present-day Lebanon, the onshore location of this earthquake is suggested by the report that a town inland was ‘engulfed’ by the earthquake (Ambraseys & White 1997). However, such an interpretation is speculative until the other possible fault branches (e.g. Yammouneh and Roum faults) have been studied and discounted as possible sources.
Wedge 2 is radiometrically constrained to post-date the Channel C3 fill, and we believe that Wedge 3 also pre-dates Channel C2. Consequently, two additional palaeoseismic events (events D and E) are interpreted between 1690–1400 BC (Channel C2) and 4460–4250 BC (radiocarbon dates combined before calibration) (Channel C3). Event E can be constrained to post-date the Channel C3 fill (4460–4250 BC) and pre-date Wedge 2 (4050–3250 BC).
The oldest palaeoseismic event in the trench, represented by Wedge 1, pre-dates the bulk sample from the upper part of the undifferentiated alluvium (unit a) and post-dates the buried soil below Wedge 1 (5730–5320 BC). Hence, this palaeoseismic event probably occurred some time between 5600 and 4400 BC (at the 2σ confidence limits).
Two simplined geometrical models for the restraining bend of the Dead Sea fault system and the role of the Serghaya fault. Predicted plate motion is based on the GPS-derived regional plate model of McClusky et al (2003, in press)
- Decomposing the predicted plate motion into N20E strike-slip fault and orthogonal shortening, the 1.4 mm/yr of slip on the Serghaya fault accounts for ~30 % of the expected strike-slip movement on faults striking N20E. The orthogonal shortening would be accommodated in the Mt Lebanon and/or AntiLebanon Mountains
- An alternative model in which the Serghaya fault acts as an oblique back-stop behind the Palmyride fold belt and contributes to internal deformation of the Arabian plate. The remaining portion of Arabian-African plate motion may then be composed into strike-slip movement (N20E faults) and orthogonal shortening.
Gomez et al (2003)
Active strike-slip movement of the Serghaya fault contrasts with suggestions that strike-slip faulting within the restraining bend and northwards have been rendered inactive as a result of an evolving regional stress field in the eastern Mediterranean region (e.g. Butler et al. 1997). A recent plate model for the Arabian and African plates based on GPS measurements (McClusky et al. 2003) predicts the total motion of the Arabian plate relative to the African plate at this latitude to be ∼6.8 mm yr-1 with an azimuth of about N25W, i.e. 45° to the azimuth of the restraining bend. Primarily left-lateral slip on the Serghaya fault, striking N20E, suggests a regional partitioning of strain.
One simple geometrical model of strain partitioning in the restraining bend along the Dead Sea fault system is illustrated schematically in Fig. 15(a). In this model, the plate motion is decomposed into 4.8 mm yr-1 of strike-slip along faults striking N20E in the restraining bend, as well as a similar magnitude of shortening perpendicular to the faults (Fig. 15a). In this case, the 1.4 ± 0.2 mm yr-1 of slip on the Serghaya fault only accounts for ∼30 per cent of total predicted strike-slip motion. Consequently, this implies that other strike-slip faults in the restraining bend, such as the Yammouneh fault, should be active in order to accommodate the remaining plate motion.
However, the Serghaya fault does not appear to reconnect with the transform (Figs 1 and 2), suggesting a slightly more complicated fault model. One possibility might involve the Serghaya fault acting as an oblique ‘back-stop’ for active shortening within the adjacent Palmyride fold belt, perhaps along with the right-lateral Jhar fault north of the Palmyrides (Fig. 15b). In this case, the 1.4 ± 0.2 mm yr-1 of slip on the Serghaya fault may be used to infer from the geometry that NNW shortening in the Palmyrides accommodates approximately 1 mm yr-1 of the relative plate motion. The remaining 5.8 mm yr-1 of plate motion could be decomposed into 4.1 mm yr-1 of strike-slip on N20E strike-slip faults (e.g. the Yammouneh fault), and a similar amount of shortening perpendicular to these faults.
Regardless of the general tectonic model for the restraining bend, the Serghaya fault seems insufficient to account for all predicted plate motion. Hence, multiple strike-slip faults imply more complicated scenarios for earthquake hazard assessments.
As noted by previous workers this structural configuration bears similarity to the ‘Big Bend’ of the San Andreas fault system in southern California (e.g. Chaimov et al. 1990), which comprises several active fault branches, including both reverse and strike-slip faults. In addition, internal deformation of the North American Plate is also significant—although the major component of plate motion is accommodated by the San Andreas fault, studies have demonstrated that the Eastern California Shear Zone and the Basin and Range (e.g. Dokka & Travis 1990; Dickinson & Wernicke 1997) accommodate significant components of the total plate motion.