Taybeh Trench
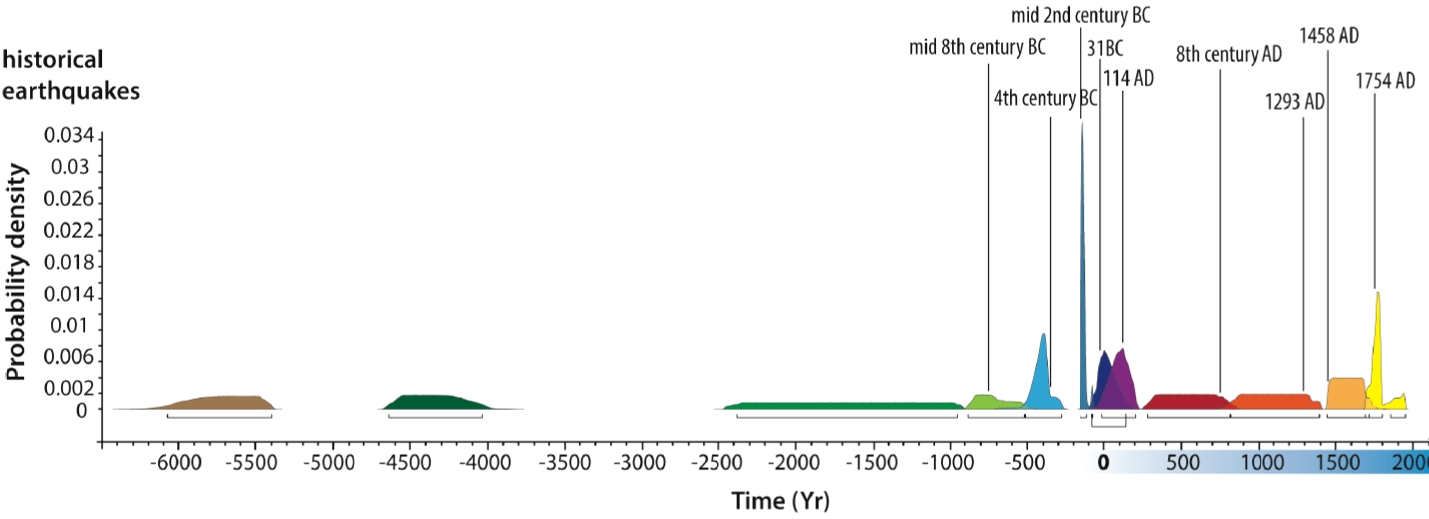
Figure S5
Computed age model from OxCal v4.26 for the seismic events recorded in the trench.
LeFevre et al. (2018)
Maps, Aerial Views, Trench Log, and Chronology
Maps
Normal Size
- Fig. 2 Location Map from
Lefevre et al. (2018)
 Figure 2
Topographic map of the Wadi Araba from SRTM3 (pixel size, ~90m) with lateral extent of historical earthquakes based on events identifed in trenches and in historical accounts. Locations of the 1068 AD, 1212 AD, 363 AD events not identifed in the Taybeh trench are from Klinger et al. The Wadi Araba fault segments were reproduce afer Le Béon et al.. The Jabal al-Risha compressional jog and the Yotvata extensional jog appear to act like stopping/initiation points for many ruptures, although larger earthquakes seem to be able to break through. WM: Wadi Musa. Figure was generated with Adobe illustrator CS6
click on image to open in a new tab
Lefevre et al. (2018)
Magnified
- Fig. 2 Location Map from
Lefevre et al. (2018)
Figure 2
Topographic map of the Wadi Araba from SRTM3 (pixel size, ~90m) with lateral extent of historical earthquakes based on events identifed in trenches and in historical accounts. Locations of the 1068 AD, 1212 AD, 363 AD events not identifed in the Taybeh trench are from Klinger et al. The Wadi Araba fault segments were reproduce afer Le Béon et al.. The Jabal al-Risha compressional jog and the Yotvata extensional jog appear to act like stopping/initiation points for many ruptures, although larger earthquakes seem to be able to break through. WM: Wadi Musa. Figure was generated with Adobe illustrator CS6
click on image to open in a new tab
Lefevre et al. (2018)
Aerial Views
- Taybeh Trench in Google Earth
 Taybeh Trench
click on image to explore this site on a new tab in Google Earth
Trench Log
Location Map

Figure 2
Topographic map of the Wadi Araba from SRTM3 (pixel size, ~90m) with lateral extent of historical earthquakes based on events identifed in trenches and in historical accounts. Locations of the 1068 AD, 1212 AD, 363 AD events not identifed in the Taybeh trench are from Klinger et al. The Wadi Araba fault segments were reproduce afer Le Béon et al.. The Jabal al-Risha compressional jog and the Yotvata extensional jog appear to act like stopping/initiation points for many ruptures, although larger earthquakes seem to be able to break through. WM: Wadi Musa. Figure was generated with Adobe illustrator CS6
Click on image to open in a new tab
LeFevre et al (2018)
Trench Log
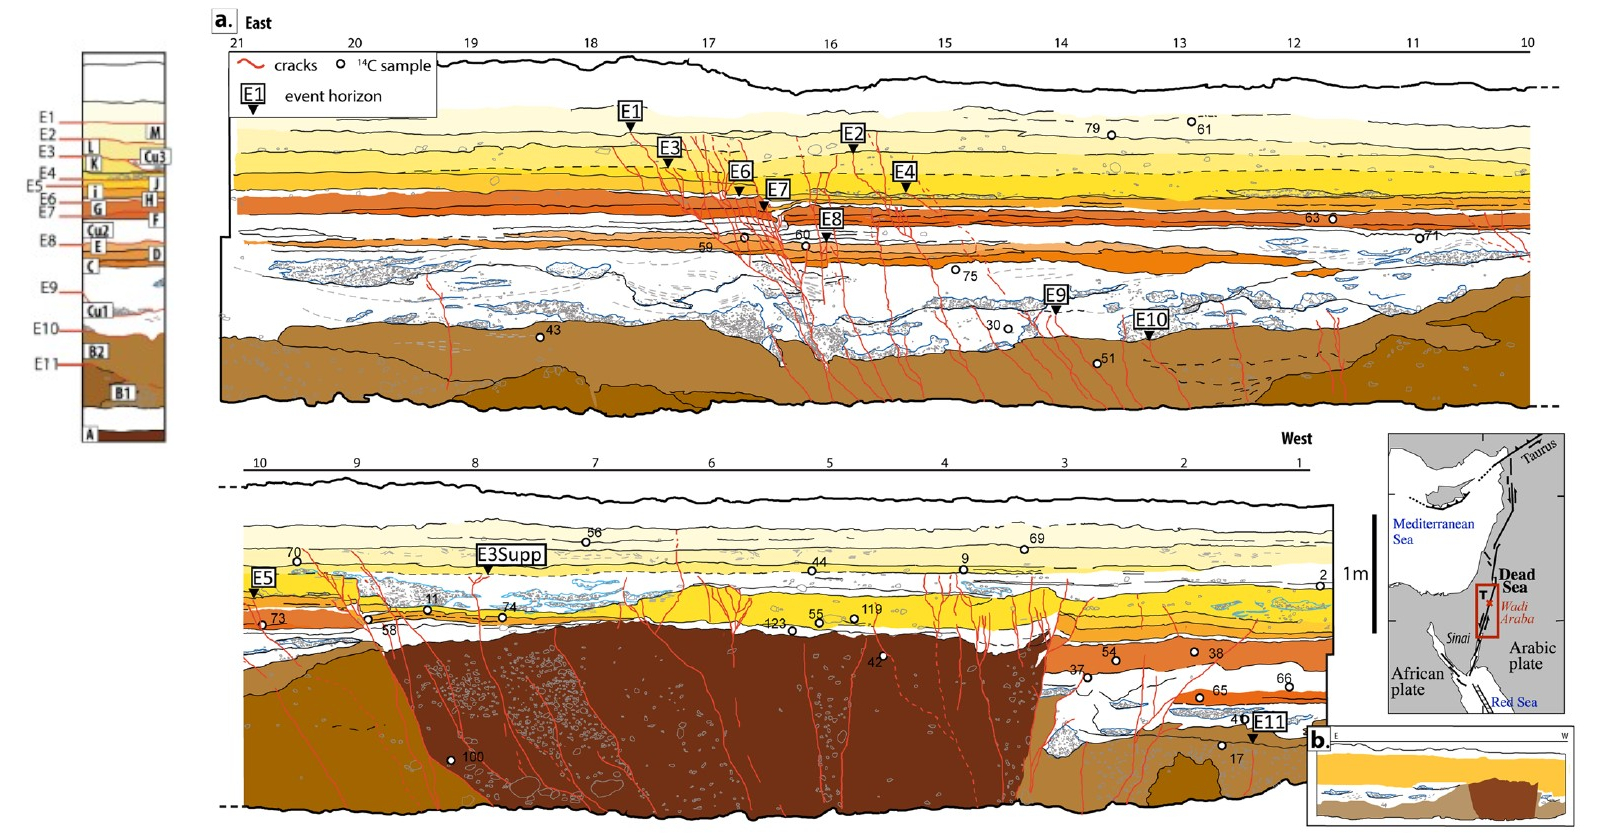
Figure 1
(a) Detailed log of the southern wall of the trench. Units are differentiated according to facies. White dots indicate locations of 14C samples collected from both walls (the samples collected from the northern wall are represented at a stratigraphically and structurally equivalent location on the southern wall log).
Click on image to open in a new tab
LeFevre et al (2018)
Annotated Trench photomosaic

Figure S2
Photomosaic of the trench southern wall (top) and mapping of stratigraphic layers, faults, and earthquakes (bottom). The event horizons associated to the seismic events recorded in the trench are indicated in red on the stratigraphic log.
click on image to open in a new tab
LeFevre et al (2018)
Stratigraphic Column
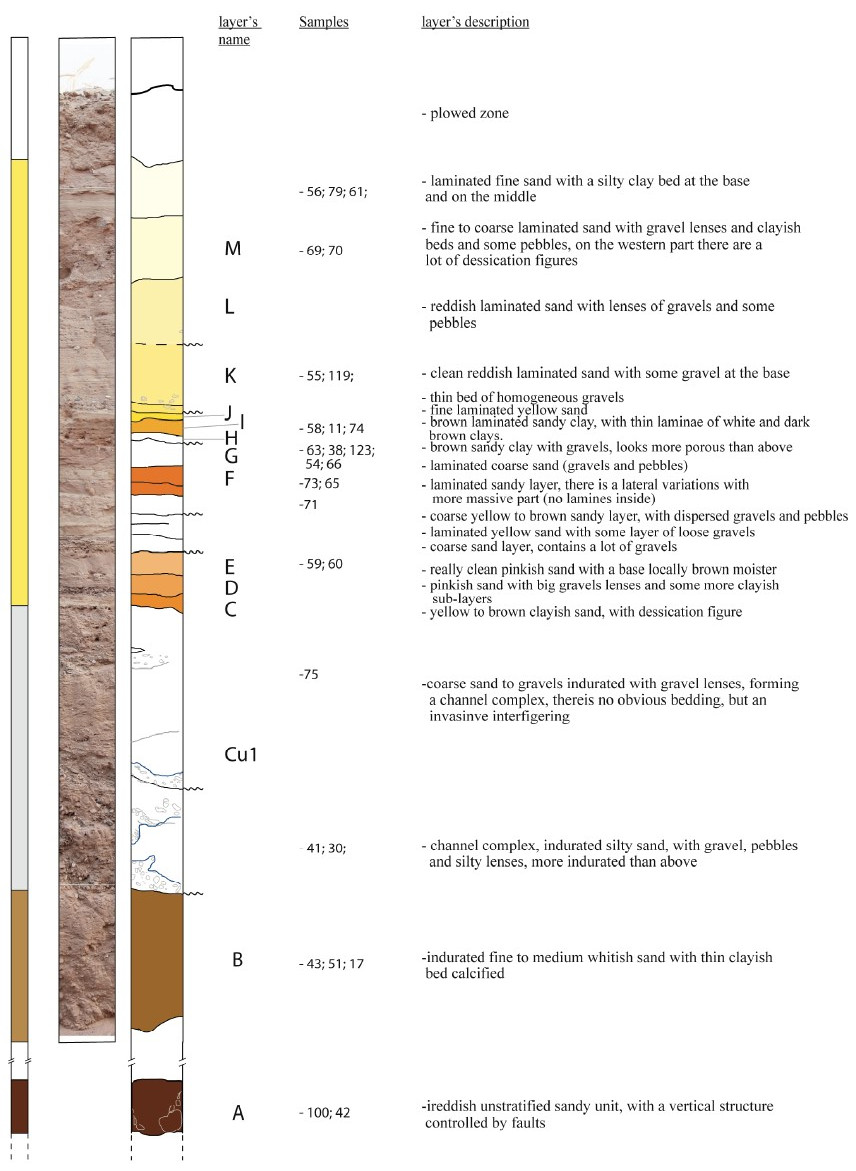
Figure S3
Stratigraphic log of the trench, on the left simplified log with the limits of the four main units, and then the complete log is represented. Letters A to M name the different stratigraphic layers. The layers are quite continuous laterally along the trench, the 14C samples dated in each layer are indicated.
click on image to open in a new tab
LeFevre et al (2018)
Historical earthquakes distribution in space and time
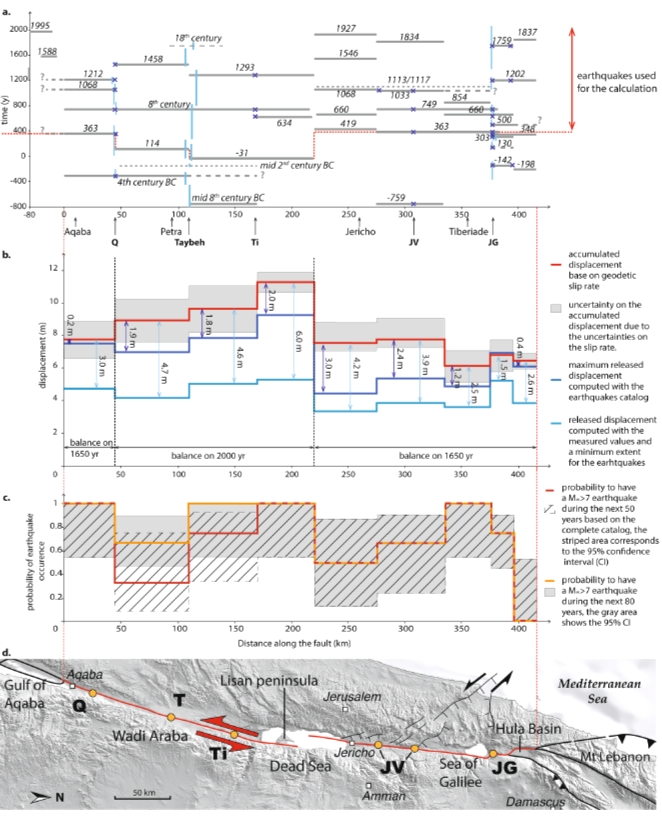
- Historical earthquakes distribution in space and time, each horizontal bar corresponds to an approximate earthquake location along the Dead Sea fault, dashed lines are used for uncertain locations or lateral limits. The vertical bars correspond to the time interval associated to the paleoearthquakes at Taybeh, obtained after a Bayesian modeling in Oxcal. For Qatar the time intervals are from Klinger et al., for the Jordan Gorge the ages are from Marco et al.5 and from Wechsler et al.. The blue crosses represent the earthquakes visible in the different trenches.
- Accumulated displacement (red) from tectonic loading and cumulated released slip (blue) due to major earthquakes from 350AD to 2015AD along DSF, between the Gulf of Aqaba and the Hula basin. For all earthquakes two scenarios are considered, the dark blue line shows the released displacement linked to a maximum lateral extent, the light blue line shows the released displacement linked to a minimum lateral extent. The slip deficit is written in meter for all the sections and for the two scenarios.
- Probability of M ≥ 6.5/7 earthquakes for the next 50 and 80 years (respectively red and orange) calculated with the ‘empirical’ method of Savage52. (d) Simplified structural map of the southern Dead Sea fault, the studied branches are highlighted in red, the sites of previous paleoseismological studies in the area are shown, Q: Qatar, Ti: Tilah, JV: Jordan valley. The topography is from SRTM3 and the faults geometries are derived from Le Béon et al.26. Figure was generated with Adobe illustrator CS6
click on image to open in a new tab
LeFevre et al. (2018)
Chronology
Age Model
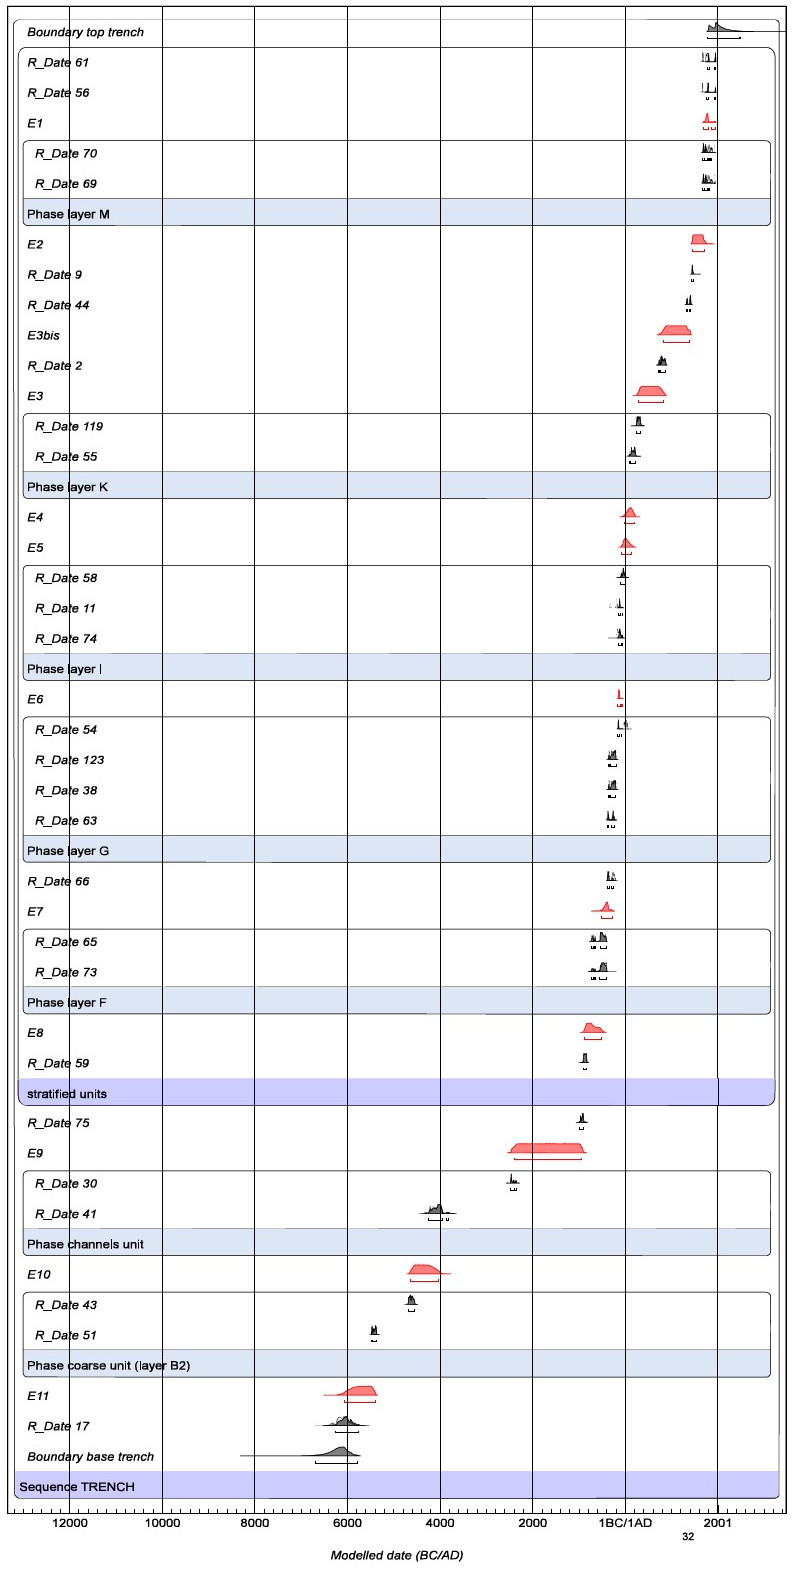
Figure S4
Age model computed for the trench stratigraphy using OxCal v4.2 and IntCal13 calibration curve. Dark grey indicates modeled ages including stratigraphic information and red are the modeled age for seismic events. Phases indicate subsets of samples where no stratigraphic order is imposed.
click on image to open in a new tab
LeFevre et al (2018)
Age Model
Figure S5
Computed age model from OxCal v4.26 for the seismic events recorded in the trench
click on image to open in a new tab
LeFevre et al (2018)
Radiocarbon Table
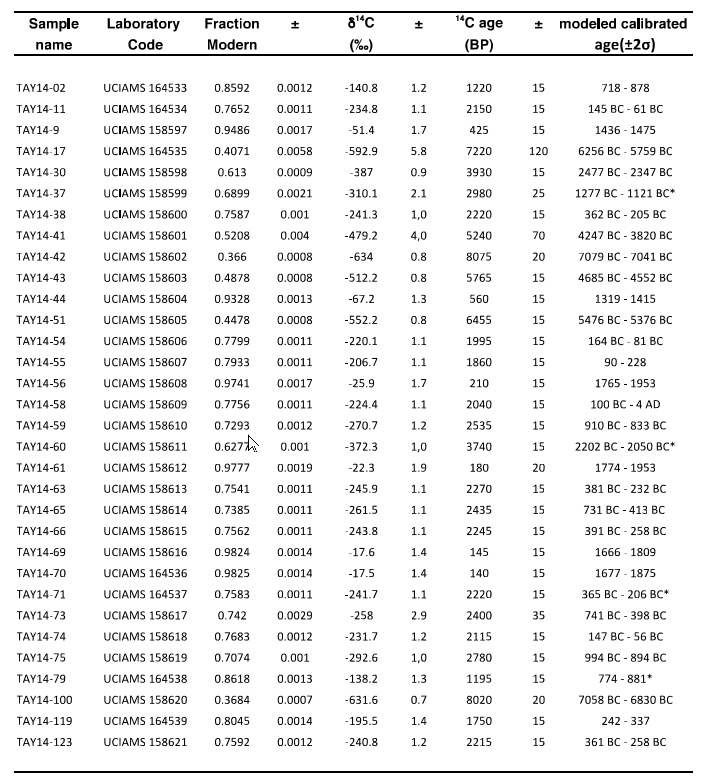
Figure S1
Mass Spectroscopy measurements were made at the Keck carbon cycle mass spectroscopy facility at University of California, Irvine. Ages were calibrated using OxCal 4.2 and calibration curve INTCAL13. Calibrated ages are given in date Before Christ (BC) or After Christ (AD). Radiocarbon concentrations are given as fractions of the Modern standard, D14C, and conventional radiocarbon age, following the conventions of Stuiver and Polach. Sample preparation backgrounds have been subtracted, based on measurements of 14C-free wood. All results have been corrected for isotopic fractionation according to the conventions of Stuiver and Polach, with δ13C values measured on prepared graphite using the AMS spectrometer. These can differ from δ13C of the original material, if fractionation occurred during sample graphitization or the AMS measurement, and are not shown.
* Samples that are out of stratigraphic order, most probably reworked. They are not included in the age model.
click on image to open in a new tab
LeFevre et al (2018)
Event E11 - 6100-5400 BCE
Discussion
Lefevre et al. (2018)
Abstract
Temporal distribution of earthquakes is key to seismic hazard assessment. However, for most fault systems, the shortness of large earthquake catalogues makes this assessment difficult. Its unique long earthquake record makes the Dead Sea fault (DSF) exceptional to test earthquake behaviour models. A paleoseismological trench along the southern section of the DSF revealed twelve surface-rupturing earthquakes during the last 8000 years, of which many correlate with past earthquakes reported in historical chronicles. These data allowed us building a rupture scenario for this area, which includes timing and rupture length for all significant earthquakes during the last two millenaries. Extending this rupture scenario to the entire DSF south of Lebanon, we were able to confirm the temporal-clustering hypothesis. Using rupture length and scaling laws, we have estimated average co-seismic slip for each past earthquake. The cumulated slip was then balanced with long- term tectonic loading to estimate the slip deficit for this part of DSF over the last 1600 years. The seismic-slip budget shows that the slip deficit is similarly high along the fault with a minimum of 2 meters, which suggests that an earthquake cluster might happen over the entire region in the near future.
Introduction
Successions of intense periods of seismic activity rupturing significant length of a fault followed by longer periods of seismic quiescence have been documented along several strike-slip faults 1, 2, 3, 4, 5, 6, suggesting that temporal clustering of earthquakes might be a common behaviour for major strike-slip faults. Testing this assumption, however, has long been hampered by the lack of consistent earthquake time series for long-enough fault sections. Moreover, temporal clustering remains a critical issue for seismic hazard models that only started to be addressed in the most recent modelling attempts.
The DSF, a 1200 km-long continental strike-slip fault, is the tectonic boundary between the Arabian plate and the Sinai micro-plate in the eastern Mediterranean region 7, 8 (Fig. 1). Previous works, based on geological data and reassessment of historical records, have hinted at seismic temporal clustering along some sections of the Dead Sea fault 6, 9, 10. Recently, the occurrence of the Mw 7.3 earthquake in the Gulf of Aqaba in 1995, the only large event along the entire Dead Sea fault for more than 200 years 11, 12, revived the question of the possible onset of a new earthquake series during the upcoming decades.
The DSF area has long been inhabited and it provides a unique historical archive including numerous earthquake testimonies 13, 14, 15, 16, 17. In several places these archives have been complemented by paleoseismological investigations to better locate past earthquakes and to expand earthquake catalogues in time 18, 19, 20, 21, 22, 23, 24. However, the 180 km-long southernmost section of the DSF on shore, named the Wadi Araba fault, remains less well known due to a lower population density. Hence, we opened a trench in the Wadi Araba to close the gap of paleoseismological data (Fig. 1). These new data were then integrated with the corpus of data already available to propose an earthquake catalogue including timing and rupture length for significant earthquakes for at least the last 1600 years, for the area from southern Lebanon to the Gulf of Aqaba.
This new dataset allowed us, using seismological scaling laws 25, to estimate average co-seismic deformation accommodated by earthquakes during the last 1600 years. It was then compared to regional tectonic strain accumulation, in order to assess the current slip deficit along the different fault sections. Finally, to better evaluate the seismic hazard associated with this fault, which lies close to several major cities such as Jerusalem, Amman or Damascus, we tentatively computed probabilities of occurrence of M > 7 earthquakes for different time periods, using simplified assumptions about earthquake recurrence.
Paleoseismological Observations
The Wadi Araba fault section is mostly linear with two noticeable fault jogs, the Yotvata playa, which is an extensional relay zone, and the compressional bend located at the Jabal al-Risha. They are located respectively about 30 km and 100 km north of the city of Aqaba (Fig. 2). At Jabal al-Risha, the fault strike changes from N17E southward to N12E northward over 20 km, producing a low relief that locally blocks westward-flowing drainages 26.
To test how this compressional bend might impact earthquake propagation along the Wadi Araba fault, we dug a trench 20 m long and 2.5 m deep at a site called Taybeh (30°22′40.71″N, 35°16′30.84″E). At that site, the topography associated with the compressional bend traps fine sediments while diverting the Wadi Musa, which is flowing westward from the Jordanian plateau (Fig. S1). The main active strike-slip fault runs across the distal part of the Wadi Musa alluvial fan where the fault location is only indicated by small push-ups popping up through the surface of the fan.
Three trench walls were excavated (one wall facing south, and two peels facing north) that are summarized hereafter (full description of stratigraphy and evidence for individual earthquake identification are provided as electronic sup.). The stratigraphy exposed in the trench is quite diverse. Four main units can be distinguished (Figs 1a,b; S2 and S3). The lower unit consists of coarse alluvial deposits. Nested channels including gravels to fine sand characterize the middle unit. The upper section of the trench is composed of a 1 m-thick succession of distinct laminated sandy layers. Lastly, a massive reddish sandy unit is popping up through the trench stratigraphy between marks 3 and 9, which is interpreted as a small push-up, based on strong similarity in material and appearance with the observed push-up located a hundred meters south of our trench (Fig. S1). Moreover, this unit is affected by numerous fractures defining positive flower structures consistent with compressional deformation. Stratigraphic relations suggest that the top part of the push-up was eroded with subsequent deposition of sediments on top of it. At marks 9 and 7, some of these younger sediments show signs of apparent normal faulting that necessarily post-date the emplacement of the push-up, emphasizing the changing nature of small-scale vertical deformations along major strike-slip ruptures during successive earthquakes.
Although deformation is visible throughout most of the trench, it is more pronounced around mark 17, where deformation is mostly characterized by normal displacement and cracks, while evidence of strike-slip motion remains elusive.
We identified event horizons based on offset layers and consistent groups of cracks (a minimum of 4 different cracks in that case) ending at the same stratigraphic level 27. However, the central push-up disrupts the general stratigraphy, making it difficult to unambiguously establish the lateral continuity of these event horizons between the eastern and the western part of the trench. Therefore we also had to rely on 14C dating of charcoals to strengthen the stratigraphic sequence across the trench. Thirty-two charcoals distributed over the three trench walls were dated by accelerator mass spectrometry (Tablesup1; Fig. S4). The chronological sequence was then refined using a-priori information derived from stratigraphic relationship of 14C samples, following a Bayesian analysis approach in Oxcal 28.
Eventually, the Taybeh trench displays an 8000-year-long sedimentological record, without major sedimentary hiatus. The dates of the seismic events span from the 7th millenary BC to the 18th century AD (Figs 3a; S5; Tablesup 1). Detailed description about specific association between earthquakes observed in the trench and historical events is found in the supplementary materials, and hereafter correlations are only summarized. Among the 12 identified events, the oldest three cannot be associated with specific historical earthquakes due to loosely- constrained ages and scarce to nonexistent testimonies. However, we correlate the next 8 earthquakes with historical events. The correlation for events E8 to E6 remains relatively uncertain due to the lack of historical reports; nevertheless we suggest that event E8 is associated with the mid 8th century BC event, event E7 with the mid 4th century BC event and event E6 as the mid 2nd century BC event. From event E5, association between our observations and historical catalogues is stronger and only these events will be used in the following part of this work. E5 is associated with the 31 BC event and E4 with the 114 AD event. We correlate E3 with the 8th century AD crisis, E3bis with the 1293 AD event and E2 with the 1458 AD event (Fig. S5). The most recent event is dated around the 18th century AD, a time when no major earthquake is documented in the area. Hence, we assume that it is a smaller-magnitude earthquake, such as Mw5 to Mw6. Indeed, Liu-Zeng et al. 29 showed that under favorable conditions surface rupture of local moderate-magnitude earthquakes could be preserved in the stratigraphy.
Earthquake rupture length in the Wadi Araba
Trenches provide local information on ground- rupturing earthquakes. Hence, combining several trenches helps determining the rupture length of past events, which is a proxy for the earthquake magnitude 25. To establish the rupture length of past earthquakes for the Wadi Araba fault, we combined direct evidence of ruptures at our new site of Taybeh, with evidence from the site of Qatar 24, about 30 km north of the city of Aqaba, and from the site of Tilah 21, located just south of the Dead Sea basin (Fig. 2). These data were complemented by information regarding historical destructions 16, including in Aqaba and Petra 30 and by observation of seismites in the Dead Sea basin 31. Moreover, as earthquake ruptures tend to initiate or end at major jogs 32, 33, at first order fault segmentation based on such geometrical asperities provided a template for potential ruptures scenarios.
In the following, we detail observations and our assessment of rupture length for three events, 31 BC, 114 AD and 1458 AD, characteristic of the different cases we encountered. A full description of the same process for all events considered in our study can be found in supplementary materials.
Two events are observed only in the Taybeh trench and are hardly reported in local historical chronicles, the 31 BC and the 114 AD events, making determination of rupture length difficult. The 31 BC event is documented in our trench and recognized at several places in seismites of the Dead Sea, with larger deformation in the southern part of the basin 31. Damage was reported in the area around Jerusalem, although the severity of the damage remains arguable 16. Hence, we favored a rupture of the northern segment of the Wadi Araba fault ending in the Dead Sea. The 114 AD event is even less documented. Some damage is reported in Petra and along the road from Petra to the Mediterranean sea 16 that are possibly associated with an earthquake. The timing of a limited group of cracks in the Taybeh trench is also consistent with these reports, which would confirm the occurrence of an earthquake at that time. However the scarcity of evidence indicates that, if it did occur, it was probably a moderate magnitude event. Hence, we assume that it ruptured partially the central segment of the Wadi Araba fault, as it is not found at the Qatar site 24.
For better documented events, we firstly consider the sites where a surface rupture associated with the event is visible to determine a minimum lateral extent of the rupture. We then use the historical data to refine the limits of the rupture. For example the 1458 AD earthquake is recognized both in Taybeh and in Qatar 24, indicating that the rupture was at least 65 km long. It did not seem to have extended further southward as no damage was reported in Aqaba. To the north, an event with an overlapping age is found in the seismites of the Dead Sea 31 and damage is documented in several places in the south of the Dead Sea. However, this event seems to be absent from the paleoseismological record at the site of Tilah 21, suggesting that it did not rupture up to the Dead Sea and was limited to the central part of Wadi Araba.
Eventually, combining the new constrains brought by the Taybeh trench with data already available, we refined the regional historical catalogue of seismicity, possibly confirming the existence of the 114 AD earthquake, and we estimated rupture length for most past earthquakes along the Wadi Araba fault during the last 2000 yrs (Fig. 2).
Slip deficit assessment and implication for seismic hazard
To test the hypothesis of temporal clustering along the southern DSF, we expanded the earthquake catalogue for the area from southern Lebanon to the Gulf of Aqaba based on published literature (literature review in supplementary mat.) (Fig. 3a). As for the Wadi Araba fault, based on location of major jogs and bends we defined nine segments along the southern DSF, which are from south to north: three segments in the Wadi Araba, the Lisan peninsula segment, the Jericho segment, two segments in the Jordan valley, the Jordan Gorge segment and the Hula basin segment (Fig. 3d).
Then, historical earthquakes were systematically associated with one or several fault segments in a pattern that ensures consistency with available paleoseismological data 21, 22, 23, 24, 34, 35 and archaeological data 13, 36, 37, as it was done for the Wadi Araba. Figure 3a summarizes the distribution of Mw >6.5/7 earthquakes on the Dead Sea fault, including rupture length. It also includes a few lower- magnitude events, such as the 1834 event, which are poorly described despite being quite recent. The proposed catalogue does not cover the same time period for all fault sections, because different paleoseismological records do not span the same time period. Moreover, historical records are uneven and usually scarcer in less densely populated areas.
Overall, our catalogue shows that the seismic activity of the DSF is not regular through time. Short periods, lasting one to two centuries, during which the entire fault ruptures in a succession of earthquakes, alternate with longer periods of roughly 350–400 years with very limited seismic activity. Two periods of such intense activity can be recognized during the 8th and the 12th–13th centuries AD. A third period might also be identified during the 4th century, although ruptures along the Wadi Araba are missing, either because they were not recognized or that they did not happened (Fig. 3a). During each earthquake cluster the entire fault eventually ruptures, although the spatial distribution of earthquakes seems to be random and does not follow any obvious neighboring- segment triggering pattern. Limited data availability makes it difficult to assess the extension of a similar pattern of temporal clustering further north, in Lebanon and Syria. However, historical and paleoseismological data suggest that the period of the 12th to 13th centuries AD, at least, was also a period of intense seismic activity along the northern section of the DSF 19, 38, 39, pointing out that temporal clustering might dominate the seismic activity along the entire DSF.
Using the assumed rupture length of each earthquake presented in the catalogue, we can estimate the average coseismic displacement accommodated by these earthquakes. We compared this displacement with the accumulated slip due to tectonic loading. Since the seismic activity seems clustered, we needed to consider several seismic cycles to average out slip variability. Hence, we included the longest possible time period where we consider we have a complete catalogue of significant earthquakes for the entire fault, starting back in the 4th century AD. This time window comprises at least 3 seismic crises, i.e. several significant earthquakes for each fault section, and it should be representative of the fault behaviour, including short-term variability. We assumed, as an initial condition, that just after the seismic crisis of the 4th century AD, most of the stress had been released everywhere along the fault. For the three segments that did not rupture during the 4th century AD crisis, the Lisan peninsula and northern parts of Wadi Araba, we extended the time period to the closest earthquakes before the 4th century AD, respectively in 31 BC and 114 AD.
The total co-seismic displacement was computed by summing up average displacement associated to each earthquake. The latter was obtained by combining the hypothesized rupture length for each earthquake in the catalogue with the empirical law relating the surface rupture length (L) to the average displacement (AD) for strike-slip earthquakes: log(AD) =−1.7 + 1.04 log(L) 25. In the computation we considered two extreme scenarios, corresponding respectively to the maximum and minimum released co-seismic displacement. In the first one, for each earthquake, we use the maximal value for the rupture length that would still be consistent with all the observations. For example, for the 8th century seismic crisis, in the Wadi Araba we considered one single rupture, about 210 km-long, rupturing the entire Wadi Araba. Conversely, in the second scenario we assigned the shortest possible rupture length to each earthquake. Therefore, in the case of the 8th century crisis we considered a series of three smaller-magnitude events, one on each segment (60 km long in average). In addition, for the second scenario, specifically for the Jordan Gorge section, we used direct measurements of earthquake displacements instead of modeled values, based on 3D paleoseismic observation 40. These displacements are smaller than values derived from scaling laws 25. Part of this difference might be explained by the trench location at the end of the fault section. Direct offset observations are also available in the Wadi Araba 21, 41, at Tilah an aquaduct is offset by 1.6 ± 0.4 m 21 and a water reservoir by 2.2 ± 0.5 m 41, 42. These values are consistent with values predicted by scaling laws 25. When available, we include earthquake magnitude. For our area, only the magnitude Mw ~6.3 of the 1927 AD event was recorded 43. The magnitude Mw ~6.3 is smaller than the magnitude that would be derived from the scaling laws using the rupture length associated to the 1927 event. Hence, in our lower slip scenario we use a slip value consistent with the Mw ~6.3 magnitude, rather than slip directly modeled from rupture length. Eventually, despite the length of the host faults, we considered for the computation that the 1068 AD, 1113/1117 AD event and 1834 AD event were of smaller magnitude, around 6.5–6.9, because the historical reports for these events are vague and suggest limited damage. In general taking into account measured values of displacement participates to lower the stress released per event.
We acknowledge that the segmentation we use and the fact that all events rupturing the same section of fault have the same rupture length are oversimplification. However, a sensitivity test shows that for our average fault-section length of 60 km, a variation of 20% of the rupture length would lead to an average change in slip of about 0.24 m, which is not very significant when considering the total cumulative slip. Indeed, because interpretation of historical data in some cases remains arguable, alternative scenarios for lateral extent of historical earthquakes, that would affect the distribution of cumulative slip to some extent, could never be totally ruled out (see alternative scenarios in sup. mat.). We favore here a scenario that is consistent with all available data and that minimizes assumptions.
In parallel, we computed the accumulated strain due to tectonic loading over the same time period for each fault section. Comparison of geologic and geodetic slip rates along the DSF shows that the slip rate is steady over the Holocene 44, 45, 46. Hence, for our calculation we used the geodetic rates published for the different fault sections, which are consistent in the limit of uncertainties all along the fault: For the Wadi Araba and the Lisan peninsula segments we used respectively a slip rate of 4.7 ± 0.7 mm/yr, and 5.5 ± 0.3 mm/yr 47, for the Jordan valley we used a rate of 4.7 ± 0.5 mm/yr 48, and for the Jordan Gorge and the Hula basin segments we used a rate of 4.1 ± 0.8 mm/yr 49. On the northern segment of the Jordan valley Hamiel et al. 49 suggest that 10% of the seismic moment is released by a 1.5 km-thick surface creeping layer, which contributes to reduce the accumulated constraint. For this segment we calculate an equivalent slip rate of 3.7 mm/yr, which includes the reduction of accumulated seismic moment.
When we compare the cumulative deformation accommodated by earthquakes with the tectonic strain accumulated over the same period, we found that there is a significant deficit of seismically released strain for most fault sections, even when one considers the scenario with the maximum rupture length for each event, i.e. the largest magnitude and slip per event (Fig. 3b). In this maximum scenario, on average about 2 meters of slip deficit accumulated during the last 1600 years all along the fault, which would correspond to a magnitude Mw 7.3 event on each section to fully release the current accumulated slip. However, the amount of slip to be released might be lower in this area, if one considers the extremely low level of current microseismicity in the Wadi Araba 50 as the signature of very large earthquakes rupturing deeper than classical seismogenic crust and associated with very large slip 51. The alternative scenario, involving smaller- magnitude earthquakes, implies a more significant slip deficit, around 5 m for most of the fault sections (Fig. 3b), which should translate either in a flurry of magnitude 7+ events or in much larger magnitude events (>7.5), which have never been reported yet south of Lebanon.
In both scenarios, even if the seismic history of each section differs, it is worth notice that the difference between the accumulated and the released slip appears to be relatively uniform along the entire fault, which argues in favor of earthquake temporal clustering along the Dead Sea fault.
Even if all the sections present a similar slip deficit, each segment underwent a different seismic history, which influences the likelihood of an earthquake to occur on each specific segment. Hence, in order to specify the areas where seismic hazard is higher, we computed a probability of earthquake occurrence on each segment following the probabilistic scheme proposed by Savage 52, 53 (complete description in the supplements). This model considers that the conditional probability of a future event can be estimated from the observed recurrence interval alone. However, these probabilities should be considered as indicative and only first-order calculations, as such model does not consider temporal clustering and all segments are considered independently for the computation.
Our model counts the number of inter-event periods that are shorter than the prediction window (time between the last event and the targeted date for probability calculation) and uses it to establish a probability of earthquake occurrence. The probabilistic model is Manichean, which introduces a bias for the interpretation of the probability; if the observed recurrence time is close but slightly longer than the prediction window, the probability will be rather low. Conversely, if the observed recurrence time is slightly shorter than the prediction window, then the probability will increase significantly. This is the case for example for the central Wadi Araba segment, where the probability of occurrence of an earthquake is substantially (30%) larger for the next 80 years than for the next 50 years (Fig. 3c). Hence, we consider that the entire confidence interval for the probability is more representative than the nominal probability to assess seismic hazard along the DSF. The probabilities of earthquakes along the southern DSF for the next 50 years and 80 years are relatively high everywhere, generally higher than 50%. This is in accord with the homogenously high-slip deficit presented previously and it supports the possibility to have clustering or single large ruptures on the DSF.
The new paleoseismological site of Taybeh enriches the data about the seismic history of the DSF. Moreover, we were able to estimate a slip deficit for the southern part of the fault, which has a critical implication for the assessment of seismic hazard. Indeed independently of any specific scenario considered, all the sections between Aqaba and South Lebanon present a similar slip deficit, which is quite large, at least 2 m, associated to a homogeneously high probability of earthquake occurrence. The irregular seismic activity presented by the earthquake catalogue and the fact that the fault presents a homogeneous slip deficit everywhere support the assumption of temporal clustering.
Supplemental
1. Units and fault zone descriptions
The trench is about 20 m long and 2.5 m deep. We can distinguish four main units, characteristic of different depositional environments (Fig. 1, Fig. S2). Each unit consists in a series of individual layers. The different strata consist in medium to coarse sand with few clasts and silts. The thickness of the layers varies from a couple of centimeters to a few decimeters. The units tend to be more homogeneous and finer in the upper part, while sediments become coarser and more discontinuous in the lower part.
The central unit between marks 3 and 9 (M3-M9) is a reddish unstratified indurated sandy unit with gravels aligned vertically along fault zones (unit A, Fig. S3). This unit (A) has a structure similar to the one of the small push up located a hundred meters to the south of our trench and that brought reddish gravelly sand to the surface (Fig. S1). In our trench, however, this structure has been partly eroded and does not reach the surface).
At the base of the trench there is a coarse unit (unit B), which contains two layers B1 and B2. The lowest layer (B1) consists of a conglomerate of matrix-supported pebbles, overlaid by a layer of indurated fine to medium yellow sand including some thin indurated clayey beds and gravels (B2). The conglomerate (B1) is not continuous laterally: it is visible only between marks M17 and M19, between M12 and M9 and at M2. Layer (B1) is thicker east of unit A, with a triangular shape thinning out eastward and unit A partly overthrusting on layer (B1). Although no obvious bedding could be seen in layer (B1), the compressional nature of unit A suggests that part of layer (B1) was dragged upward during successive activations of the push-up.
The unit Cu1 is characterized by channels, some of them flowing perpendicular to the trench, as shown by the lens shape of the gravel beds. The thickness of this unit varies across the trench exposure, to become thinner west of unit A. This variation may be due to the fact that water coming from the Jordan plateau is deflected by the local topographic barrier created by unit A. The numerous channels in this unit are characteristic of an environment with significant precipitation and dynamic water flow, which could be associated to one of the major wet phases of the Holocene in ~5.6-3.5 cal kyr BP.
The upper 1.3 meters of the trench are formed by a series of sub-horizontal laminated sandy layers, beige to dark brown in color. Most of these units can be followed across the trench. These layers are labeled C to layer M (Fig. S2-S3).
Layers C to E are visible only on the eastern part of the trench. C is a thin layer of homogeneous brown sand, more humid than the surrounding units. Layer D is more heterogeneous, as it contains small lenses of gravels in the sand. Layer E is light beige and made of fine sand. Top of layers C-E is characterized by an erosional surface. Units Cu2 directly above this contact show local interfingering with coarser channel material in the middle of the trench (M9-13). This unit is made of finer material and becomes sub-horizontal in the eastern end of the trench. In some place we can distinguish three sub-layers in this unit (M16-17) but these are not continuous, and we consider them as one single unit. As for layers C to E, this unit is not visible in the western part of the trench.
The layer F is a 10 cm-thick laminated beige layer. It is made of fine sand and few scattered gravels. The layer G is a laminated coarse sandy layer. This layer is coarser on the eastern part with gravels and pebbles and shows finer material in the central part (M9-16). On the western part of the trench this layer is thicker and it contains finer laminated sand. On top of G sits the layer H with an erosional contact between G and H. Layer H is brown in color, composed of sand with a large amount of coarse gravels. The layer I is a brown bedded sandy layer including laminas of clayish material white to dark brown in color. Layer J is a fine yellow sandy layer, which can be followed across the trench, although it gets thinner and discontinuous between M17 and M3. A thin discontinuous coarse layer characterized by small gravel lenses erodes into this layer. These lenses form the base of a thick beige laminated sandy layer, the layer K. This layer is well visible in the eastern part of the trench, but seems to be interrupted westward at M9. It is difficult to determine with certainty if it continues further west because of the lateral variation of facies. However, stratigraphic relations argue for a continuation of layer K between M1-M9. Indeed, the lower unit J is visible but discontinuous between M1 and M9, just below a thick unit coarser than the unit K on the eastern part. This coarser unit could be the continuation of layer K, acknowledging some lateral variation of facies that could be due in part to strike-slip motion along faults in a direction perpendicular to the trench. The lack of datable material in the eastern part of layer K prevented us from testing further lateral continuity of the units.
At M9 units F to L are all affected by the fault zone, with the western side going down. A channel is nested at the toe of the scarp, which erodes into unit K between M9 and M3. This brown to dark brown channel unit (Cu3) shows large gravel lenses cross-bedded with sandy and more clayish beds. The layers L and M are the only traceable layers across the entire trench. The layer L is a laminated sandy layer containing few pebbles and gravel lenses. Its thickness decreases westward. This layer is erosive into layer K. The layer M is a fine to coarse sandy layer. It contains pebbles and small gravel lenses and clayey beds. In the western section few desiccation figures are visible.
The deformation is distributed over 15 m, with two main zones where it is larger. On the western end, between M3 and M9, faulting is mainly associated to the push-up structure formed by unit A. Cracks and fissures show opposite dip on each side of this structure. On the western side of this structure, faults are almost vertical with a slight dip eastward consistent with some minor thrust component of motion related to the push-up structure, in addition to dominant strike-slip faulting. On the eastern side of unit A, faults have a shallower westward dip. Although the stratigraphic position of unit A above unit B suggests that at some point these faults did accommodate some reverse motion in addition to strike-slip, according to obvious offset layers from layer C upward, these faults have mostly accommodated normal faulting during recent activation, in addition to the strike-slip. This motion is consistent with motion accommodated in the second main fault zone located between M16 and M18. In this fault zone, faults and cracks dip westward with an average dip of 60°. In addition to strike-slip, these faults are responsible for down-dropping the western part of the trench relative to the eastern part. The vertical motion mostly concentrates at M10 with at least about 30 cm of vertical displacement since 2000 years if we use unit F as a reference. This results in part in thickening of units westward.
As often, strike-slip motion is hardly recognizable in a fault-perpendicular trench as it results mainly in abrupt facies or thickness changes due to lateral motion. In our case, as our trench is located in quite an extensive bajada, these changes are even more difficult to see.
2. Description of earthquakes ruptures
The identification of earthquake ruptures is mostly based on consistent upward terminations of sets of cracks that vertically offset sedimentary units. It follows the assumption that earthquakes ruptured the surface, thus we focus only on the large events. In the Wadi Araba the l locking depth is estimated to be around 12 km. Following the scaling laws of Wells & Coppersmith, events of magnitude 6.6 or above will break the entire brittle crust, which is comparable to the commonly used value of Mw = 6.5. Some smaller events could also be recorded in the trench, if they occurred close to the surface. For the coarser units, like conglomerates, it is particularly difficult to identify the exact location of some cracks termination. However, as coarser units are mostly located at the base of the trench, we consider that we recorded well the major events in the trench, at least for the most recent ones.
Eleven events have been unambiguously identified in our trench, and one additional event E5 is less constrained as it is associated to only 4 cracks (Fig. S2). The older events, E11 to E9, are observed in the coarsest layers, which present erosive limits, thus deformation associated to these events in the trench is less pronounced than for more recent events. E11 is associated with cracks in the western part of the conglomerate (B1). As the contact with the layer deposited on top of it is erosive, we cannot see any vertical displacement, but cracks are well marked and underlined by rotated vertical pebbles. The presence of an erosive contact implies larger uncertainties on the age of this event, as the actual upper termination of cracks is unknown.
The event horizon associated to E10 is located on the top of layer B2. The evidence for this event is largely distributed and can be found both at the eastern and western ends of the trench. At M2 there is a small vertical displacement attributed to E10. The other cracks do not show visible displacements, which could be due to the erosive channelized units (Cu1) lying atop of layer B2.
The channel unit (Cu1) can be divided into two main layers separated by an erosional contact, which follows the base of the channel lenses. This contact marks the event horizon for event E9.
The latter events broke and displaced the succession of sub-horizontal sandy layers. The associated deformation is more concentrated in two main zones, one between M18 and M16, the other at M9.
The event E8 is visible at M16, where the layers C and D are displaced downward (~3 cm). Cracks associated to E8 are also observed within layer E, but the top of layer E is not deformed. Therefore, we consider that the event E8 occurred during the deposition of layer E.
The next event, E7, corresponds to a set of small cracks at M17. These cracks reach the top of layer F, they are associated with a small vertical displacement. However, as layer F is made of fine laminated sand the presence of cracks is unambiguous. Based only on trench observation, one cannot exclude that the cracks associated to E8 and E7 correspond only to accommodation faulting produced by more recent earthquakes. Indeed some of them do not root deeply or seem to be shaped as a pull-apart structure, which weakens the evidence for independent events.
The event E6 is defined by a set of faults reaching layer H, which is a thin, brown coarse layer. So it is difficult to see the end of the cracks. In addition, the base of this layer is irregular so we cannot identify any displacement. The cracks, however, are clearly visible in layers F and G, which are more laminated and made of finer materials.
Then event E5 is characterized by a limited number of cracks at M10-M9, they reach the top of layer I. In this brown layer there is a small intermediate darker bed, which shows a small vertical displacement.
The event E4 is not well marked in the trench. A series of cracks goes through the fine yellow sandy layer (layer J), but it is unclear if they stop at the top of layer J or if they also affect the layer above. Indeed, on the top of layer J sits a thin discontinuous layer of gravels where the deformation might be difficult to recognize.
The next event, E3, caused a major deformation in this area. There are series of cracks at M17 and at M9, which stop at the top of layer K, a fine pinkish sandy layer, with almost no clasts. The deformation due to this event is clearly identified in the eastern part. At M9 the layers I, J, and K are clearly displaced downward (~25 cm). The amount of displacement is actually larger than the displacement affecting layers directly above these units, attesting for a separate event. Its continuation in the western part of the trench is less clear because of the uncertainty on the identification of layer K at this place. But if we assume that layer K continues westward across the trench, although facies changes significantly, all cracks between M3-M7 reaching the base of the channelized unit (Cu3) would also match with the event horizon of E3.
The next event is associated to another series of cracks stopping at the base of layer L. This series is located at M8 and M4 in an erosive channel unit deposited on top of the scarp of event E3, so the associated event, E3Supp, postdates E3.
The event E2 is associated with a series of cracks located in the main zone of deformation (M18-M16). Its event horizon corresponds to the top of a sandy layer containing cobbles and some small gravel lenses (layer L). Between M17 and M16 this event produced an important vertical displacement (6-9 cm), which is clearly visible in layers I, K, and L.
The last event is marked by two sets of fractures located in the two main zones of deformation (M18 and M9), these cracks reach the top of layer M, a light pink laminated sandy unit. Only minor deformation is associated to these cracks visible in the trench. There is also a small group of cracks affecting only unit A. As unit A is eroded on the top, there is no offset associated to these cracks, but they are clearly identifiable through a succession of oriented gravels and pebbles.
3. Timing of events and Identification of historical earthquakes
Time constraints were derived from accelerator mass spectrometry (AMS) radiocarbon dating of detrital charcoals. The trench exposure presents a relatively rich and well-distributed amount of datable material. 32 charcoals coming from the two walls of the trench were dated (Tablesup 1, Fig. S4), we mainly used material from the southern wall, and few charcoals were collected on the other wall (charcoals 2, 9, 11, 17, 100, 119, 123) when there was no datable material on a layer in the studied wall. Only 4 samples (37, 60, 71, 79) had to be rejected, because their ages were significantly older than the other ages, relatively to their stratigraphic position. We interpreted them as likely reworked samples.
The time record is relatively complete and regular (Fig. S4) at least for the upper units, i.e. for the last 3 ky. For the lower units in the trench, several erosive contacts have been identified. General continuity in our age distribution (Fig. S4), however, indicates that if we have hiatus in our trench, they have to represent only short periods of time, minimizing our chances to miss a major earthquake in our sedimentary record. The unit A is the oldest unit and dates back to 9 ky B.P., the layer at the base of the trench (B2) is dated at 8 ky BP. The chronological sequence is refined by combining a-priori information from stratigraphy relationship and 14C ages in the Bayesian analysis approach of Oxcal6. According to the locations of the samples, phases have been defined to group samples that belong to the same unit and could not be clearly ordered based on stratigraphic position (Fig. S4).
The Taybeh trench exhibits evidence for at least 11 paleoearthquakes, and one more uncertain event. These earthquakes occurred during a period covering 8 ky (Fig. S5). We benefit from solid time constraints for the last 3 ky, which is also the period when historical and archaeological data are more numerous and accurate. However, no datable material could be found between the event horizons of E4 and E5, making the dating of this pair of events difficult because we cannot discriminate correctly these two events. The cracks affecting only the push-up structure are not dated, as the age of this unit is around 7000BC and this is the oldest unit of the trench. We only know that these cracks developed before the deposit of layers G and I, which are erosive on unit A.
In the following, each event in the Taybeh trench is identified by combining dating obtained using Oxcal and historical descriptions, which cover a wide region. All locations mentioned in this text are indicated on Figure S6. In the area, the historical reports are numerous and continuous in space and time. They give indications about the size of the earthquakes and thus contribute to constrain their lateral extent. For this area the seismites recorded in the Dead Sea are another source of information on earthquakes. Seismites are indicators of earthquakes occurrence in the area. They are intraclast breccia, which result from turbulences in the soft sediment created by strong shaking. They record earthquakes from the whole Levantine area and not only earthquakes rupturing faults located in the proper Dead Sea basin. They are good markers to evaluate basin effects and recurrence patterns. We used seismites to support the existence of an earthquake and to constrain the epicentral distance of earthquakes from the Dead Sea.
The three older events are poorly constrained in age as datable material has been very limited. The conglomerates at the base of the trench includes only one sample (17) for which dating gives a wide age range. Likewise the events E10 and E9 are not well constrained as their event horizons are surrounded by thick layers containing only one or two samples, which give us only an approximation of the ages of the layers. Hence, the time intervals given by Oxcal are too wide to estimate properly an age. The age for E11, E10 and E9 are respectively between 6.1 ky BC and 5.4 ky BC, between 4.6 ky BC and 4 ky BC, and between 2.4 ky BC and 956 BC (Fig. S5). The poor dating associated with the lack of historical data for this time makes the matching of these events with specific historical earthquake impossible. We can only notice the vague mention of two events in 2100 BC and 1050/1070 BC in the area, more or less confirmed by archaeological remains and the existence of seismites in the Dead Sea, which correlate with these two events.
The events E8, E7 and E6 are better constrained. Even if historical data about earthquakes during the corresponding periods are scarce, we can still propose a specific matching historical earthquake for each of these events.
The event E8 is dated between 885 BC and 514 BC (Fig. S5). This time interval is wide but covers only few documented events, although only one is described in details. In 759 BC an earthquake produced great destructions and many casualties in Judea, Samaria and Galilee. Zachariah gave around 520 BC (i.e., about 240 years later) a detailed description of the event, where he described a large landslide developing on the Mount of Olives, southeast of Jerusalem, without a clear origin. He suggests that it could be due to an earthquake. All the descriptions of this event concern the north of the Dead Sea. Ferry et al. also reported an event in a trench in the Jordan Valley that they associate to the 759 BC event. Finally, in their study of cores from the Dead Sea Kagan et al. identified two events in the mid 8th century BC. Historical information about an event in this period refers mainly to the Jordan valley event, but the event E8 could be the second event observed by Kagan et al., even if it remains uncertain in view of the scarce data.
The event E7 is modeled between 520 BC and 280 BC (Fig. S5), as for E8 the time interval is wide and very little information about events in this period is available. We could correlate this event with a down-faulting event along the northwestern tip of the Gulf of Aqaba, which is recorded by a buried coral-reef platform. This event has been dated using 14C and U-series on coral and yields ages of about 2.4 ka BP, which is in agreement with the seismic period of E7. Moreover in the Qatar trench an earthquake is identified for a period partly similar between 313 BC and 213 BC. It seems that the event E7 ruptured the central and southern part of the Wadi Araba. The northern limit remains uncertain, but as there is no indication of an event in the 4th century BC in the cores of the Dead Sea basin it seems that this event stopped before the Dead Sea basin, probably in the area of Taybeh.
The time interval associated to the event E6 is narrow, between 160 BC and 117 BC (Fig. S5). This period is compatible with a seismite layer dated about mid-2nd century BC that was consistently documented all around the Dead Sea basin, and was associated to a large magnitude event, which would have affected the northern part of the Dead Sea fault. We cannot really conclude about this event, as there is absolutely no mention of an earthquake in the southern part of the area. This event might actually be a small event triggered by a larger one, which occurred north of the Dead Sea, or could have ruptured the northern part of the Wadi Araba and be amalgamated with another event. In this case the fact that the Wadi Araba is relatively sparsely populated contrary to the Jordan Valley would explain why there is no historical report about this small event in this region.
4. Earthquake catalogue
In order to investigate the fault behavior and the regional seismic hazard along the southern Dead Sea fault, we established an earthquake catalogue for the part of the Dead Sea fault between the Gulf of Aqaba and the southern limit of Mount Lebanon. The catalogue is built by combining data from the literature (historical data and paleoseismological data) and paleoseismological results presented in this work.
To build the catalogue we firstly determine a simplified geometry of the fault, which describes the sections rupturing during an earthquake. The geometry we choose contains 9 segments that are described hereafter: The Wadi Araba section is split in three segments separated respectively by an extensional jog, the Yotvata playa, and a compressional jog at Jabal al-Risha. Similarly, the Jordan Valley section is also split in three segment: one segment parallels the western bank of the Dead Sea and ends just north of Jericho. The central segment stretches between Jericho and the Beit-She'an Valley, which is formed by the intersection of the Jordan valley fault (JVF) and the Carmel-Gilboa Fault System (CGFS), which branches westward from the JVF. The exact location where to end this segment in the Beit-She'an Valley is debatable, as the JVF and CGFS interact over a several kilometers long zone. In any case this zone is limited to the north by the northern margin of Beit-She'an Valley. The last segment extends from the Beit-She'an Valley to the northeastern shore of the Sea of Galilee, where the Jordan fault interacts with the Jordan Gorge section. North of the Sea of Galilee we defined two segments, the Jordan Gorge segment and the Hula basin segment.
In a second step we matched past earthquakes with fault segments.
In the Wadi Araba for the southernmost segment, between Aqaba and Yotvata, we used the catalogue proposed by Klinger et al. For the central and northern segments we used mainly the data of the Taybeh trench, the detailed description of the location of paleo-earthquakes on these segments is described above in this study.
Along the Jericho segment, we were able to relocate several events until the fifth century. The most recent one is dated from July 1927. It was the first significant event (Mw = 6.3) in the region to be recorded worldwide by seismometers. These records allowed assessing the epicentral location, which is on the western side of the Dead Sea, close to Mitzpe Shalem. Another recent earthquake might have occurred on this segment in 1834 AD. The 1834 AD event is mainly described north of the Dead Sea especially in Jerusalem where several minarets and churches collapsed. Damage associated to the 1834 AD earthquake was also reported in the cities of Bethlehem, Madaba, Nablus, Caesarea and in the Dead Sea basin where asphalt floated. Distribution of seismite in the Dead Sea basin argues for an epicenter rather close to the basin. Hence, this event occurred in the Jordan Valley, very likely along the Jericho segment. The historical descriptions of the 1546 AD event seem to indicate a similar intensity map to the 1927 event, hence we locate the 1546 AD event on the same segment. The May 29th 1068 AD earthquake is known mostly to have destroyed al-Ramla. Only slight damage is reported in the other places in the region. This event is mentioned briefly in Jerusalem and Banias. Hence, the scarcity of historical descriptions and their heterogeneities suggest a possible exaggeration of the damage. The area of distribution of the damage linked to this event points to a location in the Jordan valley. Ferry et al. see only one event at this time in their trench, which is located in the central part of the Jordan valley, and they suggest that it corresponds the 1033 AD event. Thus we assume that the 1068 AD event occurred on the Jericho segment. However, owing to the lack of historical data for this earthquake, its authenticity remains arguable and if it existed magnitude might have been smaller than previously proposed. Thus for the scenario considering the smallest extent for each earthquake we attributed a magnitude of 6.5 to this event. All the reported damage caused by the September 660 AD event were located on the western flank of the Dead Sea, Jericho was partly destroyed as well as several monasteries in this region, including St. John the Baptist monastery. Thus we assume that the September 660 AD earthquake occurred along the Jericho segment. This is also supported by the presence of seismites in at least two cores drilled in the Dead Sea. Another event dating back to 419 AD has been described in this area. However the available testimonies are less specific, several Palestinian villages have been allegedly destroyed, indicating that this event occurred along the Jordan valley. We favored the Jericho segment since Kagan et al. described it as an intrabasin seismite, implying that it took place close to the Dead Sea basin.
Along the central Jordan Valley segment, we used mainly the results of Ferry et al. to determine the chronology of earthquakes, except for the most recent events since the upper part of their trenches are plowed soils. The 1033 AD event appears on all four trenches both north and south of the segment. It was felt in Jerusalem, Ramallah, Jericho, Nablus and Tiberias and throughout Judea and Syria. Hence, we assigned this earthquake to the central part of the Jordan Valley fault, although we could not rule out that it could also have ruptured the northern part of the Jordan valley, in view of the macroseismic data. The second event recorded in Ferry's trenches dates from 749 AD. Great destructions and many casualties have been reported in Judea, Samaria and Galilee at this time. The mid 8th century is known in the Dead Sea area as a period of intense seismic activity and historical descriptions tend to merge multiple events together. Since this earthquake is also recognized in a trench north of the Sea of Galilee, we consider that it ruptured all three segments (the central and north Jordan valley segments and the Jordan Gorge segment).
Along the northern Jordan valley segment, the most recent event we identified is the 854 AD event. This earthquake caused several landslides around Tiberias, and many casualties in the city due to collapses. Before this event, the 749 AD event ruptured all the Jordan valley section. Another event described in this region is the 659/660 AD earthquake, which was followed by a large series of aftershocks. This event was reported in several places across Palestine. There is also some debatable evidence of an earthquake proposed at Gerasa and Pella. This report indicates a location of the earthquake in the Jordan valley. We assume that it occurred on the northern segment because there is no evidence of an event in the trenches on the central segment. Furthermore Wechsler et al. describe an event around that time at a site on the southern part of the Jordan Gorge in Beteiha. They propose that this event corresponds to the 660 AD event, which corroborates a rupture in the northern area of the Jordan valley. This earthquake would have ruptured the northern Jordan valley segment and the Jordan Gorge segment.
The Jordan Valley section of the DST is interpreted to have ruptured during the March 363 AD earthquake based on historical records. The historical descriptions cover a wide area, which extends from Banias in the north to Areopolis in the south. The southern limit of the area where this earthquake was felt is not well constrained because of the occurrence of another earthquake in the Wadi Araba the same year that lead to some confusion in descriptions. The 363 AD event is not clearly identified in the trenches on the central Jordan valley segment, nevertheless we can notice that there is one event in these trenches dated before the 6th century AD, but the time constraint is weak and it is not possible to conclude about the age of this event. As most of the site that where damage during the 363 AD event are located west of the Jordan valley, it has been proposed that this earthquake occurred on the Carmel fault. However such asymmetry, which is observed for several events in the area, might also in part be attributed to the difference of density of population between the Eastern and the Western Levant. Moreover Wechsler et al. identified in the Beteiha trench displacements associated to three events occurring in the 4th century AD. The authors assume that one of these events could be the 363 AD event, so the 363 AD-earthquake rupture reached as far north as the Beteiha valley. Based on this observation we proposed that the 363 AD event ruptured the Jordan Valley fault. The southern limit remains unclear, but in view of the historical report distribution this earthquake was quite important and ruptured at least the northern segment of the Jordan Valley and most probably the central segment too.
5. Alternative scenarios
For several events described previously we have seen that uncertainties remain about their extensions and limits, or even their locations. In the precedent sections we have presented the historical and paleoseismological data about past earthquakes available in the area, and then our favorite scenario. Here we will focus on possible alternatives for this scenario and evaluate the impact on our output model.
Most alternatives deal with the Wadi Araba, and the identification of historical events at Taybeh and Tilah. We present only one change concerning solely the area north of the Dead Sea.
Alternative 1: the northern limit of the 363 AD and 749 AD ruptures along the Jordan Gorge segment is located further north
Our favorite scenario considers that the 363 AD and 749 AD earthquakes, observed in the Jordan Valley trenches and widely reported in this area, ruptured the north Jordan Valley section up to Beteiha, but not the entire Jordan Gorge segment, as they are described in the 3D trench by Wechsler et al. but not in the Vadum Jacob site. In figure S7 the slip deficit is calculated considering that these events ruptured also the Jordan Gorge section. This change implies a slightly smaller calculated slip deficit in the Jordan Valley although it does not impact our conclusion. Indeed, for the 749 AD earthquake we always used the co-seismic displacement measured in trench to assess the lower slip-deficit value.
Alternative 2: effect of the location of the northern limit of the 363 AD rupture
At Taybeh we propose that the event E3 correspond to a 8th century event, which implies that the 363 AD event does not reach Taybeh. We previously limited the rupture of the 363 AD event to the southern Wadi Araba segment. Nevertheless as strike-slip ruptures do not always stop at fault discontinuities, we can wonder if this earthquake extends further north. In figure S7 we consider that the 363 AD event ruptured the southern and central segments of the Wadi Araba, and stopped at the southern limit of the Risha compressional jog. This modification reduces the slip deficit the central Araba segment to 0.7 m and leads to relatively small values of slip deficit in the Wadi Araba.
Alternative 3: the event E3 is associated to a 7th century AD earthquake
Another debatable point is the identification of E3 as a 8th century AD event rather than a 7th century AD event as in Tilah. Indeed in Tilah Haynes et al. described two events during this period, one in the 7th century AD and another between the 7th and the 11th century AD, whereas there is only one event recorded at Taybeh for this period. We firstly favor a scenario with a large 8th century AD event in the whole Wadi Araba and a small 7th century AD event in the north. In figure S8 we present a scenario with a 7th century event between Taybeh and Tilah and two 8th century AD events. This scenario leads to very large slip deficits in the Wadi Araba, up to 7.2 m. Accommodating such large slip deficit in one earthquake implies very large magnitude (M > 7.5) earthquake, which have not been documented along the DSF so far.
Alternative 4: combination of alternatives 2 and 3
The previous two alternative scenarios have opposite effects. Thus we tested both changes together (figure S9). We observe that the lengthening of the 363 AD event is not enough to compensate the shortening of the 8th century AD event. That support again the fact that very large earthquakes occur occasionally.
Alternative 5: effect of the location of the northern limit of the 1293 AD earthquake
Another debatable point is the limit of the 1293 AD event. We previously considered that the 1293 AD event was visible at Taybeh and Tilah, thus it would have ruptured the section from Taybeh to the Lisan Peninsula. Nevertheless, the dating of the events at Tilah allows for another interpretation, with a 9th century AD event. We present in figure S10 an alternative of our scenario with a 9th century AD event located on the Lisan Peninsula segment and the 1293 AD event, which is recorded at Taybeh, to rupture the section between Taybeh and Tilah. This scenario increases significantly the slip deficit on the concerned segments. This supports the fact that the 1293 AD earthquake ruptures both sections.
It is noteworthy that if we consider that the 1293 AD earthquake ruptured the area from Taybeh to the Lisan Peninsula and that there is an additional event on the Lisan Peninsula during the 9th century AD, the slip deficit would decrease slightly. For the Lisan Peninsula section the slip deficit is then of 0.9 m (this scenario is not represented).
Alternative 6: the last event observed at Taybeh is correlated to the 1834 AD event
The last event observed in Taybeh is dated during the 18th century AD, as no major earthquake is described in the southern Dead Sea area we proposed that it could be a minor event, like a Mw 5-6 earthquake, locally recorded. But Agnon proposed that the 1834 AD event correspond to the last event recorded in Tilah. In that case the last event at Taybeh might also correspond to the 1834 AD event. In figure S11 we present the corresponding slip deficit. The deficit of the northern Wadi Araba segment is reduced to 0.7 m, which appears sensible. Nevertheless it increased noticeably the deficit in the Jordan Valley, where we have previously located the 1834 AD event. This scenario tends to increase the heterogeneity in the slip deficit along the fault. Moreover this location for the 1834 AD event is not fully consistent with the historical reports.
Alternative 7: impact of the occurrence of the 114 AD event
Finally as explained previously the event E5 remains ambiguous because of the few cracks visible in the trench and the controversial historical descriptions. Thus we propose an alternative scenario, which does not take into account the 114 AD event, which is presented in figure S12. In this case the balance is realized on more than 2000 years, and the accumulated slip deficit increases noticeably, which might be another evidence of the occurrence of this earthquake. Nevertheless if we consider that the 363 AD event ruptured also the central part of the Wadi Araba, which is a plausible alternative as explained before, the effect of the 114 AD event is not visible anymore in our balance, as this one is realized for the period since the 4th century AD crisis.
These alternative models show that scenarios, which do not include large events, are associated to very large deficit, until 7 m. These values appear quite unrealistic, which suggests that large earthquake occur episodically in the area.
6. Probability computation
To compute the probability of occurrence of an earthquake we followed the "empirical" model of Savage53. Savage proposed that the conditional probability of a future event might be estimated from the observed recurrence intervals. His method was later extended to include dating uncertainties of paleoseismic series54. The catalogue presents a number n of intervals for each segment. We count the number m of n intervals that are shorter than the period since the last event (T, T+ΔT). With success defined as an event falling in the interval (T, T+ΔT), and failure otherwise, the distribution governing the probability p of a future event in (T, T+ΔT) follows a beta distribution54:
P(p|m,n) = (n+1)! / m!(n-m)! pm (1 − p)n-m
For this distribution the mean and variance are respectively, p = (m + 1)/(n + 2) and σ2 = p(1 − p)/(n + 3). We define a confidence interval (C.I.) and determine plo and phi, as the 5% and 95% boundaries of P:
∫0plo P(p|m,n)dp = 0.05 and ∫0phi P(p|m,n)dp = 0.95
And C.I. corresponds to the integral of P(p|m,n) between plo and phi. We discuss only values of the C.I. that we consider as more representative to assess the seismic hazard. Usually the estimated probability improves with a longer record, but the large uncertainties in the empirical distribution of conditional probabilities show that even the present long paleoseismic series do not necessarily constrain uncertainties better when relatively few interval lengths are longer than the open interval since the last event.
Event E10 - 4600-4000 BCE
Discussion
Event E9 - 2400-956 BCE
Discussion
Event E8 - 886-514 BCE
Discussion
Event E7 - 520-280 BCE
Discussion
Event E6 - 161-117 BCE
Discussion
Event E5 - 14 BCE - 206 CE
Discussion
Event E4 - 80-142 CE
Discussion
Event E3 - 287-815 CE
Discussion
Event E3bis (aka E3supp) - 819-1395 CE
Discussion
Event E2 - 1448-1714 CE
Discussion
Event E1 - 1688-1800 CE
Discussion
Master Seismic Events Table
References