Shehoret, Roded, and Avrona Alluvial Fan Trenches
- Fig. 2 Morphologic Map
showing locations of Trenches T-6 to T-20 from Amit et al (2002)
 Figure 2
Map of the southern Arava Valley showing the main morphologic and morphotectonic elements of the southern Arava Valley. Notice marginal and central fault zones, the distribution of the trenches across the selected fault lines, and the location of the seismic lines. Trenches T-6, T-17, and T-16 are located along the same fault line.
Amit et al (2002) - Fig. 2 Geomorphic
Map of the southern Arava from Zilberman et al (2005)
 Figure 2
Geomorphic map of the southern Arava valley in the Avrona basin.
Zilberman et al (2005) - Fig. 1 Geologic Map
of the southern Arava from Zilberman et al (2005)
 Figure 1
Location Map of the study area.
Zilberman et al (2005)
- Fig. 2 Morphologic Map showing
locations of Trenches T-6 to T-20 from Amit et al (2002)
Figure 2
Map of the southern Arava Valley showing the main morphologic and morphotectonic elements of the southern Arava Valley. Notice marginal and central fault zones, the distribution of the trenches across the selected fault lines, and the location of the seismic lines. Trenches T-6, T-17, and T-16 are located along the same fault line.
Amit et al (2002) - Fig. 2 Geomorphic Map of
the southern Arava from Zilberman et al (2005)
Figure 2
Geomorphic map of the southern Arava valley in the Avrona basin.
Zilberman et al (2005) - Fig. 1 Geologic Map of
the southern Arava from Zilberman et al (2005)
Figure 1
Location Map of the study area.
Zilberman et al (2005)
- Shehoret, Roded, and Avrona
Alluvial Fan Trenches area in Google Earth
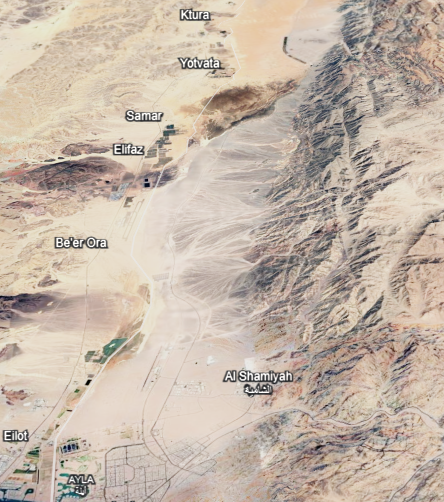 Shehoret, Roded, and Avrona Alluvial Fan Trenches area
click on image to explore this site on a new tab in Google Earth - Shehoret, Roded, and Avrona
Alluvial Fan Trenches area on govmap.gov.il
 Shehoret, Roded, and Avrona Alluvial Fan Trenches area on govmap.gov.il
click on image to explore this site on a new tab in govmap.gov.il - Fig. 9a Aerial photograph showing
locations of Trenches T-6 and T-15-19 from Amit et al (2002)
 Figure 9a
An aerial photograph of the Shehoret alluvial fan. Most of the trenches discussed in the paper are marked on this photograph. Notice the Holocene alluvial fan (Qa3) crossed by an asymmetrical, north-trending graben structure, marked by arrows.
Amit et al (2002) - Fig. 3 Aerial photograph showing
locations of Trenches T-20-22 from Zilberman et al (2005)
 Figure 3
Air photo of the Avrona playa showing the traces of the photogrametric topographic profiles (circles) and the sites of the trenches and exposures (rectangles) described in the text. The straight lineament that bounds and crosses the playa (dark area)represents a NNE-trending fault of the Avrona Shear Zone. This fault is trenched in T-20. The dark area bounded by straight lineaments corresponds to the uplifted sterile playa sediment. The light-tone areas mark the wide braided Wadi Avrona stream, which occupies a structural depression in the north and splits into several narrow and shallow streams within the playa area. The main faults are designated A–E; the profiles are labelled GI-0061, GI-0065 andGI-0074.
Zilberman et al (2005)
- Fig. 9a Aerial photograph showing
locations of Trenches T-6 and T-15-19 from Amit et al (2002)
Figure 9a
An aerial photograph of the Shehoret alluvial fan. Most of the trenches discussed in the paper are marked on this photograph. Notice the Holocene alluvial fan (Qa3) crossed by an asymmetrical, north-trending graben structure, marked by arrows.
Amit et al (2002) - Fig. 3 Aerial photograph showing
locations of Trenches T-20-22 from Zilberman et al (2005)
Figure 3
Air photo of the Avrona playa showing the traces of the photogrametric topographic profiles (circles) and the sites of the trenches and exposures (rectangles) described in the text. The straight lineament that bounds and crosses the playa (dark area)represents a NNE-trending fault of the Avrona Shear Zone. This fault is trenched in T-20. The dark area bounded by straight lineaments corresponds to the uplifted sterile playa sediment. The light-tone areas mark the wide braided Wadi Avrona stream, which occupies a structural depression in the north and splits into several narrow and shallow streams within the playa area. The main faults are designated A–E; the profiles are labelled GI-0061, GI-0065 andGI-0074.
Zilberman et al (2005)
Figure 2Map of the southern Arava Valley showing the main morphologic and morphotectonic elements of the southern Arava Valley. Notice marginal and central fault zones, the distribution of the trenches across the selected fault lines, and the location of the seismic lines. Trenches T-6, T-17, and T-16 are located along the same fault line.
Amit et al (2002)
 Figure 4
Log of the southern wall of trench T-6 across one of the faults that crosses the marginal fault zone. The location of trench T-6 is shown in Figures 2 and 9A.
Amit et al (2002)
 Figure 5
Log of the southern wall of trench T-17, 100 m north of trench T-6 across the same fault line. The location of trench T-17 is shown in Figures 2 and 9A.
Amit et al (2002)
 Figure 8
Log of the southern wall of trench T-18, showing a graben structure located in the central fault zone. Boxes show detail of areas adjacent to faults. The location of trench T-18 is shown in Figures 2 and 9A.
Amit et al (2002)

 Figure 9b
Log of the southern wall of trench T-19, located in an active stream bed at the northern tip of the graben.
Amit et al (2002)
 Figure 10
Log of the southern wall of trench T-20, across a fault scarp in the Avrona playa. The location of trench T-20 is shown in Figure 2.
Amit et al (2002)
 Figure 8
The fault plane exposed in trench T-20. Notice the displaced gypsic crust and fluvial gravel-rich unit. See [Trench Log] where the upper contact of unit 3 and unit 2 is attached to the fault plane.
Amit et al (1999)
 Figure 9
Fluvial unit (unit 5 in [Trench T-20]) on the down-faulted block; note the scour-and-fill sedimentary structure.
Amit et al (1999)
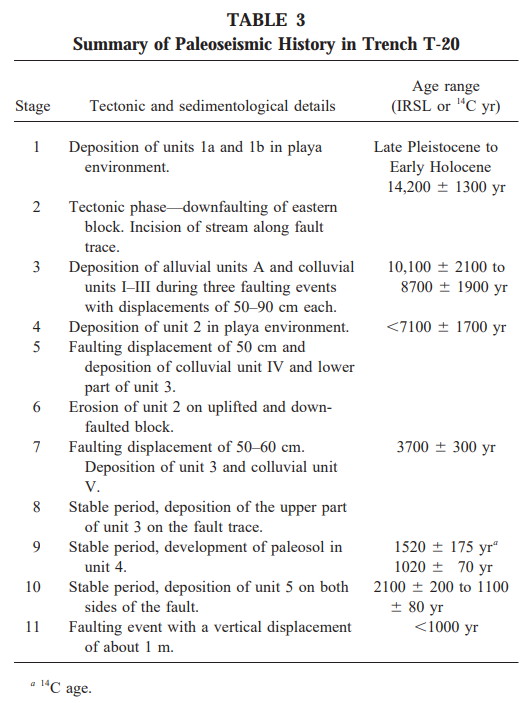 Table 3
Summary of Paeloeseismic History in Trench T-20
Amit et al (1999)
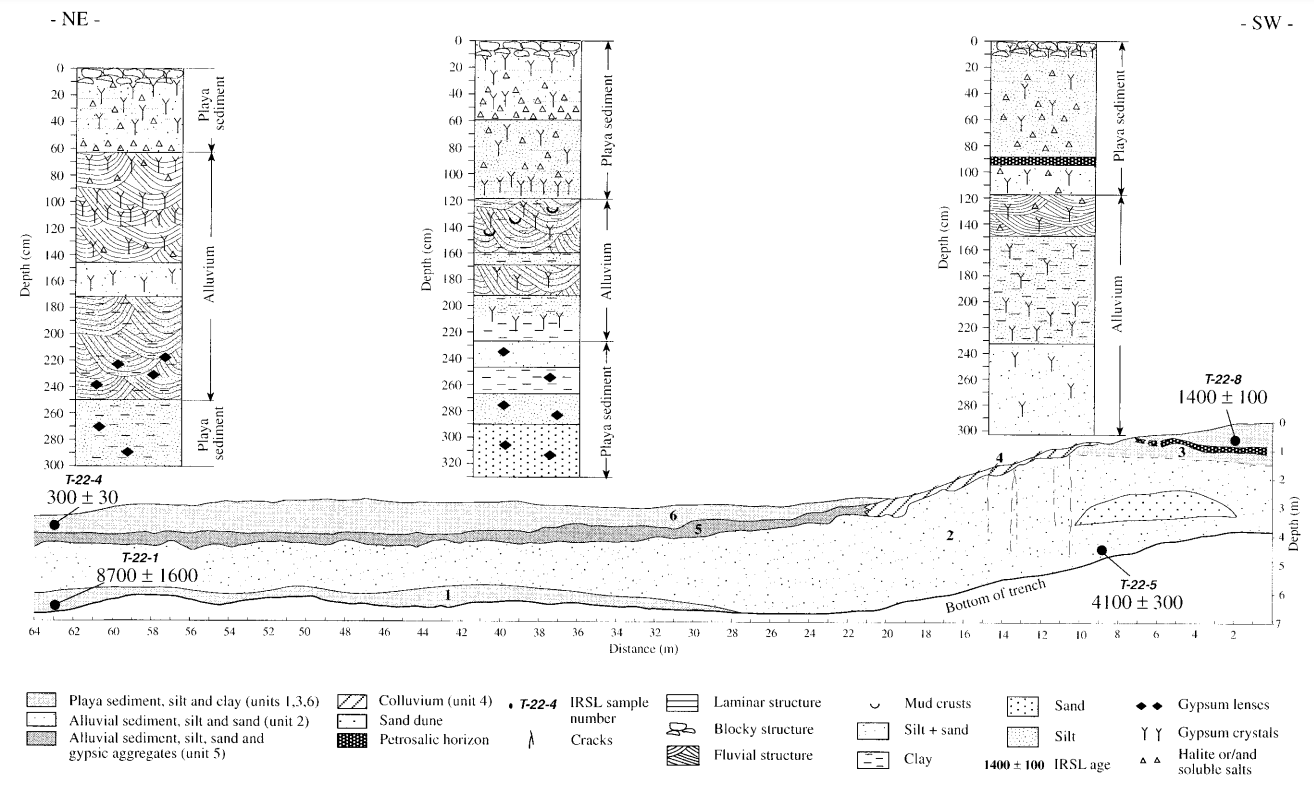 Figure 5
Log of the eastern trench wall of trench T-22 across a topographically elevated sterile playa deposit (part of the eastern ridge) showing the stratigraphy, sedimentology, and pedology of the previous central part of the Avrona Playa.
Amit et al (1999)
 Table 2
Elat Fault Zone Data
Amit et al (2002)
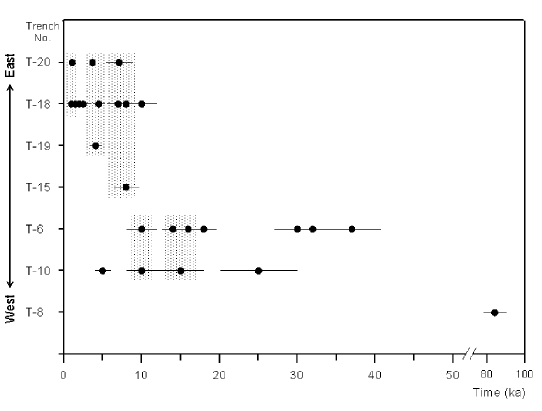 Figure 6
Earthquake distribution in time and space across the Elat fault zone. The y-axis shows the trenches studied; they are plotted top to bottom from east to west. The black dots mark identified and dated events detected along the main fault plane exposed in each trench. The x-axis shows the time of the tectonic event. An error bar indicating the dating uncertainties is attached to each dot. The shaded rectangles indicate possibly correlative earthquakes; these are interpreted to have occurred simultaneously on different branches of the Elat fault zone (except for trenches T-6 and T-17, which are located on the same fault line 100 m apart from each other).
Amit et al (2002)
 Figure 7
Variation with time of the displacement along the Elat fault zone. The black bars attached to each symbol mark the error in the determination of the age of the seismic event.
Amit et al (2002)
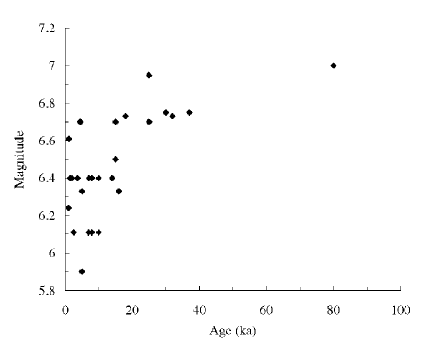 Figure 11
Temporal distribution of earthquake magnitudes on the Elat fault zone. Two clusters of earthquake magnitudes were detected. One cluster represents the past 20 k.y., during which the maximum magnitude was M 6.7. A second cluster represents a time range from 80 to 20 ka during which the maximum magnitude was M 7.1.
Amit et al (2002)
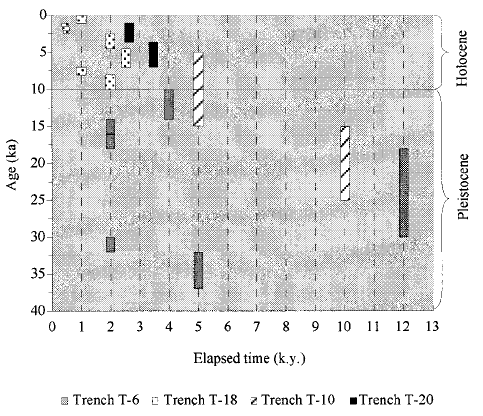 Figure 12
Time elapsed between tectonic events over the past 40 k.y. across the Elat fault zone. The length of each bar reflects the length of time between two successive events.
Amit et al (2002)
 Figure 13
Time and space diagram of earthquakes with magnitudes larger than M 6.5. The location of the large events migrates with time over the fault zone. Each trench represents a separate fault branch. The black lines reflect the time of each tectonic event, and the box length reflects the time error.
Amit et al (2002)
 Figure 6
Composite topographic profiles of the Wadi Avrona stream-channel and the elevated sub-ridges across the playa area. Notice the nick-point at I, where the stream crosses the fault that displaces the alluvial fan, and the convex profile of the stream channel between points II and III, where the stream crosses the elevated ridge. Numbers refer to segments of the photogrametric profiles. The soil and sedimentary profiles represent the upper 1.5 m of the elevated playa deposits, showing similarity throughout the tectonically deformed area.Notice the petrosalic horizon, which serves as a chrono-stratigraphic marker for correlating the elevated playa surface.
Zilberman et al (2005)
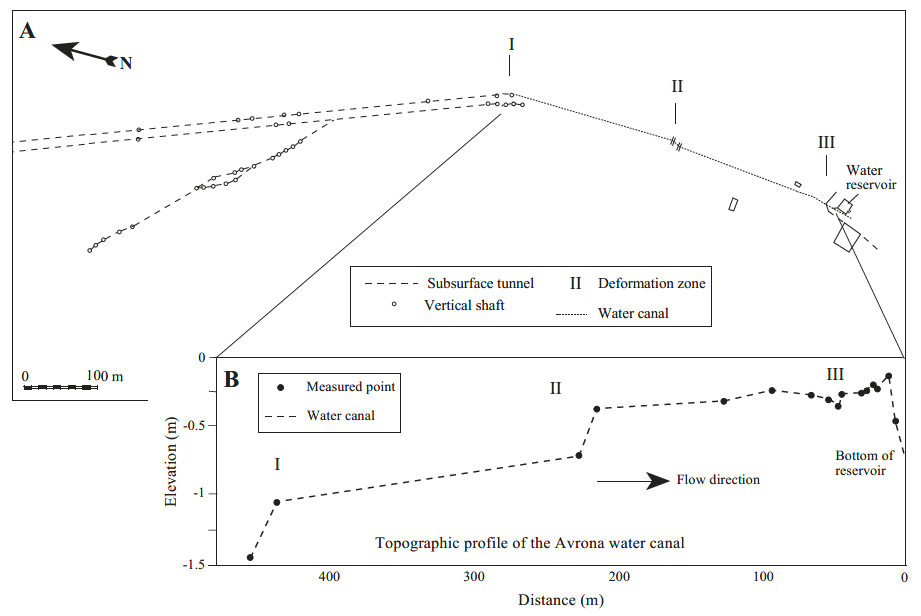 Figure 7
Topographic profile of the water canal in the Avrona Islamic farm. The profiles were measured by EDM total station.
Zilberman et al (2005)