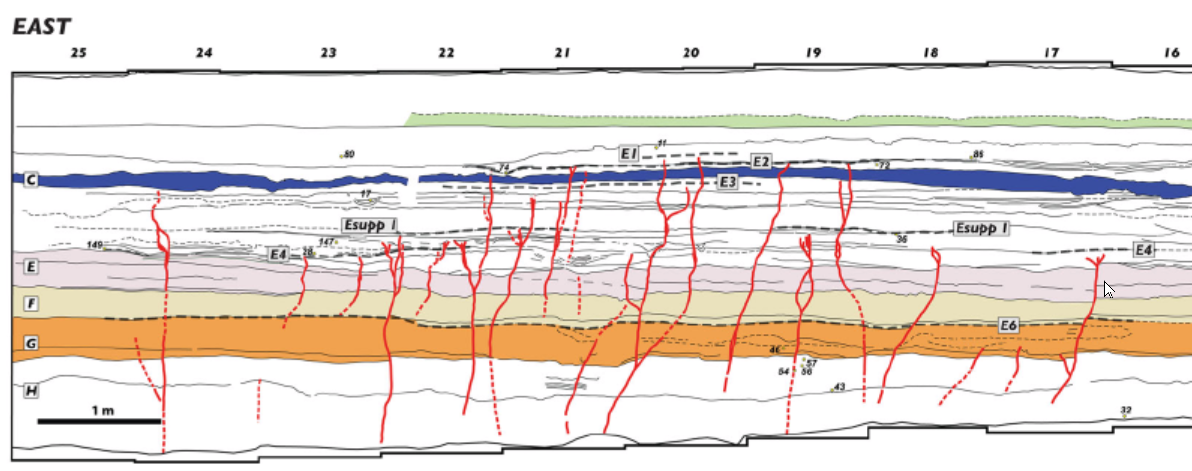
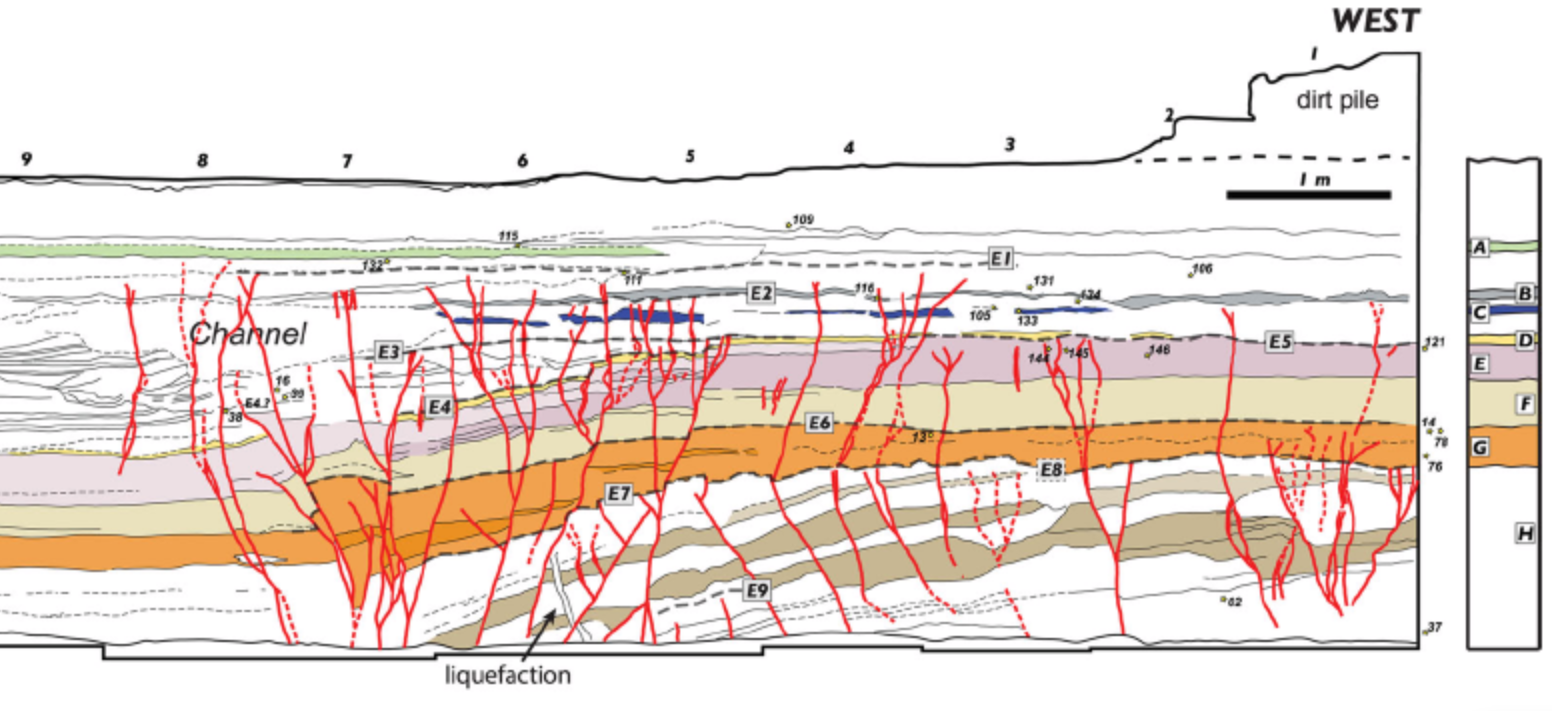
Event Esupp1

In the Qatar Trench, oriented perpendicular to the
Arava Fault
within the Yotvata Playa and just south of the
Yotvata extensional step,
Klinger et al. (2015)
identify Event Esupp1 primarily in the eastern fault zone as a series of faint,
mostly vertical cracks observed between
MM18
and
MM23,
with possible additional expression in subtle
fractures near
MM6
and
MM8
in the western fault zone. Esupp1 lacks a clear, laterally continuous event
horizon and cannot be traced confidently across the trench.
The deformation attributed to this event is restricted to
narrow cracking with little to no measurable vertical offset.
Many of these cracks are not
rooted in deeper fault structures and do not
display the systematic geometry observed for
larger events. Their faint expression and lack
of consistent stratigraphic termination suggest
that they may represent either secondary cracking
triggered by shaking from a distant earthquake or
a local, smaller-magnitude rupture that did not
produce significant surface displacement.
Stratigraphically, Esupp1 is situated between
events E4 and E3, but its precise position is
difficult to define due to the discontinuous
nature of the deposits in this part of the trench.
The upper units in this interval are characterized
by channeling, interfingering layers, and lateral
variability, which obscure the relationships
between cracks and sedimentary boundaries. As a
result, the assignment of these fractures to a
distinct seismic event remains tentative. The
lack of a well-defined event horizon and the
absence of clear offsets limit the confidence in
correlating these features across the trench.
Chronologically,
Klinger et al. (2015)
place Esupp1 between 806 CE and 1044 CE based on a
Bayesian model
of
radiocarbon dates
derived from
detrital charcoal.
Esupp1 is perhaps best
interpreted as a minor or distal seismic signal,
recording shaking or limited faulting rather than a
major surface-rupturing earthquake at the site.