Qatar Trench
 Figure 2
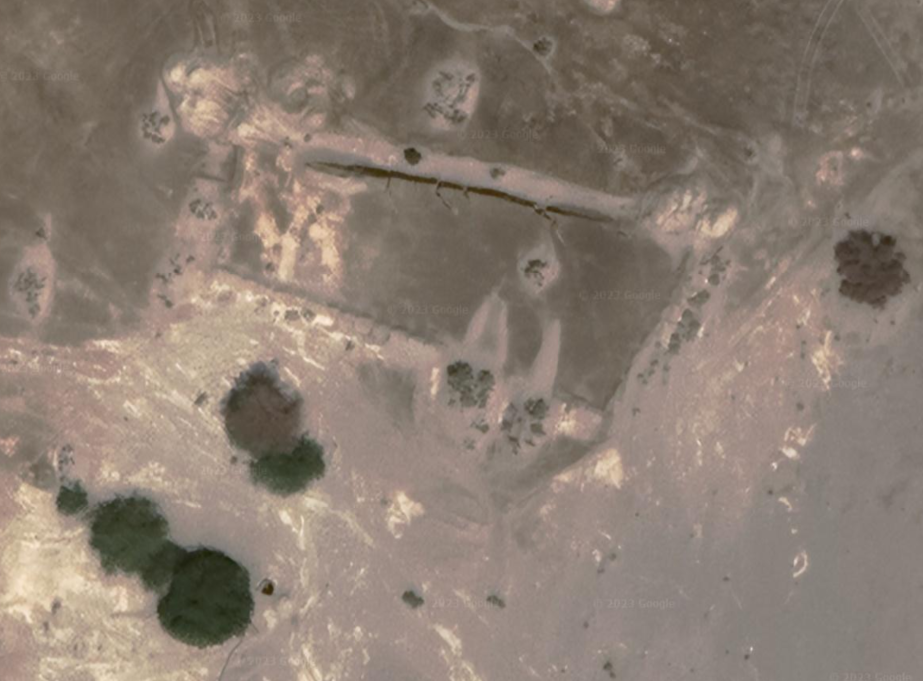
Satellite image of the Qatar trench site (29°48′46.4″N, 35°04′26.3″E) at the Yotvata extensional jog. The push-ups are well visible at the southern tip of the relay zone, deforming the toe of alluvial fans. North of the trench, the fault can be located only from the pressure ridges (Fig. 3) that mark the flat playa deposits, and the offset shoreline. To the southwest the depression is limited by normal faults with minor vertical throw.
Background image is submetric pixel size imagery from Digital globe (Google Earth extract).
Click on Image to open a high resolution magnifiable version in a new tab
Klinger et al (2015)
- Fig. 1 Location Map from
Klinger et al. (2015)
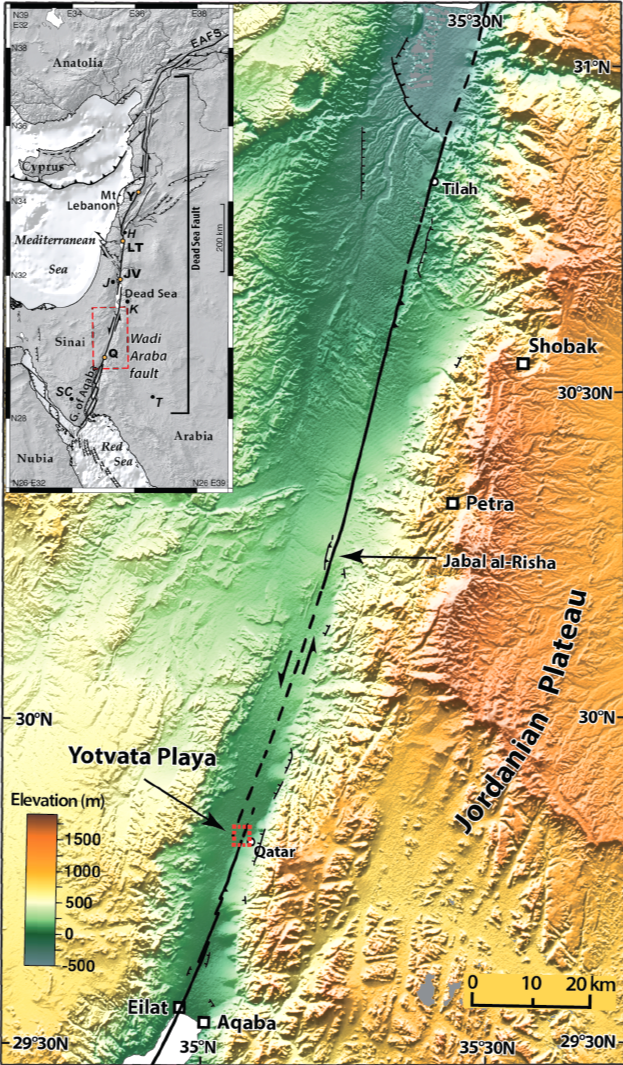 Figure 1
nset map shows the entire Dead Sea fault, including major relay zones of the Dead Sea basin and the Lebanese bend. Y, LT, JV and Q indicate paleoseismological sites of Yammouneh, Lake Tiberias, Jordan Valley and Qatar, respectively. T, K, J, H and SC indicate cities of Tabuk, Al-Karak, Jerusalem, Hula basin and St Catherine monastery, respectively. EAFS stands for East Anatolia Fault System. The main figure shows the Wadi Araba fault segments after (Le Béon et al.2012), with location of the trench site in Yotvata Playa. The site of Tilah is also indicated. Dashed red box indicates Fig. 2.
Topography from SRTM3 (pixel size, ~90 m)
clcik on image to open in a new tab Klinger et al. (2015) - Fig. 2 Location Map (closeup)
from Klinger et al. (2015)
 Figure 2
Satellite image of the Qatar trench site (29°48′46.4″N, 35°04′26.3″E) at the Yotvata extensional jog. The push-ups are well visible at the southern tip of the relay zone, deforming the toe of alluvial fans. North of the trench, the fault can be located only from the pressure ridges (Fig. 3) that mark the flat playa deposits, and the offset shoreline. To the southwest the depression is limited by normal faults with minor vertical throw.
Background image is submetric pixel size imagery from Digital globe (Google Earth extract).
Click on Image to open in a new tab
Klinger et al. (2015) - Fig. 2 Earthquake Extent Map
from Klinger et al. (2015)
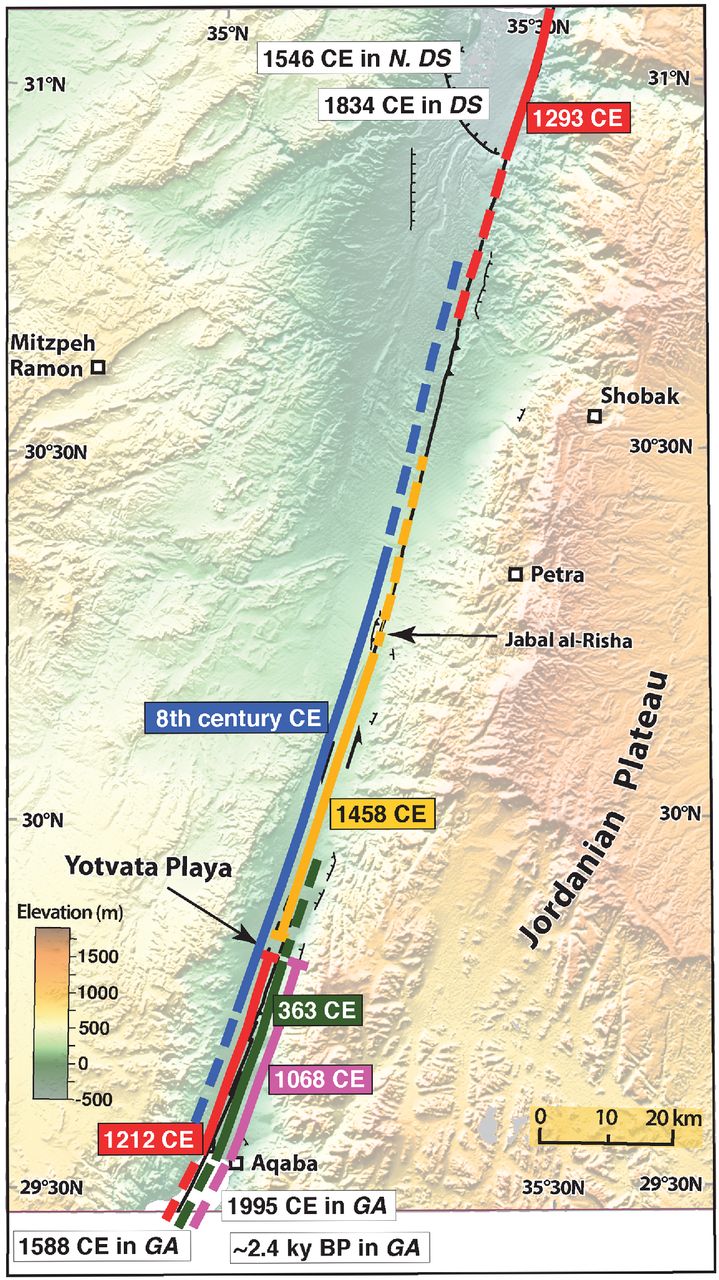 Figure 7
Lateral extent of historical earthquakes in the Wadi Araba based on events identified in the trench and on historical accounts. The Yotvata extensional jog appears to act like a stopping/initiation point for many ruptures, although larger earthquakes seem to be able to break through. Further studies are needed to detail seismic history of the Wadi Araba during the 8th century regional seismic crises and earlier in time. GA and N. DS stand for Gulf of Aqaba and Northern Dead Sea, respectively.
Click on Image to open in a new tab
Klinger et al. (2015) - Location of the Qatar Trench in Google Earth
 Location of the Qatar Trench
click on image to explore this site on a new tab in Google Earth
- Fig. 1 Location Map from
Klinger et al. (2015)
Figure 1
nset map shows the entire Dead Sea fault, including major relay zones of the Dead Sea basin and the Lebanese bend. Y, LT, JV and Q indicate paleoseismological sites of Yammouneh, Lake Tiberias, Jordan Valley and Qatar, respectively. T, K, J, H and SC indicate cities of Tabuk, Al-Karak, Jerusalem, Hula basin and St Catherine monastery, respectively. EAFS stands for East Anatolia Fault System. The main figure shows the Wadi Araba fault segments after (Le Béon et al.2012), with location of the trench site in Yotvata Playa. The site of Tilah is also indicated. Dashed red box indicates Fig. 2.
Topography from SRTM3 (pixel size, ~90 m)
clcik on image to open in a new tab Klinger et al. (2015) - Fig. 2 Location Map (closeup)
from Klinger et al. (2015)
Figure 2
Satellite image of the Qatar trench site (29°48′46.4″N, 35°04′26.3″E) at the Yotvata extensional jog. The push-ups are well visible at the southern tip of the relay zone, deforming the toe of alluvial fans. North of the trench, the fault can be located only from the pressure ridges (Fig. 3) that mark the flat playa deposits, and the offset shoreline. To the southwest the depression is limited by normal faults with minor vertical throw.
Background image is submetric pixel size imagery from Digital globe (Google Earth extract).
Click on Image to open in a new tab
Klinger et al. (2015) - Fig. 2 Earthquake Extent Map
from Klinger et al. (2015)
Figure 7
Lateral extent of historical earthquakes in the Wadi Araba based on events identified in the trench and on historical accounts. The Yotvata extensional jog appears to act like a stopping/initiation point for many ruptures, although larger earthquakes seem to be able to break through. Further studies are needed to detail seismic history of the Wadi Araba during the 8th century regional seismic crises and earlier in time. GA and N. DS stand for Gulf of Aqaba and Northern Dead Sea, respectively.
Click on Image to open in a new tab
Klinger et al. (2015)
Figure 2
Satellite image of the Qatar trench site (29°48′46.4″N, 35°04′26.3″E) at the Yotvata extensional jog. The push-ups are well visible at the southern tip of the relay zone, deforming the toe of alluvial fans. North of the trench, the fault can be located only from the pressure ridges (Fig. 3) that mark the flat playa deposits, and the offset shoreline. To the southwest the depression is limited by normal faults with minor vertical throw.
Background image is submetric pixel size imagery from Digital globe (Google Earth extract).
Click on Image to open in a new tab
Klinger et al (2015)
Location of the Qatar Trenchclick on image to explore this site on a new tab in Google Earth
 Figure 5
Trench log of the southern wall. The full resolution photomosaic of the wall is available in Fig. S1. The different stratigraphic units are indicated by letters A to H located in the synthetic stratigraphic section. Conservative position of event horizons are indicated with a dashed line, including for event Esuppl unambiguously visible in the eastern fault zone only. E8 is indicated for reference, although the dashed line corresponds to E7 event horizon (see discussion in text). Esupp2, between E8 and E9 is not indicated. Meter Marks (MM) are indicated above the trench. Dated 14C samples are indicated by star. To the west, a few samples have been collected up to 2 m outside the gridded wall, where the layers could be traced horizontally. Samples are indicated at the corresponding depth and stratigraphic position.
Click on Image to open in a new tab
Klinger et al (2015)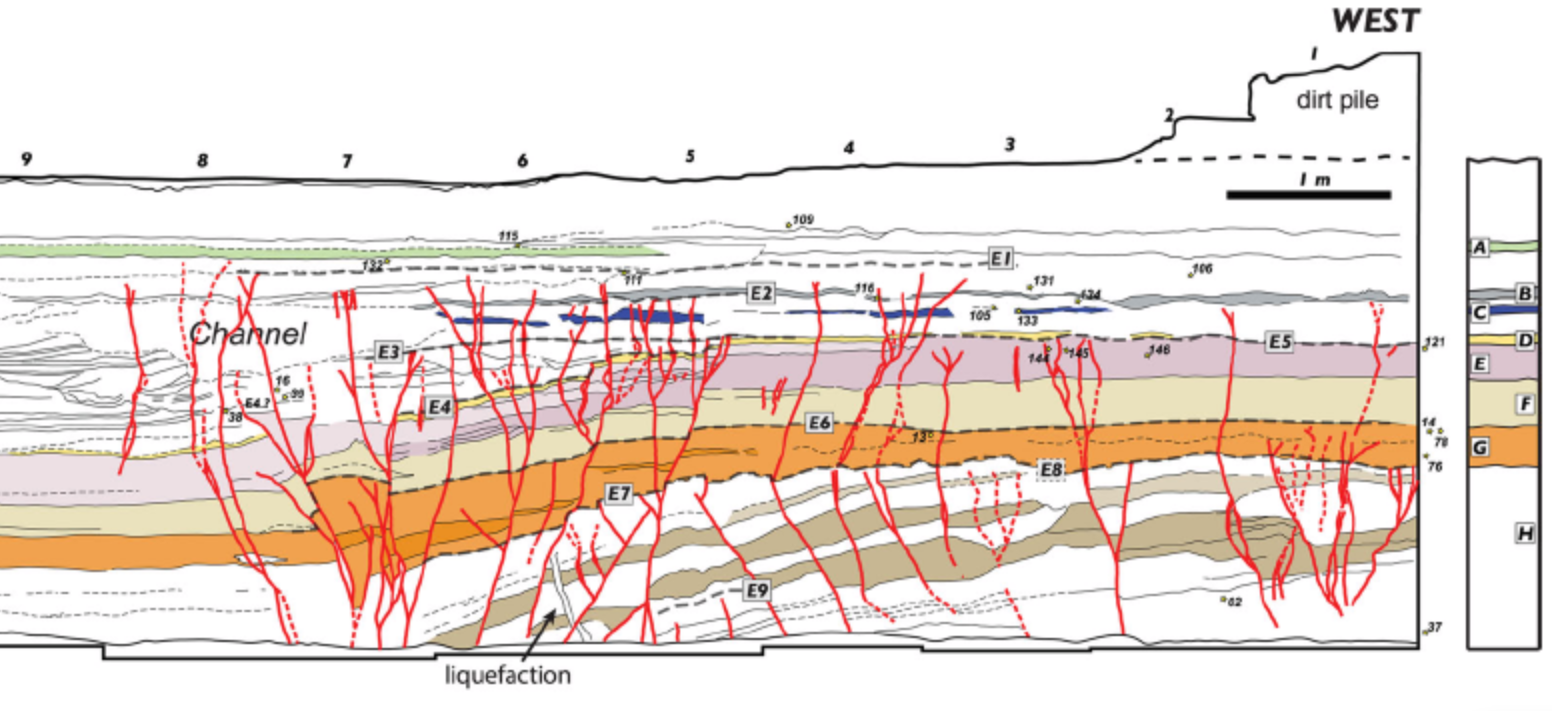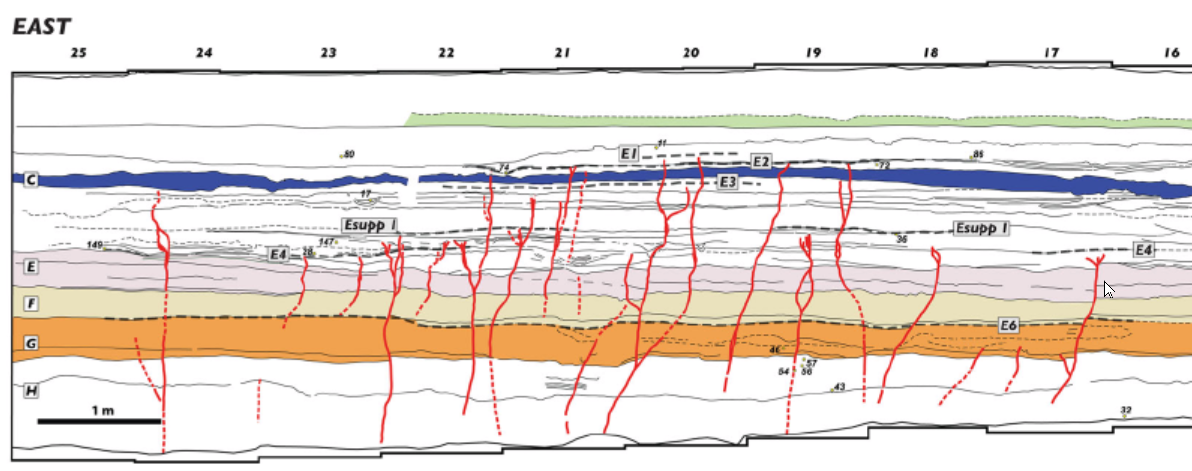
 Figure 8
Some of the earthquakes identified at our trench site have produced major deformation, while others are only responsible for small vertical offsets and cracks. The latter are assumed to stop or start within the Yotvata jog, whereas the larger events are interpreted to rupture through it. The trench suggests that the fault alternates between periods of more numerous smaller events and periods of larger, less frequent events. Potentially two such cycles may be observed in this trench. Uv strands indicate vertical deformation. Chronological indicators are located at the corresponding stratigraphic levels.
Click on image to open in a new tab
Klinger et al (2015)
 Figure S1
Photomosaic of the trench wall. Each square is 1 m per side.
Click on image to open in a new tab
Klinger et al (2015)
 Figure 4a
Overview of the south wall of the trench. Numerous distinct layers of sand and silt are visible. The thinning of the whitish silt westwards corresponds to the main deformation zone with significant downdrop of the eastern compartment. White squares are 1 m aside for scale.
Click on image to open in a new tab
Klinger et al (2015)
 Figure 4b
Zoom on the stratigraphy at meter mark MM5 (Fig. 5). Faults are visible that offset the yellowish silt and grey sand layers in the upper part of the photograph. Rotated blocks are also visible in the lower part.
Click on image to open in a new tab
Klinger et al (2015)
 Figure 6
Age model computed for the trench stratigraphy using OxCal v4.2 (Bronk-Ramsey et al. 2010) and IntCal13 calibration curve (Reimer et al. 2013). Light grey indicates raw calibration and dark grey indicates modelled ages including stratigraphic information. Phases indicate subsets of samples where no stratigraphic order is imposed.
Click on image to open in a new tab
Klinger et al (2015)
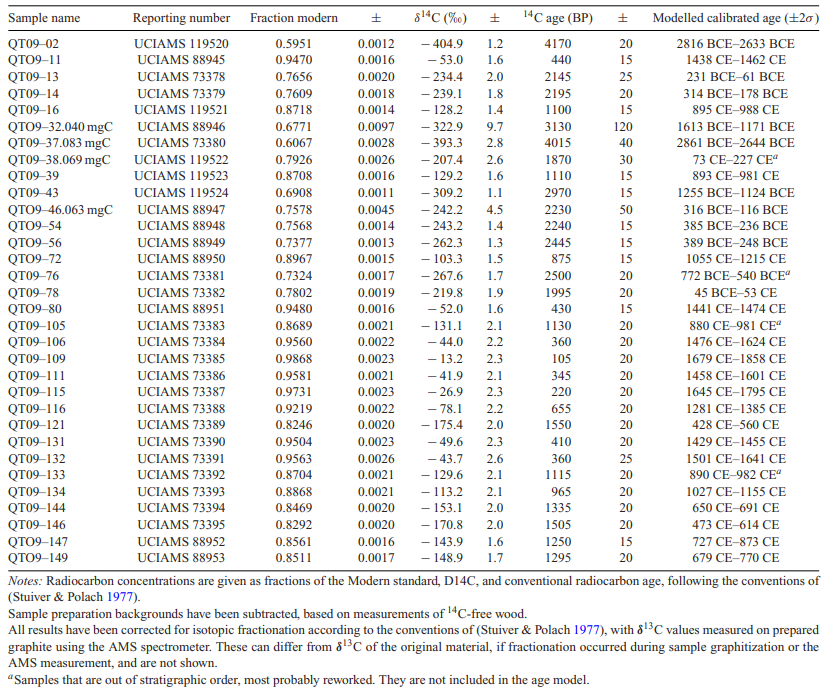 Table 1
Mass Spectroscopy measurements were made at the Keck carbon cycle mass spectroscopy facility at University of California, Irvine. Ages were calibrated using OxCal 4.2 (Bronk-Ramsey 2009) and calibration curve INTCAL13 (Reimer et al. 2013). Calibrated ages are indicated in Common Era (CE) or Before Common Era (BCE).
Click on image to open in a new tab
Klinger et al (2015)
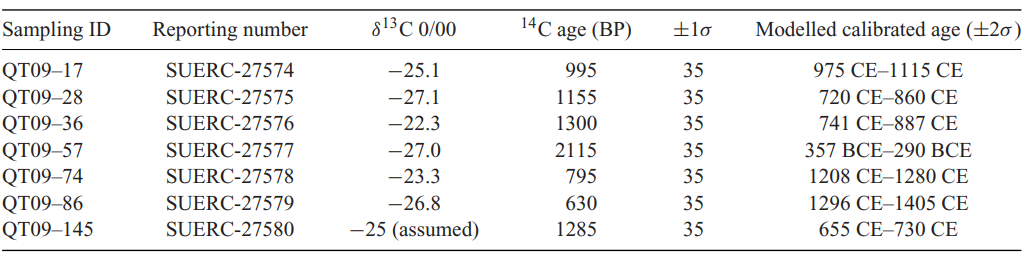 Table 2
Mass Spectroscopy measurements were made at the Scottish Universities Environmental Research Centre AMS Facility, Glasgow. Ages were calibrated using OxCal 4.2 (Bronk-Ramsey 2009) and calibration curve INTCAL13 (Reimer et al. 2013). Calibrated ages are indicated in Common Era (CE) and Before Common Era (BCE).
Click on image to open in a new tab
Klinger et al (2015)