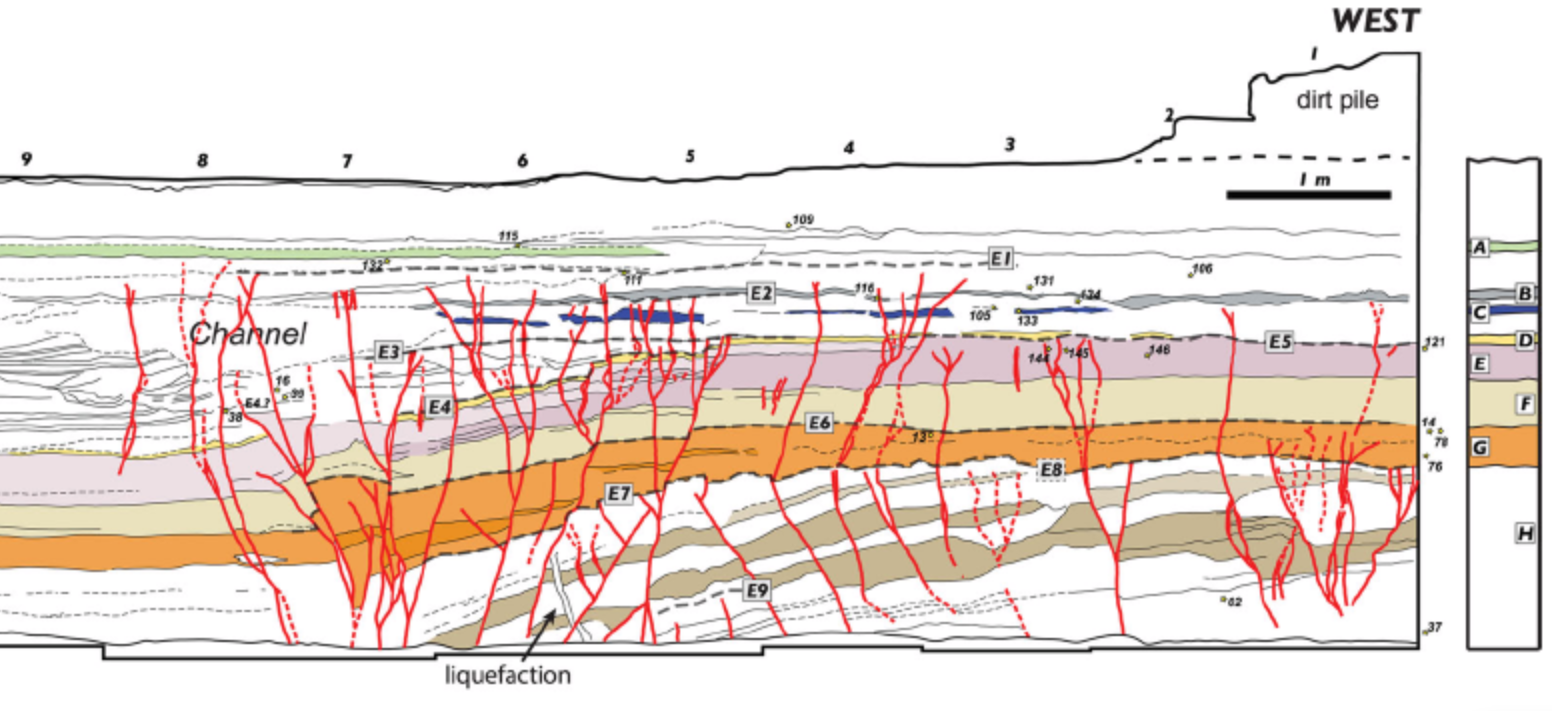
Event E3

In the Qatar Trench, oriented perpendicular to the
Arava Fault
within the Yotvata Playa and just south of the
Yotvata extensional step,
Klinger et al. (2015)
identify Event E3 as a well-defined rupture in the
upper part of the trench sequence, younger than E4 and Esupp1
and older than E2. Evidence is expressed primarily
within the sedimentary fill in the western fault zone that accumulated after
E4, where a set of cracks affects cross-bedded layers
onlapping unit D between
MM6
and
MM7,
as well as additional cracks that terminate just
below a major channel visible between
MM7
and
MM9.
Further west, at
MM5,
cracks offset unit D and can be traced upward a few
centimetres to end at a level consistent with the
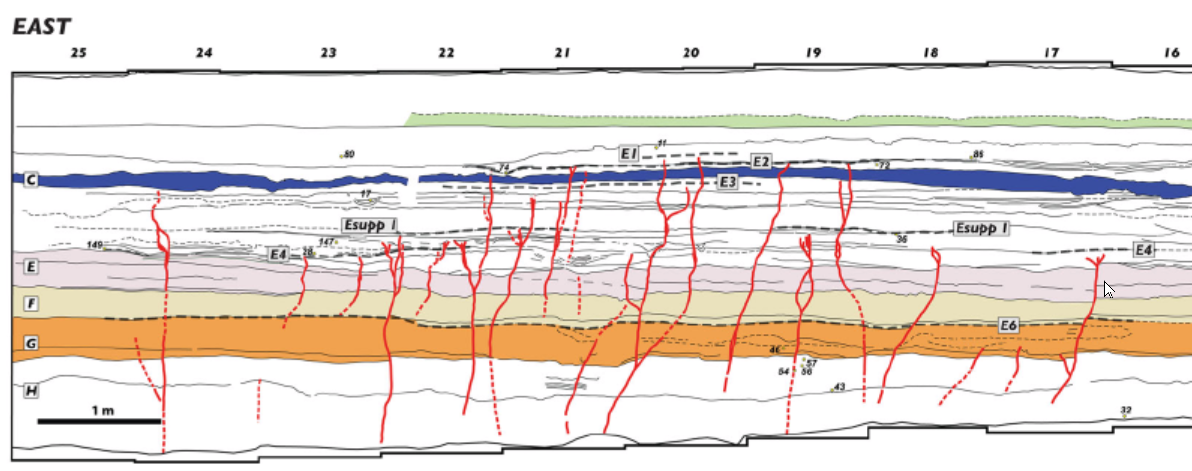
terminations observed farther east. In the eastern part of
the trench, between
MM18
and MM23,
numerous cracks occur at a similar level, although
their association with E3 is less certain and some of
these may instead belong to a poorly constrained
intervening event (Esupp1). The stratigraphic context of E3 is complicated by the
heterogeneous nature of the post-E4 deposits. The
sedimentary fill consists of discontinuous, channel-
dominated layers with limited lateral continuity,
which makes correlation across the trench difficult.
Nevertheless, the clustering of crack terminations at
a consistent level provides a reliable basis for
defining the E3 event horizon.
The rupture associated with E3 is characterized by
numerous cracks without large vertical offsets rather than large-scale tilting or
major
subsidence.
According to
Klinger et al. (2015), this
indicates that it is likely that E3 was created by a
fault rupture that terminated at the Yotvata extensional step.
Some of the cracks
appear to reuse earlier fracture paths, indicating
that pre-existing weaknesses in the sedimentary pile
continued to influence rupture propagation.
Chronologically, E3 is well constrained relative to
many other events in the sequence.
Klinger et al. (2015)
place E3 between 1003 CE and 1138 CE based on a
Bayesian model
of
radiocarbon dates
derived from
detrital charcoal.
Within this interval, they correlate E3 with the
1068 CE seismic crisis, specifically favoring the
18 March 1068 earthquake, which is thought to have
ruptured the southern Wadi Araba. Historical reports
describe extensive destruction at
Ayla, strong
shaking across a broad region, and effects extending
into Egypt and Arabia.