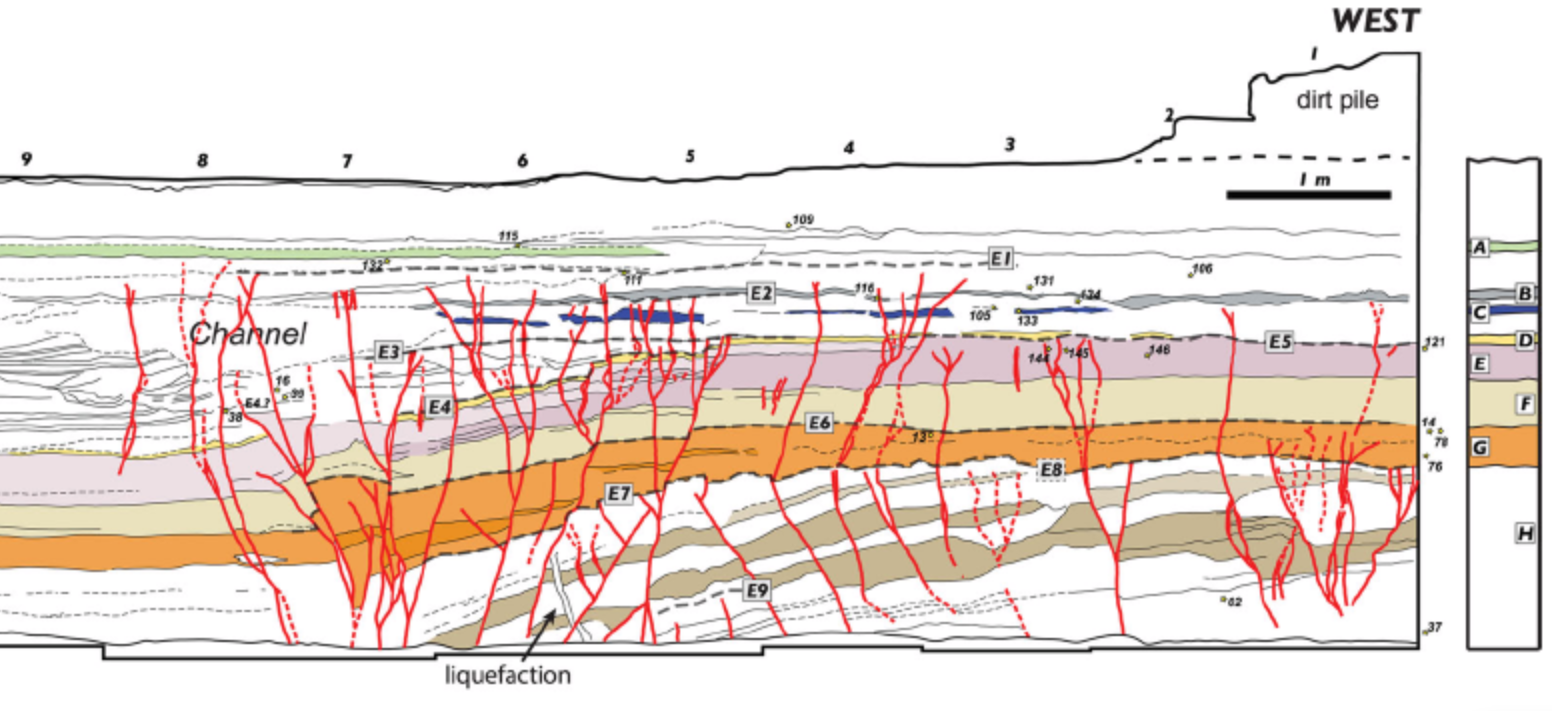
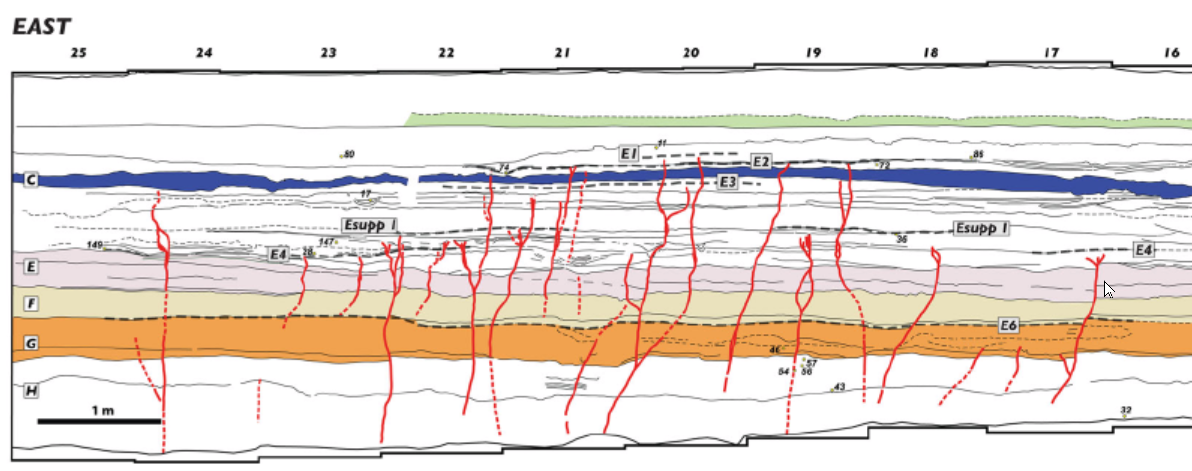
Event E2

In the Qatar Trench, oriented perpendicular to the
Arava Fault
within the Yotvata Playa and just south of the
Yotvata extensional step,
Klinger et al. (2015)
identify Event E2 as a widespread but relatively
low-displacement rupture affecting both the western and eastern fault zones. Evidence is expressed as
a distinct group of numerous cracks that cut through
unit C but are consistently capped by unit B,
defining a clear event horizon at the base of unit B.
These cracks are observed across the trench, indicating that the rupture
affected a broader portion of the deformation field
than several earlier events.
The deformation associated with E2 is characterized
primarily by brittle fracturing rather than large
vertical displacement. The cracks branch from and
reuse pre-existing fractures formed during earlier
events, especially in the western fault zone, producing
a complex network of intersecting rupture traces.
Despite their abundance, these fractures show little
associated vertical offset, suggesting that the
earthquake either involved limited vertical motion
or that the trench site was
located near the initiation or termination of rupture, where slip is reduced..
Stratigraphically, E2 is tightly constrained by the
presence of unit B, a fine-grained, laminated layer
that provides an excellent marker horizon. Because
unit B is composed of thin, easily deformable
sediments, any rupture penetrating it would be
readily visible. The absence of cracks within unit B
and their consistent termination at its base confirm
that deposition of unit B postdates the earthquake.
This sharp stratigraphic relationship allows E2 to be
identified with high confidence despite the absence
of large offsets. The continuity of unit C beneath
the cracks further supports the interpretation that
E2 represents a single, discrete rupture event rather
than a series of smaller disturbances.
Chronologically, E2 is one of the best-constrained
events in the Qatar trench sequence.
Klinger et al. (2015)
place it between 1155 CE and 1269 CE based on a
Bayesian model
of
radiocarbon dates
derived from
detrital charcoal.
Klinger et al. (2015) correlated Event E2 with
the 1212 CE earthquake.