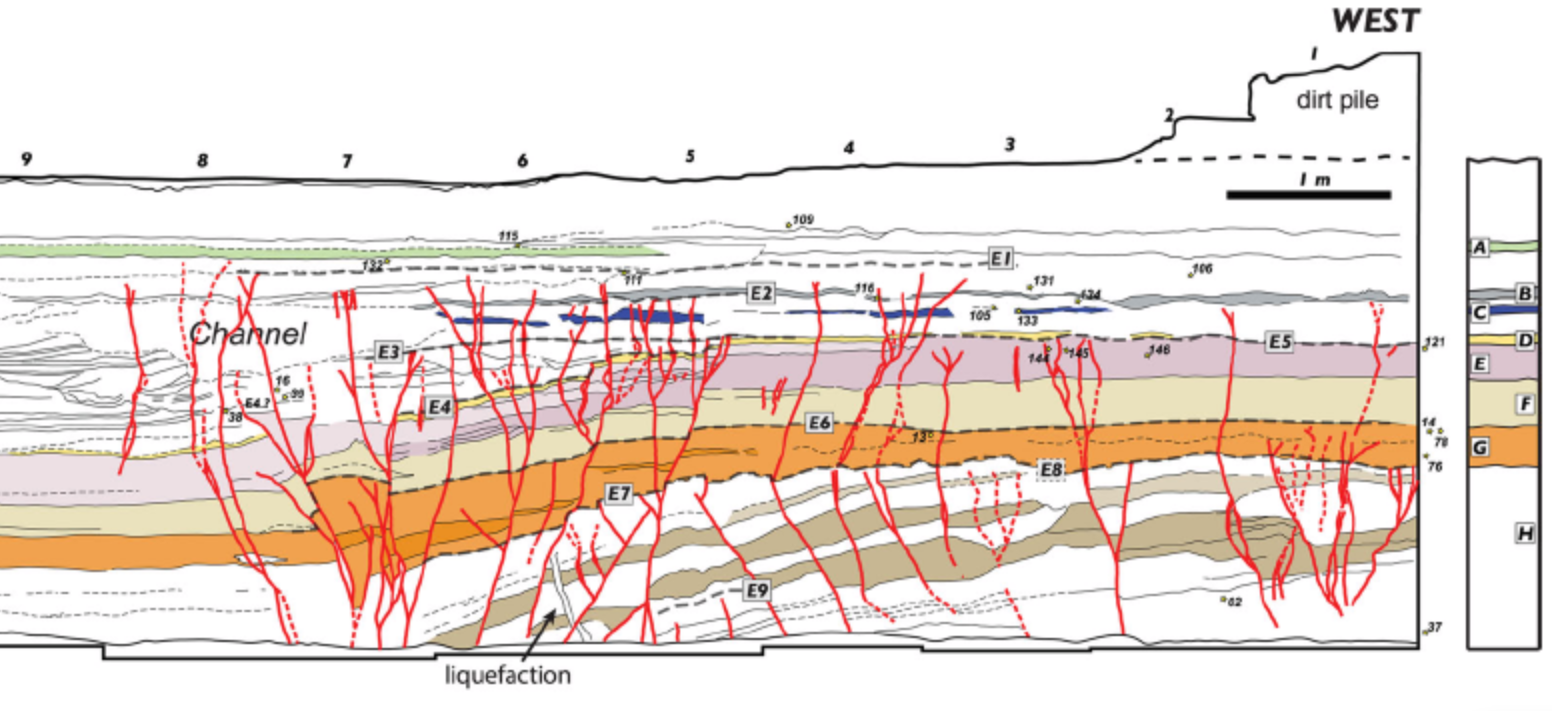
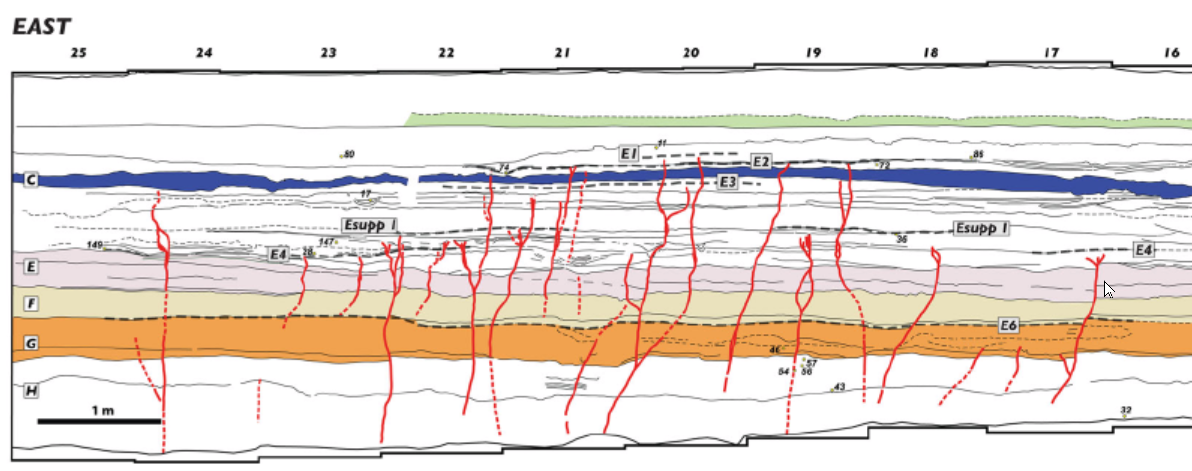
Event E1

In the Qatar Trench, oriented perpendicular to the
Arava Fault
within the Yotvata Playa and just south of the
Yotvata extensional step,
Klinger et al. (2015)
identify Event E1 as the most recent surface-rupturing
earthquake recorded in the trench sequence. Evidence
is expressed by a dense network of
fissures that cut
through unit B and extend upward toward the present
ground surface, defining a pseudo-event horizon near
the top of the stratigraphic section. These fissures
are especially abundant within the western fault zone
between
MM1
and
MM9,
but are also present, though less frequently, in the
eastern fault zone.
The deformation associated with E1 is dominated by
brittle fracturing rather than large vertical
displacement. In several locations, these
cracks exhibit minor vertical offsets, but the overall
magnitude of vertical deformation remains limited.
According to
Klinger et al. (2015), this
indicates that it is likely that E1 was created by a fault rupture that terminated at the
Yotvata extensional step.
Stratigraphically, E1 is constrained primarily by
its position relative to unit B. Because the fissures
clearly cut through unit B but do not extend into a
later continuous marker horizon, the exact event
surface cannot be tied to a single stratigraphic
contact. Instead, the clustering of fissure
terminations at approximately the same depth below the ground surface defines a
pseudo-event horizon. The uppermost part of the
section is characterized by channeling and
interfingering deposits with limited lateral
continuity, which obscures the precise relationship
between deformation and sedimentation. Nevertheless,
the consistent geometry of the fissures provides
strong evidence that they were produced during a
single earthquake event.
Chronologically, E1 is tightly constrained by
radiocarbon dating of surrounding units.
Klinger et al. (2015)
place the event between 1434 CE and 1459 CE based on a
Bayesian model
of
radiocarbon dates
derived from
detrital charcoal.
Klinger et al. (2015) associate
Event E1 with the
1458 CE earthquake.