Event H at Nahal Ze'elim site ZA-1 is a 30 cm thick liquefied sand layer. The seismite was found in the southern gully of Site ZA-1, some distance from where Events A-F were discovered. Like Event G, Event H occurs in the uppermost part of the ZA-1 section, where depositional conditions differ from those that produced the older mixed-layer seismites. Instead of occurring within laminated lacustrine muds, Event H is preserved as a liquefied sand layer deposited in a shoreline to nearshore setting. This change reflects a shift in sedimentary facies within the upper part of the Ze'elim Formation, where sandy shoreline deposits became more common than the laminated aragonite- detrital sediments that characterize much of the lower sequence.
Event H was identified in the southern gully of ZA-1. However, its stratigraphic position is defined relative to the northern gully section, where Events A–F were identified. In that reference section, Event G occurs ~730 cm above the base-level. Event H occurs above Event G and is separated from it by several centimeters of lacustrine sediment composed of laminated aragonite and detritus. According to Ken-Tor et al. (2001a), this intervening lacustrine unit probably records a period of rising lake level that may correspond to the relatively high stand of the Dead Sea during the late nineteenth century. Unlike the older mixed-layer seismites, Event H is expressed primarily as liquefaction within sandy shoreline deposits. The preservation of a distinct liquefaction event in Event H indicates that strong ground shaking affected water-saturated sediments near the shoreline during the most recent phase of deposition represented in the ZA-1 section.
The chronology of Event H is constrained by a series of radiocarbon determinations from the uppermost part of the section. Samples from the sequence yielded, in stratigraphic order from bottom to top, lab ages of 260 ± 24 BP (KIA-8259) from the bottom of the sequence, 135 ± 31 BP (KIA-8261) from inside seismite G, 93 ± 36 (KIA-l1651) from the topmost lacustrine unit, and 279 ± 20 BP (KIA-8260) from seismite H. Calibrated Ages for these samples are 1520-1800 CE, 1670-1960 CE, 1670-1960 CE, and 1520-1670 CE respectively. The calibrated age ranges overlap substantially and the top sample is older than the deeper samples, reflecting potential reworking and the difficulties of dating very young sediments using radiocarbon methods. However, the stratigraphic position of Event G above a lacustrine unit associated with a late nineteenth-century CE rise in Dead Sea level, identified by Ken-Tor et al. (2001b) through reference to Klein (1961), indicates that the event postdates that lake-level highstand. On the basis of this stratigraphic relationship, Ken-Tor et al. (2001a) and Ken-Tor et al. (2001b) correlated Event H with the 1927 CE Jericho earthquake.
- Fig. 1c Oblique aerial photo of
SW Dead Sea showing Masada and Zeelim Plain from Agnon et al. (2006)
An oblique air photo looking southward at the southwestern part of the Dead Sea showing faults (solid lines) and locations of studied late Pleistocene sections M and PZ. MFZ—Masada Fault Zone. The photo was taken in 1940 when the lake level was 395 m below sea level. The current level is 420 m below sea level; additional area has emerged, including the Ze' elim fan outcrop.
click on image to open in a new tab in Google Earth
Agnon et al. (2006)- Nahal Ze'elim outcrop areas
in Google Earth
ZA-I is a guesstimate
click on image to explore this site on a new tab in Google Earth- Figure 2 Annotated Lithosection
of ZA-1 with interpreted ages noted from Ken-Tor et al. (2001a)
The lithology and chronology of a composite section exposed in Ze'elim Plain. The section is described from two outcrops exposed in different gullies 300 m apart. The correlation between the outcrops is based on the sedimentary sequence, laminae counting, and 14C dates. Ages presented in 14C years B.P. Deformed units (mixed layers and liquefied sands) are marked by capital letters.
slightly modified by JW - red dates as interpreted by JW added
click on image to open in a new tab
Ken-Tor et al. (2001a)- Figure 8 Age Model for ZA-1
from Agnon et al. (2006)
A modified age model for the Ze'elim section studied in outcrop (Ken-Tor et al., 2001a) and drill core (Migowski et al., 2004). A–H denote events discussed in the text. The present model was constrained by two rules:
(1) each event horizon (top of each intraclast breccia) matches a historical earthquake of notice.
(2) each continuous deposition segment shows a uniform deposition rate.
Two outcomes support the model. Two of the breccia layers match pairs of earthquakes (64–31 BCE; 1202–1210 CE) such that the earlier event horizon is within the breccia layer and the later event matches the top. With these assignments for the event horizons, the model gives a uniform sedimentation rate of 0.5 cm/yr during the three periods separated by hiatuses.
click on image to open in a new tab
Agnon et al. (2006)- Figure 3 Age Model for ZA-1
from Ken-Tor et al. (2001a)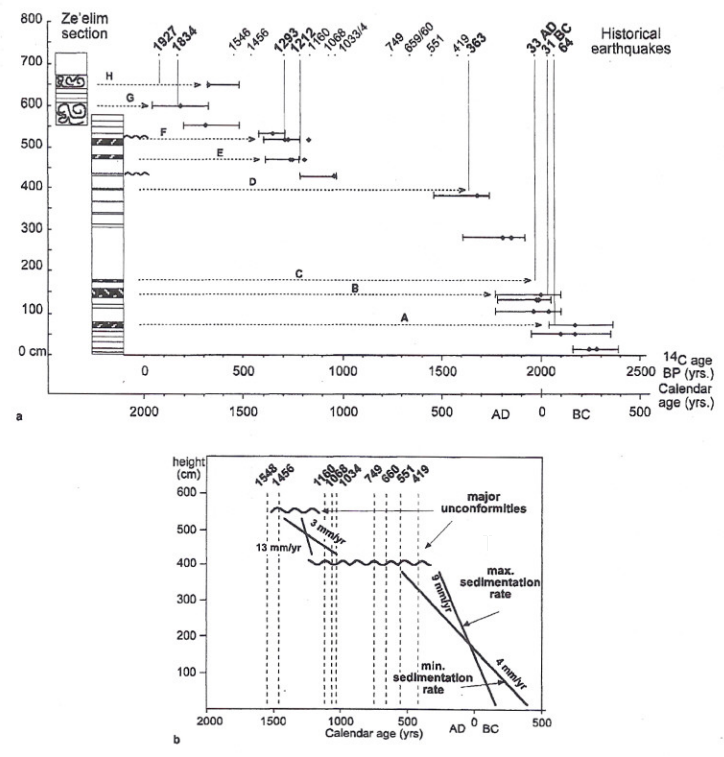
Table 1
- Chronology of the deformed units (seismites) in the Ze'elim section. Solid dots represent 14C ages in years B.P. Error bars represent the ranges in the calibrated ages (2σ) of all samples in each stratigraphic horizon. Vertical thin lines represent historical earthquakes in the Dead Sea area, which were correlated to the deformed units in the Ze'elim section. Horizontal dashed arrows are drawn from the deformed units (listed in capital letters) to the correlative earthquakes.
- Sedimentation rates calculated for the lower part of the composite section. The longest calibrated range was used for calculating the minimum sedimentation rate, and the shortest range for calculating the maximum sedimentation rate. Two clear unconformities are evident. The upper one is dated to 1290-1420 A.D., and the lower one to 1030-1210 A.D. The lower unconformity is marked by a sharp decrease in the sedimentation rate. Vertical dashed lines represent earthquakes that lie within the sedimentological hiatuses. Sedimentation rate of the upper part of the section was not calculated because datable samples were insufficient.
click on image to open in a new tab
Ken-Tor et al. (2001a)- Table 1 Radiocarbon Table
from Ken-Tor et al. (2001a)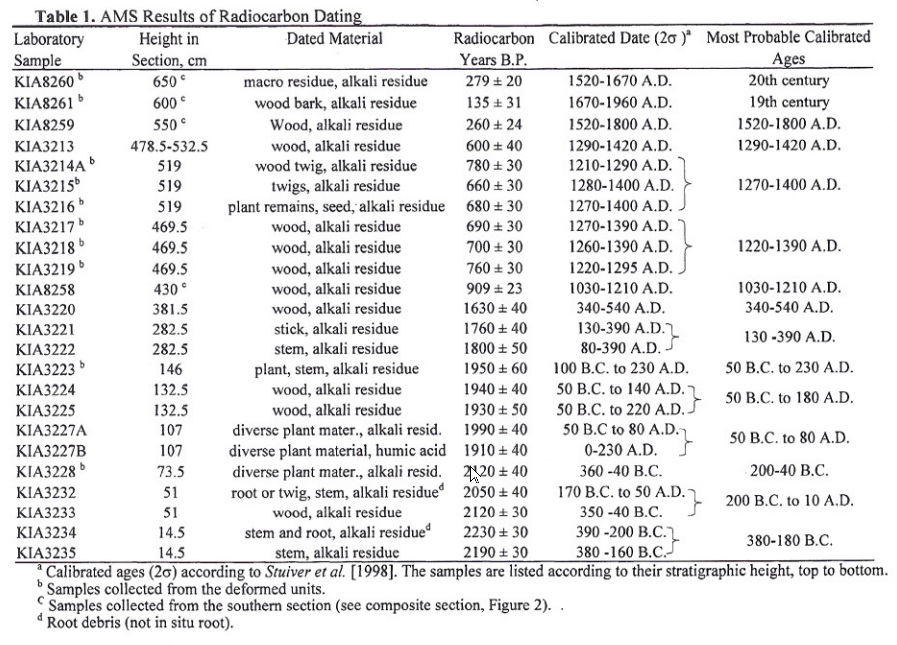
AMS Results of Radiocarbon Dating
click on image to open in a new tab
Ken-Tor et al. (2001a)- Table 2 Radiocarbon Table
from Ken-Tor et al. (2001a)
The 14C Chronology of the Deformed Layers (Seismites)
click on image to open in a new tab
Ken-Tor et al. (2001a)- Fig. 2 Sediment Core comparisons
and Age-Depth Models for Ein Gedi, En Feshka, and Nahal Zeelim from Migowski et al. (2004)
Lithology of the sediment cores and the established age-depth models of the different profiles. The Ze'elim coring profile is paralleled by the Ze'elim gully wall. The Ein Gedi chronology is based on 20 radiocarbon dates and on the varve-counted section (black line) in the upper part.
click on image to open in a new tab
Migowski et al. (2004)- Correlated Trench Logs used
to Produce Composite ZA-1 Litholog from Revital Bookman (née Ken-Tor)
The final lithosection of Bookman (née Ken-Tor) is a composite litholog derived from multiple sites located up to approximately 300 m apart. ZA-1 refers to the location from which a large portion of the composite lithosection was constructed. More landward gullies were used to capture the most recent earthquakes, including Events G (1834 CE) and H (1927 CE). Bookman referred to site ZA-1 as Site 2.
click on image to open in a new tab
Revital Bookman (née Ken-Tor)