Jarmaq Trench
 Fig. 6
- Photo mosaic of the southern wall of the excavation across the Roum fault showing the rupture strands (white lines) and associated stratigraphic units (labelled in yellow).
- Illustration of a. The 5 palaeoseismic events determined from the capping horizons are labelled V to Z in black boxes (see text for details and Fig. 7 for the palaeo-earthquake distribution). Black squares are the 6 measured and reliable unit radiocarbon ages.
click on image to open in a new tab
Nemer and Meghraoui (2006)
- Location of Jarmaq Trench
in Google Earth
 Location of Jarmaq Trench (in magenta)
click on image to explore this site on a new tab in Google Earth - Fig. 4 Location of Map from
Nemer and Meghraoui (2006)

Fig. 4
- Trace of Roum fault area (location on Fig. 1b) based on field and aerial photograph mapping. Note the river offsets (thick blue) that decrease north. Labelled circles indicate places, numbered circles indicate drainage offsets plotted in b, numbers in brackets indicate offset length in m ± 2 (cf. Table 1). X-X' is cross-section shown in c. Filled circle indicates the location of the kinematic measurements shown in d.
- Log-normal plot of offset drainage distribution along the Roum fault from south to north as shown in a. Note that the cumulative offsets recorded by the Litani (L), Zahrani (Z), and Awali (A) rivers decrease northward. Numbers indicate the offset labels given in Table 1.
- Cross-section drawn to scale along the flexing segment of Roum fault.
- Stereographic projection of fault planes and corresponding slickenlines measured along the Roum fault at N 33° 21'.71 - E 35° 31'.35 shown in a. The rake points out the strike-slip movement along this segment of the Roum fault.
Nemer and Meghraoui (2006)
- Fig. 4 Location of Map from
Nemer and Meghraoui (2006)
Fig. 4
- Trace of Roum fault area (location on Fig. 1b) based on field and aerial photograph mapping. Note the river offsets (thick blue) that decrease north. Labelled circles indicate places, numbered circles indicate drainage offsets plotted in b, numbers in brackets indicate offset length in m ± 2 (cf. Table 1). X-X' is cross-section shown in c. Filled circle indicates the location of the kinematic measurements shown in d.
- Log-normal plot of offset drainage distribution along the Roum fault from south to north as shown in a. Note that the cumulative offsets recorded by the Litani (L), Zahrani (Z), and Awali (A) rivers decrease northward. Numbers indicate the offset labels given in Table 1.
- Cross-section drawn to scale along the flexing segment of Roum fault.
- Stereographic projection of fault planes and corresponding slickenlines measured along the Roum fault at N 33° 21'.71 - E 35° 31'.35 shown in a. The rake points out the strike-slip movement along this segment of the Roum fault.
Nemer and Meghraoui (2006)
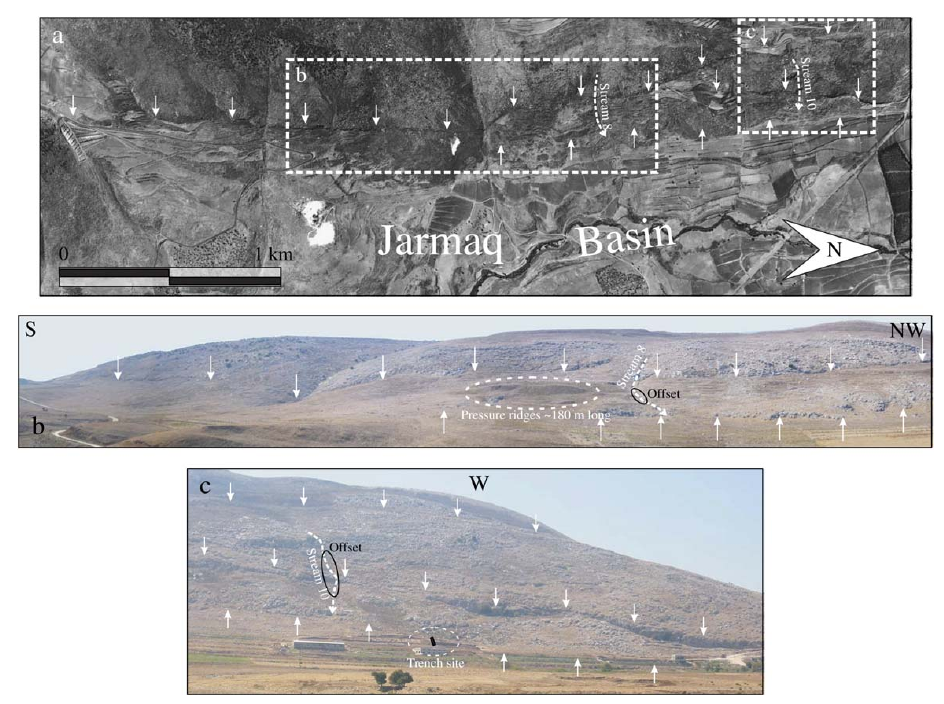 Fig. 5
- Aerial photograph showing the Roum fault to the west of Jarmaq basin (see location on Fig. 4). Fault trace(s) indicated with white arrows. Boxes indicate locations of b and c.
- Field photograph showing fresh composite fault scarps (2-2.5 m high) indicated with white arrows and offset stream (labelled 8 on Fig. 4 and in Table 1). Note also the pressure ridges between the two fault scarps.
- Field photograph showing trench location and offset stream 10 (Fig. 4 and in Table 1).Fault trace(s) are indicated with white arrows.
Nemer and Meghraoui (2006)
Fig. 6- Photo mosaic of the southern wall of the excavation across the Roum fault showing the rupture strands (white lines) and associated stratigraphic units (labelled in yellow).
- Illustration of a. The 5 palaeoseismic events determined from the capping horizons are labelled V to Z in black boxes (see text for details and Fig. 7 for the palaeo-earthquake distribution). Black squares are the 6 measured and reliable unit radiocarbon ages.
Nemer and Meghraoui (2006)
 Fig. 7
Probability distribution of 14C ages (Table 2) obtained from sequential radiocarbon dates automatically performed by the OxCal 3.10 Program (Bronk Ramsey, 1998). The calibrated dates (black) are presented with 1σ and 2σ age ranges (68.3% and 95.4% density, respectively). The age ranges of the seismic events (grey) are determined using the Bayesian distribution and related conditional probability imposed by the stratigraphic sequence, event horizons and 14C dating. Event V is, however, poorly constrained without the lower bound age.
Nemer and Meghraoui (2006)
 Table 3
Characteristics of the radiocarbon dating of the collected samples
Nemer and Meghraoui (2006)
 Fig. 8
Schematic reconstruction of the palaeoseismic events as observed in the trench (Fig. 6a). Steps 1 to 12 illustrate the relationships between the 5 faulting episodes and successive alluvial-colluvial deposits. The white caliche units ( g and e) mark the stratigraphic succession and point out the rupture locations. Event Z is covered by unit a, which corresponds to a thick colluvial unit visible on the western edge of the trench.
Nemer and Meghraoui (2006)