ICDP Cores
 Location of Core 5017-1
click on image to explore this site on a new tab in Google Earth
- Location Map from
Lu et al. (2020)
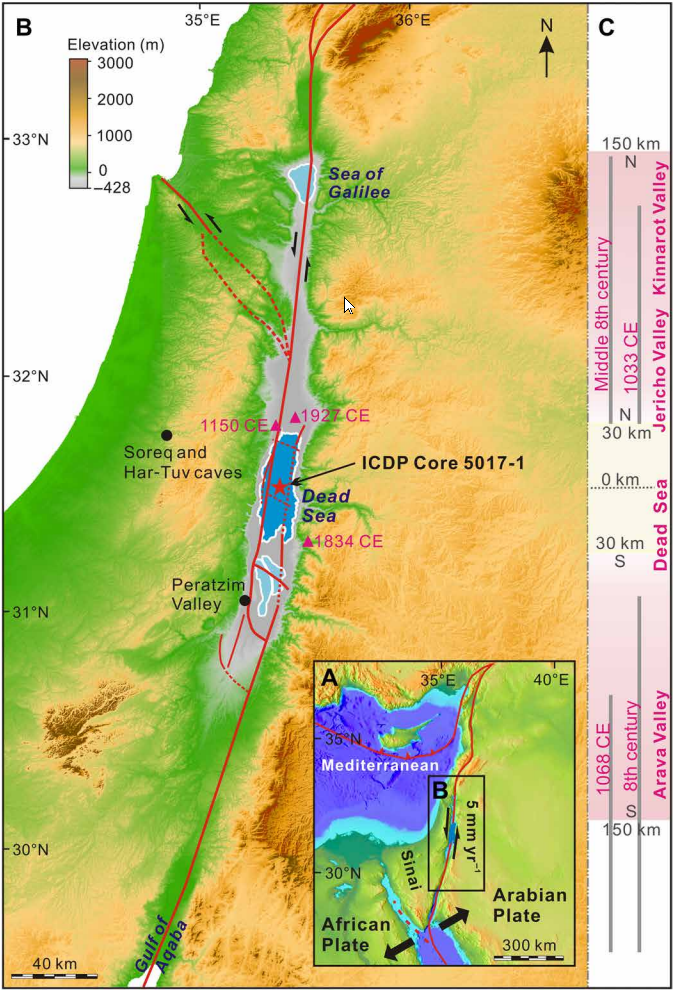 Figure 1
Tectonic setting of the Dead Sea Fault. (A) Dead Sea Fault is a sinistral boundary between the African and Arabian plates (43). (B) Major active faults (43, 44) along the plate boundary, Dead Sea Transform; in this area, the fault is composed of four fault segments. The red star marks the drilling site; the black points mark places referred to in the study; the magenta triangles indicate historic and instrumental Mw ≥ 6.0 earthquakes near the drilling site (45). (C) The gray bars represent the fault rupture of historic Mw ≥ 7.0 earthquakes since 31 BCE (34, 36) that occurred along the focused part of the fault—the central Dead Sea Fault (up to 150 km north and south of the drilling site) click on image to open in a new tab
Lu et al. (2020)
- Location Map from
Lu et al. (2020)
Figure 1
Tectonic setting of the Dead Sea Fault. (A) Dead Sea Fault is a sinistral boundary between the African and Arabian plates (43). (B) Major active faults (43, 44) along the plate boundary, Dead Sea Transform; in this area, the fault is composed of four fault segments. The red star marks the drilling site; the black points mark places referred to in the study; the magenta triangles indicate historic and instrumental Mw ≥ 6.0 earthquakes near the drilling site (45). (C) The gray bars represent the fault rupture of historic Mw ≥ 7.0 earthquakes since 31 BCE (34, 36) that occurred along the focused part of the fault—the central Dead Sea Fault (up to 150 km north and south of the drilling site) click on image to open in a new tab
Lu et al. (2020)
- Location of Core 5017-1
in Google Earth
Location of Core 5017-1
click on image to explore this site on a new tab in Google Earth
- from Lu et al. (2020)
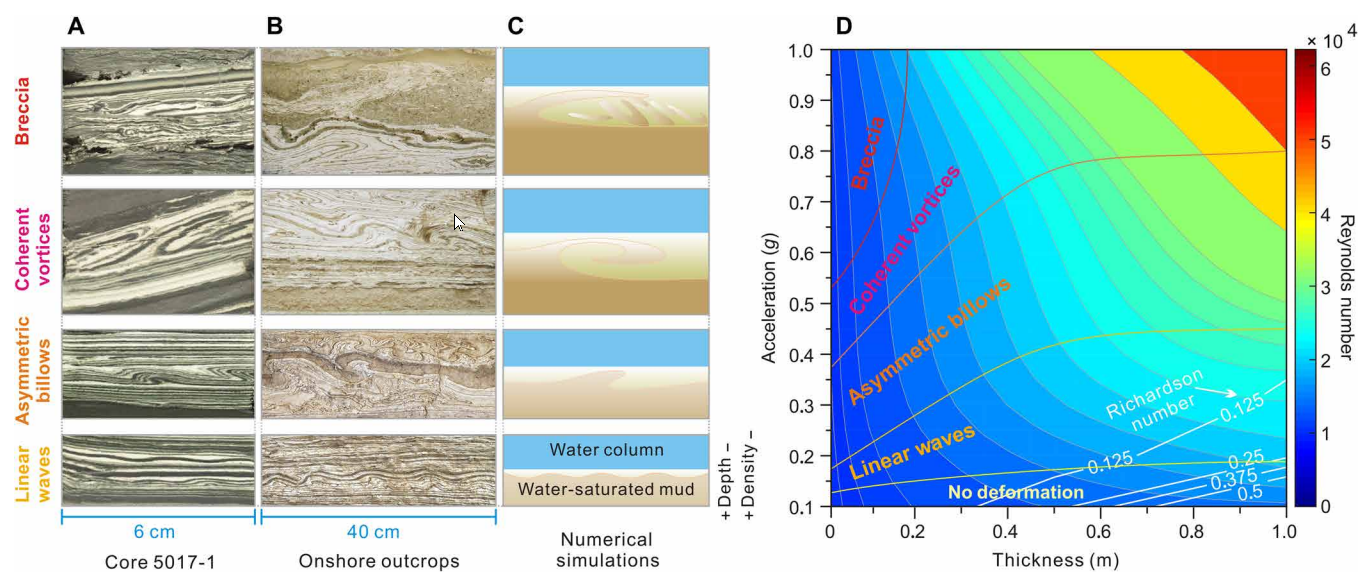 Figure 3
Numerical simulation on in situ folded layer and intraclast breccia structures in the Dead Sea sedimentary sequences.
- Typical structures from Dead Sea depocenter Core 5017-1
- Typical structures from Dead Sea onshore outcrops (Fig. 1B)
- Schematic diagrams based on snapshots from the numerical simulations demonstrating the four structures
- Quantitative estimation of the accelerations that are needed to initiate the four structures with different thicknesses; the deformations normally occurred when Richardson number ≤ 0.125
Lu et al. (2020)
- from Lu et al. (2020)
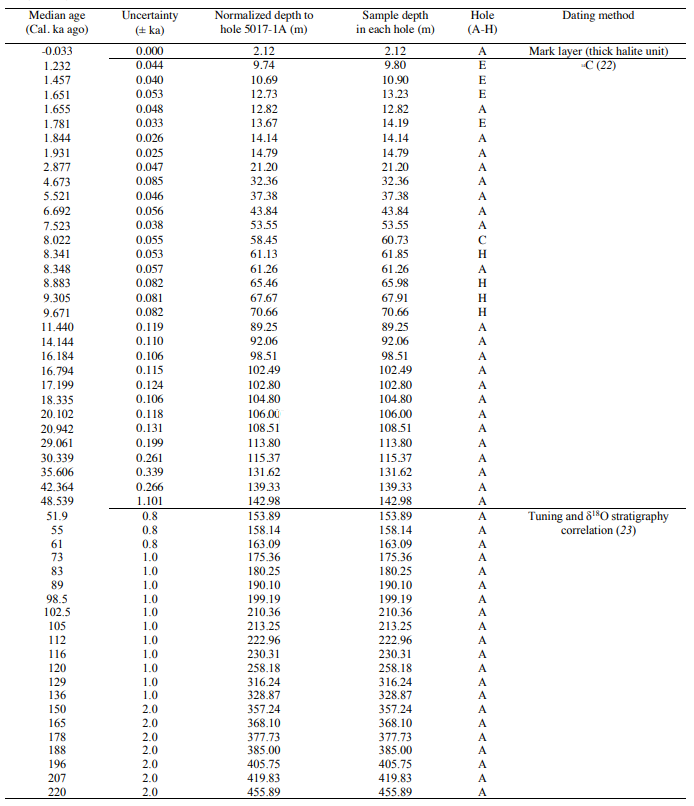 Table S1
Ages used to reconstruct age model and calculate timing of the seismites in the ICDP Core 5017-1 (22, 23).
click on image to open in a new tab
Lu et al. (2020)
- from Lu et al. (2020)
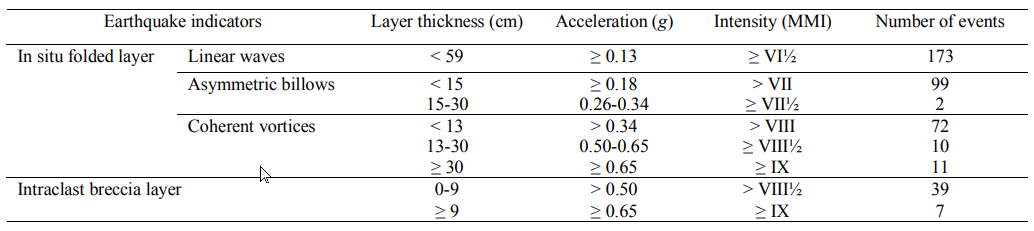 Table S2
Constraints on shaking intensities for individual events in the core via computational fluid dynamics modeling.
click on image to open in a new tab
Lu et al. (2020)
- from Lu et al. (2020)
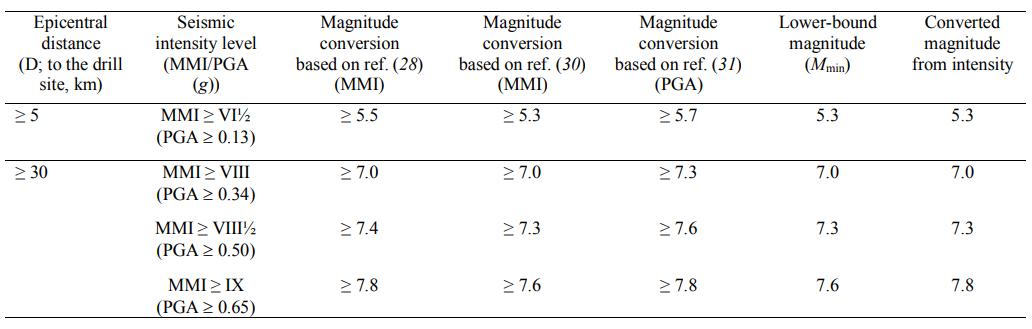 Table S3
Magnitude (MW) constraint for the paleo-events in the ICDP Core 5017-1.
click on image to open in a new tab
Lu et al. (2020)
- from Lu et al. (2020)
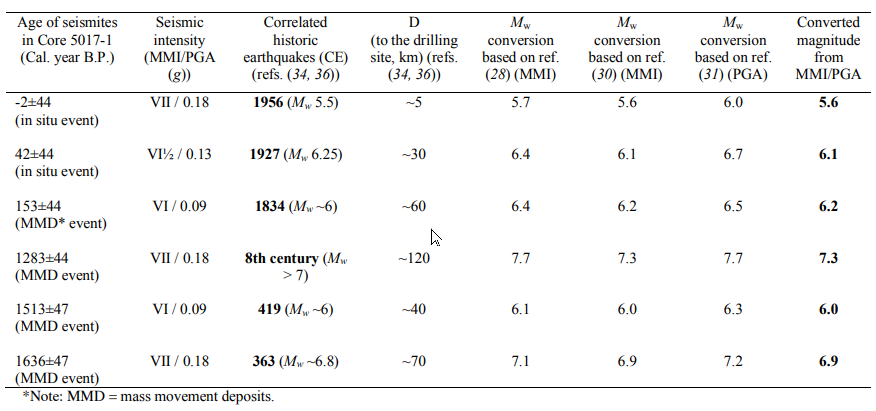 Table S4
Test of Magnitude (MW) conversion versus known historic earthquakes on the central Dead Sea Fault.
click on image to open in a new tab
Lu et al. (2020)
- from Lu et al. (2020:2)
Figure 3
Numerical simulation on in situ folded layer and intraclast breccia structures in the Dead Sea sedimentary sequences.
- Typical structures from Dead Sea depocenter Core 5017-1
- Typical structures from Dead Sea onshore outcrops (Fig. 1B)
- Schematic diagrams based on snapshots from the numerical simulations demonstrating the four structures
- Quantitative estimation of the accelerations that are needed to initiate the four structures with different thicknesses; the deformations normally occurred when Richardson number ≤ 0.125
Lu et al. (2020)
Similar to the structures preserved in the Dead Sea margin outcrops, the folded layers in the drilling core from the Dead Sea depocenter also appear as folded aragonite-detritus laminae in various forms of (i) linear waves (Fig. 2, A and B), (ii) asymmetric billows (Fig. 2, C to F), and (iii) coherent vortices (Fig. 2, G to J) (18). These delicate aragonite laminae are well preserved and can be traced in the strata, indicating that the layers are deformed in situ and have not undergone any notable transportation. That is, notable transportation would disaggregate and destroy the delicate submillimeter-thick aragonite laminae. Layer-parallel displacements characterize these in situ folded layers. The ICDP Core 5017-1 is positioned in the center of the Dead Sea abyssal plain. This makes improbable postdepositional causes for layer-parallel shears such as sloping substrates or downhill water flow above the sediments. In total, we identify 367 in situ folded layers in the ICDP Core 5017-1 (table S2). Figure S2 shows more examples of in situ folded layers in the drilling.
- from Lu et al. (2020:3)
Figure 3
Numerical simulation on in situ folded layer and intraclast breccia structures in the Dead Sea sedimentary sequences.
- Typical structures from Dead Sea depocenter Core 5017-1
- Typical structures from Dead Sea onshore outcrops (Fig. 1B)
- Schematic diagrams based on snapshots from the numerical simulations demonstrating the four structures
- Quantitative estimation of the accelerations that are needed to initiate the four structures with different thicknesses; the deformations normally occurred when Richardson number ≤ 0.125
Lu et al. (2020)
We update the previous computational fluid dynamics modeling of Wetzler et al. (18) by extending the upper limit of layer thickness and ground acceleration from 0.5 m and 0.6g to 1.0 m and 1.0g, respectively (Fig. 3; Materials and Methods). We run a series of two-dimensional numerical simulations using the physical properties of the soft sediments at the bottom of the Dead Sea based on the Kelvin-Helmholtz instability mechanism. According to the numerical simulations, formation of a layer of (i) linear waves, (ii) asymmetric billows, (iii) coherent vortices, and (iv) intraclast breccia requires a minimum acceleration of 0.13, 0.18, 0.34, and 0.50g, respectively (Fig. 3). Also, our numerical simulations indicate that the thickness of the deformed layer scales with acceleration (Fig. 3 and fig. S4). Because we could not directly determine the Reynolds number of an individual unstable layer at the time of seismic shaking, we constrain only the lower boundary of acceleration needed to initiate deformation of a layer with a certain thickness. By considering both the shape and thickness of the deformed layers, we identified 18, 67, 139, 141, 240, and 413 events with acceleration of ≥0.65g, ≥0.50g, ≥0.34g, ≥0.26g, ≥0.18g, and ≥0.13g, respectively (table S2).
- from Lu et al. (2020:4-5)
The spatial distribution of instrumental and historic moderate and large earthquakes on the central Dead Sea Fault Zone during the past 2 ka do supply additional clues for magnitude constraint for these strong seismic shaking events. The instrumental (33) and historical (5, 34–36) earthquake catalogs reveal that during the past 2 ka, all major earthquakes (Mw ≥ 6.0) occurred with D ≥ 30 km from the drilling site (Fig. 1B). By taking the past 2 ka earthquake scenario as an analogy for the paleoseismic record, we assume that most Mw ≥ 6.0 earthquakes occurred with D ≥ 30 km from the drilling site. Under this basic assumption and the three regional empirical attenuation relations, (i) an intensity of MMI ≥ VIII (PGA ≥ 0.34g) requires an earthquake with Mw ≥ 7.0, ≥7.0, and ≥7.3; (ii) an intensity of MMI ≥ VIII½ (PGA ≥ 0.50g) requires an earthquake with Mw ≥ 7.4, ≥7.3, and ≥7.6; and (iii) an intensity of MMI ≥ IX (PGA ≥ 0.65g) requires an earthquake with Mw ≥ 7.8, ≥7.6, and ≥7.8 (Fig. 4E and table S3). Therefore, we interpret the corresponding lower-bound magnitudes of strong seismic shaking events in the ICDP Core 5017-1 to be Mw ≥ 7.0, 7.3, and 7.6, respectively.
We test our magnitude conversion versus known historic earthquakes on the central Dead Sea Fault Zone. Six seismites in Core 5017-1 dated at −2 ± 44 years before the present (yr B.P.), 42 ± 44 yr B.P., 148 ± 44 yr B.P., 1248 ± 44 yr B.P., 1555 ± 47 yr B.P., and 1626 ± 47 yr B.P. correspond to the 1956 CE (Mw 5.5; D, ~5 km), 1927 CE (Mw 6.25; D, ~30 km), 1834 CE (Mw ~ 6; D, ~60 km), middle 8th century (Mw > 7; D, ~100 km), 419 CE (Mw ~ 6; D, ~40 km), and 363 CE (Mw ~ 6.8; D, ~70 km) earthquakes, respectively (table S4) (36). According to the regional empirical attenuation relations, we constrain the magnitudes of the six paleoearthquakes (seismites) with intensities of VII (0.18g), VI½ (0.13g), VI (0.09g), VII (0.18g), VI (0.09g), and VII (0.18g) as Mw 5.6, Mw 6.1, Mw 6.2, Mw 7.1, Mw 6.0, and Mw 6.9, respectively, which are in line with recorded historic magnitudes (table S4). This test supports our magnitude conversion based on the regional empirical ground motion attenuation relations.
Table S4
Test of Magnitude (MW) conversion versus known historic earthquakes on the central Dead Sea Fault.
click on image to open in a new tab
Lu et al. (2020)