En Feshka
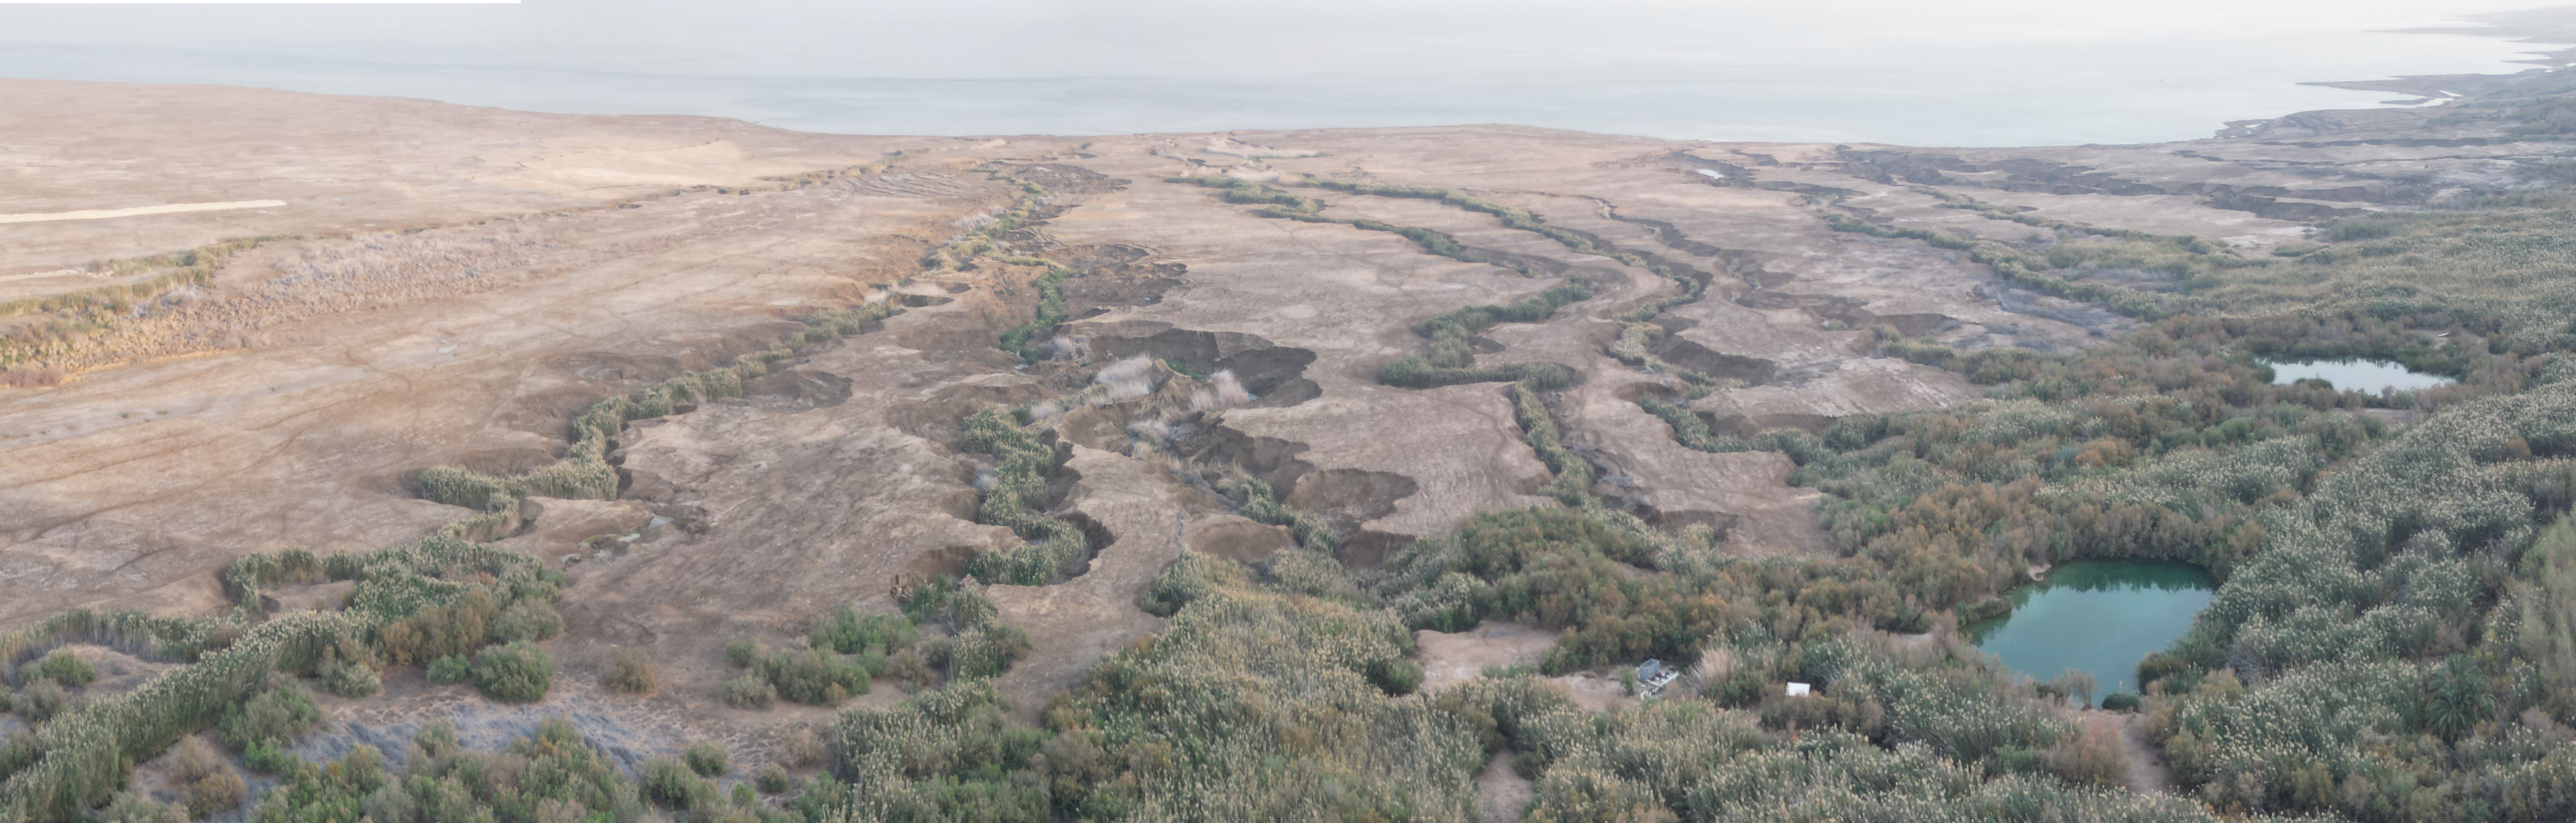 Aerial shot of "The Canyons" in En Feshka from the west
Click on Image for high resolution magnifiable image
Panorama from Drone Photos by Jefferson Williams 27 Feb. 2023
| Transliterated Name | Source | Name |
|---|---|---|
| En Feshka, Ein Feshka | ||
| Einot Tzukim | Hebrew | |
| Ayn Fashkhah | Arabic | عين فشخة |
- from En Feshka archaeoseismic Site Webpage - click link to open new tab
- Kagan et al. (2011) Sample Site
in En Feshka in Google Earth
 Kagan et al. (2011) Sample Site in En Feshka
click on image to explore this site on a new tab in Google Earth - Kagan et al. (2011) Sample Site
on govmap.gov.il
 Kagan et al. (2011) Sample Site in En Feshka
Trenches are described as being east of the Dir Hagla monastery
click on image to explore this site on a new tab in govmap.gov.il
 Figure 3
Stratigraphic section of Ein Feshkha outcrop and (right) age-depth deposition model derived by OxCal 4.1. Breccias are marked in section by hatched black layers. Probability density functions (histograms) on the graph give model ages for radiocarbon calibrated ages (marked with arrows; arrow directions are meaningless) and model boundaries (details given in Table 3). The histograms give the distributions for the single calibrated dates while the darker center part of each histogram take into account the stratigraphic information (see section 4 and Bronk Ramsey [2008] for model specifics). The depth model curves are envelopes for the 95% (outer, lighter, approximately 2σ) and 68% (inner, darker, approximately 1σ) highest probability density ranges. Color of model age curve changes at boundaries.
Kagan et al (2011)
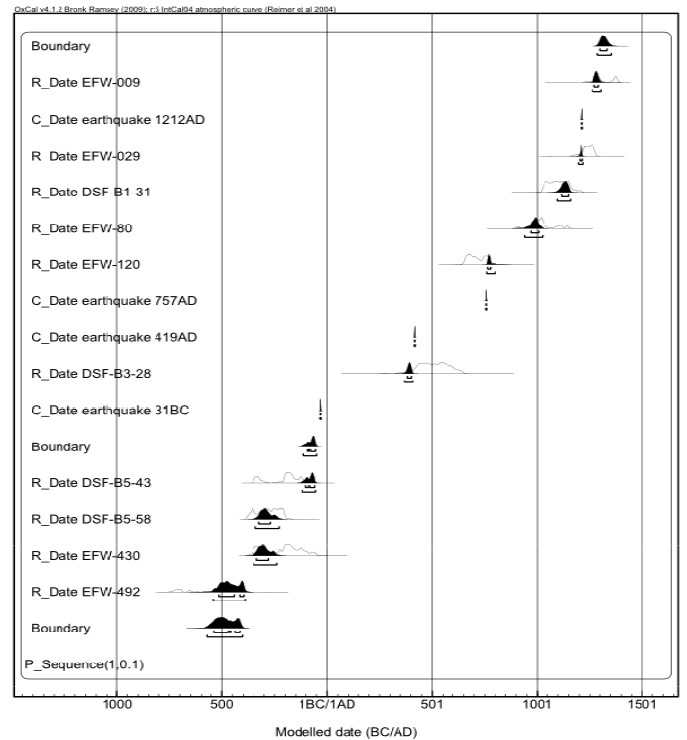 Figure 4
Date distribution of calibrated 14C ages
JW: Radiocarbon dates come from En Feshka
Kagan et al (2010)
- from Kagan et al. (2011)
- these have been incorporated into the Master Seismic Events Tables for all sites

Ze'elim and Ein Feshka Seismites with Model Ages and Historic Event Correlation
- LS, local source, moderate earthquake, not appearing in the historical catalogs, may have produced these seismites
- Gully depth below fan delta surface
- Seismite type
A, Intraclast breccia layer
B, Microbreccia (“homogenite” to the naked eye)
C, liquefied sand
D, Folded laminae
E, Small offsets
Q, Questionable as seismite. See Table 1 and Figure 2. - Model ages of seismites extrapolated from deposition model (see section 5 for details)
- Fit of historical earthquake dates within 1σ or 2σ calibrated age ranges of seismites. Although model ages are tabulated here with 1 year precision for convenience, event fit considers the realistic precision of 10 years (see section 5.1)
- All other possible events within the age probability range (1σ or 2σ range) of the designated earthquake; 1068a refers to March 1068 A.D., and 1068b refers to May 1068 A.D. (see Table A1)
- Outside model range, extrapolated from model (Figure 4)
- Outside model range, estimated based on below and above radiocarbon ages (Figure 4)
- Alternately, this historic earthquake could have formed seismites below or above the one marked
Kagan et al (2011)
- from Kagan et al. (2011) Correction
- these have been incorporated into the Master Seismic Events Tables for all sites
 Table 4
Multisite Comparison of Holocene Seismites from four lacustrine sediments sites along the Western Dead Sea Basin
Kagan et al (2011)
 Table 4
Multisite Comparison of Holocene Seismites from four lacustrine sediments sites along the Western Dead Sea Basin
Kagan et al (2011)
- from Kagan et al. (2011)
- these have been incorporated into the Master Seismic Events Tables for all sites
 Table 4
Multisite Comparison of Holocene Seismites from four lacustrine sediments sites along the Western Dead Sea Basin
Kagan et al (2011)
- from Kagan et al. (2011)
 Figure 7
Recurrence intervals and cumulative number of breccias in time.
- Ein Feshkha (EFE)
- Ein Gedi (EG)
- Zeelim (ZA1 and ZA2)
- Diamonds represent breccias
- circled diamonds are the IBS (intrabasin seismites)
- Horizontal gray bars indicate periods of seismic quiescence
(left) the earlier period is recorded at EG and ZA, and (right) the younger quiescence period is recorded at all three sites. Horizontal lines connect IBS events at the three sites.
Kagan et al (2011)
 Fig. 2
Lithology of the sediment cores and the established age-depth models of the different profiles. The Ze'elim coring profile is paralleled by the Ze'elim gully wall [16] . The Ein Gedi chronology is based on 20 radiocarbon dates and on the varve counted section (black line) in the upper part.
Migowski et. al. 2004


This core was taken in 1997 by GFZ/GSI
| Image | Description | Image | Description | Image | Description | Image | Description | Image | Description |
|---|---|---|---|---|---|---|---|---|---|
 Composite Core DSF
Depths 0-499 cm. Sections from top to bottom - B1, B2, B3, B4, and B5 GFZ/GSI |
Composite Core DSF Sections B1-B5 0-499 cm. |
||||||||
 Core DSF
Section B1 0-93 cm. GFZ/GSI |
Section B1 0-93 cm. |
 Core DSF
Section B2 100-197 cm. GFZ/GSI |
Section B2 100-197 cm. |
 Core DSF
Section B3 200-298 cm. GFZ/GSI |
Section B3 200-298 cm. |
 Core DSF
Section B4 300-396 cm. GFZ/GSI |
Section B4 300-396 cm. |

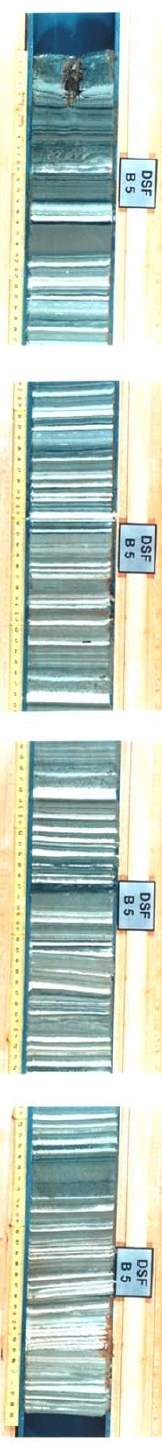 Core DSF
Section B5 400-499 cm. GFZ/GSI |
Section B5 400-499 cm. |
A comprehensive multisite paleoseismic archive of the late Holocene Dead Sea basin (past 2500 years) is established by constructing two age‐depth chronological models of two sedimentary sections exposed at the retreating shores of the modern Dead Sea. Two new paleoseismic study sites studied are the Ein Feshkha Nature Reserve outcrop located at the northern part of the basin and close to an active underwater transverse fault and the east Ze’elim Gully outcrop at the southern part of the basin. Age‐depth regression models are calculated for these sections based on atmospheric radiocarbon ages of short‐lived organic debris calibrated with a Bayesian model. The uncertainties on individual model ages are smaller than 100 years.
The new chronological records are compared to a laminae‐counting study of the Ein Gedi core (Migowski et al., 2004) located at the central Dead Sea basin. The Ein Feshkha outcrop yielded the largest number of seismites in the studied time interval (n = 52), while lower numbers of seismites are recovered from the Ze’elim outcrop and Ein Gedi core (n = 15 and 36, respectively). The seismites show no strong dependence on the limnological‐sedimentological conditions in the particular sampling sites (they coappear in both shallow and deep water environments and in different sedimentary facies). During time intervals when the chronologies are comparable it appears that the number of seismites is significantly larger in the northern part of the basin (Ein Gedi and Ein Feshkha).
Seismic quiescence intervals are apparent at all three sites from 2nd–4th century A.D. and at 500–150 B.C. at Ze’elim and Ein Gedi. Several synchronous seismites appear in all sections (termed here the intrabasin seismites (IBS)). Among them: 1927, 1293, 1202/1212, 749, 551 [JW: should be late 6th century CE], 419, and 33 A.D. and 31 and mid‐2nd century B.C. The recurrence time of the IBS from the 2nd century B.C. to the 14th century A.D. is ∼200 years, compared with ∼100 years for all earthquakes.
On a diagram of epicentral distance versus magnitude, historic earthquakes that are correlated with IBS plot in a field of high local intensity. The farther and stronger IBS earthquakes require lower local intensities to be recorded. This study demonstrates that a painstaking effort is still needed for unraveling the seismic history of the Dead Sea basin. The results also indicate that such a study will likely be highly rewarding.
[2] The Dead Sea Rift zone, extending from the Red Sea in the south to the Taurus Mountains in the north (Figure 1, inset), has been a major source of historic earthquakes [Ben‐Menahem et al., 1976; Garfunkel, 1981]. The fault system can potentially cause earthquakes that would affect a large number of people in the adjacent countries. Different types of paleoseismic evidence along the Dead Sea Transform (DST) show that large earthquakes have occurred in the past tens of thousands of years, [e.g., Reches and Hoexter, 1981; Marco et al., 1996; Amit et al., 1999; Klinger et al., 2000a; Niemi et al., 2001; Meghraoui et al., 2003; Shaked et al., 2004; Kagan et al., 2005; Matmon et al., 2005; Ferry et al., 2007]. The pioneering works of El‐Isa and Mustafa [1986] and Marco and coauthors [Marco and Agnon, 1995; Marco, 1996; Marco et al., 1996] on the intraclast breccia layers (originally termed “mixed layers”) in the late Pleistocene Lisan Fm. have set the stage for extensive lacustrine paleoseismic research in the Dead Sea basin. Intraclast breccias are temporally associated with surface faulting in places, strongly suggesting a genetic relationship between brecciation of the laminated lacustrine sediment and surface faulting, attesting to the earthquake origin of the deformation [Marco and Agnon, 2005]. Therefore, the intraclast breccia layers were interpreted as seismites. This identification was subsequently supported by the studies of Ken‐Tor et al. [2001a] and Migowski et al. [2004] who enabled correlations between dates of historic earthquakes (derived from historical charts) and radiocarbon ages of intraclast breccias and other seismites (e.g., liquefied sands) recovered from the exposures and drillholes of the late Holocene Ze’elim Fm. Katz et al. [2009] have reported geochemical anomalies in intraclast breccia layers, carried by microcrystals of barium‐strontium‐sulphate. They suggest that precipitation of these microcrystals from a supersaturated brine was triggered by exposure of gypsum nucleation centers, formed on the bottom sediments and suspended during earthquake shaking.
[3] The presence of seismites in late Quaternary sedimentary sections in the Dead Sea basin allows reconstruction of earthquake recurrence patterns. Establishment of such patterns was attempted by Marco et al. [1996] for the Lisan Fm. comprising the sedimentary sequences of Lake Lisan that filled the Dead Sea basin during the last glacial period (∼70–14 ka). They determined an average recurrence interval (RI) of 1600 years with a coefficient of variation larger than unity, expressed as alternation of periods of 10–15 kyr with earthquakes occurring in relatively rapid succession, versus ones with relative quiescence (clustering [see Kagan and Jackson, 1991]). Subsequently, Ken‐Tor et al. [2001a] and Migowski et al. [2004] established the RI for the last ∼2000 years (RI = 100–300 years) and ∼10,000 years (RI = 100–1000 years, clustered), respectively.
[4] The seismites are probably the result of turbulence in the soft sediment [Heifetz et al., 2005]; the threshold for triggering can be affected by water depth at the site (mass of water above sediment), lithology, sediment compaction, and sedimentation rate. The intensity of shaking depends on earthquake magnitude, distance from source, and position with respect to basin structure (“basin effects”). None of these factors controlling the intensity and its threshold was evaluated rigorously. Early efforts in quantifying the “basin effect” were conducted by Begin et al. [2005] who argue that site effects due to basin topography may have caused seismite thickness differences between two Pleistocene lacustrine sections. On the other hand, Ken‐Tor et al. [2001a] and Migowski et al. [2004] found no relationship between seismite thickness and historical earthquake intensity. On outcrop scale, Marco and Agnon [2005] found lateral thickness variations of seismites across faults at the Massada Pleistocene seismite site. This illustrates that seismite thickness can be dictated by the local bathymetry that moderates postseismic transport. At the Wadi Darga outcrop thickness changes were reported in association with faults, while in some beds internal deformation disappears as a layer thins and reappears when the layer returns to its more characteristic thickness [Enzel et al., 2000]. These authors suggest that bedding or laminae thickness may be one control on seismite formation. Heifetz et al. [2005] assert that compaction profile, ground acceleration, and wave period all determine the threshold for onset of deformation. Therefore the thickness of the deformed sequence may be sensitive to the details of the wave train, and not necessarily to the local intensity.
[5] Most of the paleoseismic studies in the Dead Sea basin, as of yet, based the evaluation of the data (e.g., recurrence intervals) on the individual sections. Nevertheless, an important result of the study done by Migowski et al. [2004] on the Ein Gedi core, was their comparison with the existing Ze’elim Gully chronology [Ken‐Tor et al., 2001a], showing that historic earthquakes that lack in the Ze’elim archive occurred during depositional hiatuses, while they do appear in the more continuous Ein Gedi core.
[6] In this paper, we expand the effort to integrate multisite paleoseismite information. We analyze and date two new seismite‐bearing outcrops: Ein Feshkha Nature Reserve section and an eastern Ze’elim Gully section. We then compare the patterns of seismite appearance with the previously dated Ein Gedi core and western Ze’elim Gully exposure. This integrated study allows us to compose a picture of the spatial and temporal distribution (e.g., the recurrence intervals (RI)) of earthquakes that affected part of or the entire Dead Sea basin (as monitored in the three recording stations). Specific issues dealt with in this study are: sedimentary characterization of the seismites (namely, the dependence of the seismite appearance on the sedimentary facies and environment of deposition), the temporal (RI) and spatial patterns of seismites at the late Holocene Dead Sea basin, and identification of earthquakes that formed seismites along the entire basin.
[7] The Holocene Dead Sea is a terminal lake filling a deep tectonic depression along the boundary between the Sinai subplate and the Arabia plate, the Dead Sea Transform (DST). The DST has a total left‐lateral offset of about 105 km since about 18 Ma [Freund et al., 1968]. Over 1100 km long, it trends from the spreading center in the Red Sea to the Taurus collision zone in Turkey. The Dead Sea basin is likely the largest pull‐apart basin along the DST and one of the largest pull‐apart basins on Earth [Mechie et al., 2009]. Recent comprehensive geophysical investigations have illuminated the structure of the lithosphere and crust across pure transform and basinal segments (Wadi Araba and Dead Sea, respectively) [ten Brink et al., 2006; Mechie et al., 2009; Weber et al., 2009]. The Dead Sea straddles the strike‐slip duplex fault structure [cf. Woodcock and Fischer, 1986]. Three transverse faults have been mapped in the Dead Sea basin (Figure 1): the Kalia fault, the Ein Gedi fault, and the Amatzyahu fault. Details of the Dead Sea basin fault system are given in Figure 1. Two GPS campaigns 6 years apart at seventeen stations straddling Wadi Araba yielded ongoing slip rate calculations of 4.9 ± 1.4 mm/yr [Le Beon et al., 2008]. Slip rates calculated by geological and archeological markers, on varying time scales, yielded slip rates of 1.5–8.5 mm/yr [Freund et al., 1968; Garfunkel, 1981; Ginat et al., 1998; Klinger et al., 2000b; Niemi et al., 2001; Gomez et al., 2003; Meghraoui et al., 2003; Marco et al., 2005; Gomez et al., 2007].
[8] Frequent seismic activity along the DST has been detected instrumentally in the past century and recorded historically and archeologically over the past 4000 years [Ben‐Menahem, 1991; Ambraseys et al., 1994; Guidoboni et al., 1994; Ellenblum et al., 1998; Guidoboni and Comastri, 2005; Haynes et al., 2006; Marco et al., 2006; Ambraseys, 2009]. Other faults in the region are much less active and distant to the Dead Sea and are therefore less likely candidates for earthquake sources of the sediment deformation at the Dead Sea.
[9] The first major earthquake on the DST to be recorded instrumentally was M6.2 on 11 July 1927 in the northern Dead Sea (Figure 1) [Avni, 1999]. The location of the event is given by an error uncertainty ellipse in Figure 1 which is based on best estimate of seismological data [Shapira et al., 1993] and our tectonic considerations [cf. Niemi and Ben‐ Avraham, 1994]. On 11 February 2004 a M5.1 earthquake ruptured the northeast corner of the pull‐apart, with an aftershock sequence demarcating a transverse fault [Lazar et al., 2006; Hofstetter et al., 2008] (Figure 1). This fault is termed the Kalia fault [Lazar et al., 2006].
[10] The sediments of the Holocene Dead Sea comprise the Ze’elim Fm. of the Dead Sea Group. The sediments represent various depositional environments: fluvial, fan deltas, shores, and lacustrine (see detailed description given by Bookman (Ken‐Tor) et al. [2004]). The current (2009) lake level is 422 m below sea level (mbsl), reflecting mainly anthropogenic diversion of freshwater inflow, while during the Holocene the natural (climate related) level varied from ∼370 mbsl (e.g., ∼6000 years ago) to lower than ∼430 mbsl around 8000 years ago [Bookman (Ken‐Tor) et al., 2004; Bookman et al., 2006; Migowski et al., 2006; Bartov et al., 2007]. The drop of the current lake level (12 m from 1980 to 2000 [Bookman (Ken‐Tor) et al., 2004]) has caused the formation of deep gullies along the retreating shores. These gullies provided an excellent opportunity to study the late Holocene sedimentary sections in detail. The paleoseismic data in the current study was derived from the outcrops of the Ze’elim Gully and the Ein Feshkha Gully. Another site used for comparison, the Ein Gedi core site, was studied by Migowski et al. [2004].
[11] The study site of Ein Feshkha Gully (at the Ein Feshkha Nature Reserve) is located at the northwestern shore of the Dead Sea, 60 km north of the Ze’elim Gully (Figure 1). Ein Feshkha is an oasis of brackish streams and pools. Nearly exclusively lacustrine sediments are exposed in the Ein Feshkha site by a ∼6.5 m deep gully (as of 2008). The site is close to the Jordan Valley segment of the DST and may be located on the WNW continuation of the Kalia transverse fault mentioned in section 2.
[12] The Ze’elim gullies (site ZA) are dissected into the Ze’elim Plain east of the ancient fortress of Massada (Figure 1). Currently (as of 2009) the ZA Gully is ∼11 m deep (approximately at lake level, to slightly above). The gully exposes a stratigraphic sequence of lacustrine, shore environment, and fluvial sediments. The ZA site is closer to the Arava segment of the DST, about 50 km away, than to the Jericho fault. The active eastern normal boundary fault of the DST is at a similar distance to all sites, less than 5 km away (Figure 1).
[13] El‐Isa and Mustafa [1986] used intraformational folds to generate an earthquake archive. Subsequent studies presented more complete archives recognizing that folds might present the weakest events. “Mixed layers” were renamed “intraclast breccia layers” [Agnon et al., 2006].
[14] Agnon et al. [2006] define field criteria for the recognition of intraclast breccias, focusing on features diagnostic of a seismic origin. The field criteria reflect the mechanisms of breccia formation, which include ground acceleration, shearing, liquefaction, water escape, fluidization, and resuspension of the originally laminated mud.
[15] In the current study we recognize deformed structures such as intraclast breccias, liquefied sands, folded laminae, and small faults (centimeter scale) (Table 1). Figure 2 displays photographs and photo tracings of seismites from the study sites. In addition we recognize another type of deformation termed microbreccia or homogenite. This type of mid‐gray‐color sedimentary layer ranges in thickness from a few mm to 1–2 cm and appears homogenous in the field. Thin‐section investigation under a polarizing microscope shows that these are actually brecciated laminae, and include a mixture of detritus, aragonite, and in places gypsum fragments.
[16] In the more fluvial Ze’elim section there are instances of seismites with a combination of lacustrine breccia and sand liquefaction. For example (see Figure 2c), ZA seismite III is the product of the deformation of a lower sandy layer and an upper laminated marl layer, resulting in brecciated marl laminae (near top of Figure 2c) with injection of sand fingers (near bottom of Figure 2c) from below.
[17] Fieldwork included the detailed description and sampling of subvertical to vertical outcrops in the Ein Feshkha and Ze’elim gullies. Columnar sections were prepared with emphasis on measurement and description of the deformations. Adjacent outcrops were examined in order to describe spatial variations in lithology and seismites. Sediment blocks (∼10 × 10 × 10 cm in size) were collected for further analysis in the lab. At Ein Feshkha, 58 continuous blocks of wet sediment were retrieved from the gully wall at the columnar section site, from the surface plain down to 40 cm below the autumn 2005 water level of the spring outflow (see our previous paper, Neumann et al. [2007]). At the Ze’elim Gully sediment blocks were retrieved from the various lithological units. In addition, organic debris (typically short‐lived leaves or twigs), found in the two outcrops, were sampled for radiocarbon dating.
[18] The Ein Feshkha section was documented in an outcrop in the gully incising into the nearshore surface of elevation 413 mbsl. The stratigraphic section of Ein Feshkha, down to a depth of 5.9 m below plain surface, is given in Figure 3. The section spans approximately 3000 years. The sediments are mainly laminated lacustrine calcitic silts and clays and sequences of laminated primary aragonite and fine detritus. Fifty‐two layers in this laminated sequence display disturbed sedimentary features. Organic debris, mainly twigs, are common and are often found within breccia layers. The base of the outcrop is characterized by 5–50 cm thick domelike structures consisting of aragonite crusts, marl, and commonly driftwood encrusted with concentric hard gypsum [Neumann et al., 2007]. The occurrence of dome structures is a localized phenomenon, which is known from the nearshore fan‐delta surface (1400 A.D. or younger). These structures probably represent lake lowstands.
[19] We investigate a 10.75 m deep section in the Ze’elim A Gully, which shows both lacustrine and fluvial fan delta sediments (Figure 4). The section (ZA2) spans approximately 6500 years and consists mainly of laminated calcitic marls with some aragonite laminae, gypsum, silt, sand, and pebbles. Sediment features include beach ridges, cross‐bedded carbonatic sands, aragonite crusts, brecciated marls, and liquefied sand [see Bookman (Ken‐Tor) et al., 2004]. The laminae are interrupted by deformed sedimentary structures (Figure 4). A prominent beach ridge that was dated to ∼1200 B.C. appears at a section depth of 8–9 m. The beach ridge marks a significant drop in lake level that was associated with abrupt aridity in the Dead Sea drainage region [Kushnir and Stein, 2010]. A 2‐m‐thick section below this beach ridge shows several deformed layers, including breccias and “ball and flame” sand liquefaction structures. They laterally change their thickness, their appearance, and their position relative to the beach ridge. There are many on‐laps, angular and erosional unconformities, and facies changes in this unit below the beach ridge and therefore a detailed study of the seismites there is not attempted. This ZA2 section is a few tens of meters east (lakeward) of the section studied by Ken‐Tor et al. [2001a] (termed here ZA1).
[20] The chronologies of the Ein Feshkha and Ze’elim sections were constructed by radiocarbon dating of terrestrial organic debris (mainly small pieces of wood and twigs). All the recovered wood in Dead Sea sections can be considered driftwood, however their transport time is relatively short. We made an effort, where possible, to date only short‐lived organic debris. Nine samples from EFE and twelve samples from ZA2 were prepared for radiocarbon dating at the Radiocarbon laboratory, Weizmann Institute, Rehovot, Israel. The samples were then measured by accelerator mass spectrometry (AMS) or liquid scintillation counting (LSC) at the NSF radiocarbon facility in Arizona. Eight additional organic debris samples from EFE were taken from a core drilled a mere few meters away, on the cliff bounding the gully, and analyzed at the AMS facility in Kiel. The core was correlated with the outcrop by Marcus Schwab at GFZ‐Potsdam. Radiocarbon ages are reported (Table 2) in conventional radiocarbon years (BP = before present; present defined as 1950 A.D.) in accordance with international convention [Stuiver and Polach, 1977]. Calibrated ages (=cal BP) were calculated by applying the INTCAL04 calibration scheme of Reimer et al. [2004] by means of the OxCal v4.1 program of Bronk Ramsey [1995, 2001, 2008]. Age‐depth models (Figures 3 and 4) and seismite model ages (see Table 3) were also created with OxCal (v4.1) [Bronk Ramsey, 1995, 2001, 2008].
[21] Radiocarbon data are listed in Table 2. Table 2 presents the measured ages, calibrated ages, and deposition model ages applying the Bayesian statistics of the OxCal v4.1 program. The depositional model ages were used to establish an age‐depth chronological model for the seismites. The fundamental assumption in Bayesian modeling of stratigraphic sequences is that age increases with depth. This requires use of a function usually termed “Boundaries” in OxCal. The boundaries separate different sedimentary units that may have different sedimentation rates, grain sizes, and facies. They are also placed on the top and bottom of the entire series to constrain the model to a specific time interval. With no other information, this would be treated by what is usually termed the “Sequence” model by OxCal. A uniform sedimentation rate would be treated with the “U_Sequence” type model. Depth and other dating information can be included in a less rigid way using Poisson distribution priors, termed “P_Sequence” models, where the time gap between deposition of grains varies, and the events are basically random but deposition is given approximate proportionality to depth. This requires the estimation of the uniformity of the deposition (given as the k parameter), which signifies the increment size (conceptually the grain size, or size of deposition events) and indicates the relation between the events and the stratigraphic process [Bronk Ramsey, 2008].
[22] In this study a P_sequence (Poisson distribution) Bayesian depositional model was used, with a k factor value of 1 (see Bronk Ramsey [2008] and Kagan et al. [2010] for details of Bayesian factors used). In the work of Kagan et al. [2010] the main objective was to test the Bayesian model with and without historical earthquake anchor points. The conclusion of the work was that the “known‐earthquake‐anchors” do not significantly improve the age model. For that reason, and due to the complexity in choosing definite historical anchors, in this study no anchors are used and the models are based solely on radiocarbon data, stratigraphic data, and the P_sequence and k factor constraints discussed in this section and by Kagan et al. [2010].
[23] For the EFE section the chronological model is based on the treatment of seventeen radiocarbon ages of which five were excluded as outliers (Table 2). In the last 2500 years, the period with historic earthquake correlations and implications, there were only two outliers, both of which were too old and probably represent long‐lived organic debris from the shores. One of these two outlier samples also appeared in the work of Neumann et al. [2007] (169 cm depth) and was considered an outlier. One interval, from 230 to 390 cm, is slightly anomalous: the sediment is much darker than the rest of the section and has less aragonite layers. Within this interval, between 230 and 330 cm, we did not recognize any deformed layers (Table 3). No organic debris was found from 220 to 410 cm depth (Table 2 and Figure 3).
[24] Several different models were run: (1) No internal boundaries from 0 to 500 m depth; 500 cm to base modeled separately. (2) Two internal boundaries in the 0–537 cm interval, at 230 and at 500 cm depth, which allow, but do not force, the model to have sediment rate changes. (3) The 0–230 cm and 390–500 cm deep segments run separately. (4) Various other options with different boundaries and various outliers.
[25] We choose option 2 from the above list (Figure 3). This curve yields the best “agreement indexes” for the Bayesian model, with one index value under 60% (at 17%) while the other models have lower agreement indexes. Alternative models give seismite ages (from at least the 5th century B.C. and on) that are very similar to the chosen model and do not change the paleoseismic conclusions (for an example, see option 1 in Figure S1).1 The slight facies change at 230 cm depth is allowed a degree of freedom to coincide with sedimentation rate change, but in the resulting model shows no significant rate change (see Figure 3).
[26] The chronology of the top 537 cm of the section is Bayesian‐modeled as one space with two internal boundaries at 230 cm and 500 cm, implying continuous sedimentation and allowing, but not forcing, sedimentation rate change at these boundaries. Agreement values are found to be well above 60% at most depths of the model. The resulting model ages of the section indicate a maximum range of 1261 B.C. to 1383 A.D., but more likely from ∼1100 B.C. to 1312 A.D. (Table 2 and Figure 3). The top unit, from 0 cm (surface) to 500 cm, shows ages that range from the 5th century B.C. to the 14th century A.D., with a 0.27 ± 0.03 cm/yr sedimentation rate (based on 2s age ranges). The age range of the lower unit (500 to 537 cm) is from approximately 11th–5th century B.C. (0.07 ± 0.03 cm/yr sedimentation). The base of the seismite‐bearing investigated section is at 590 cm, however in the bottom 53 cm no organic matter was found and therefore the age was not modeled. The sedimentation rate of the top 500 cm calculated here (0.27 cm/yr) is approximately constant, in comparison to that stated for the same section by Neumann et al. [2007] (0.14, 0.51, and 0.11 cm/yr for three stratigraphic units within the same depth interval). The rates presented here, based on the new Bayesian model, are more similar to published Holocene rates (e.g., Migowski et al. [2004]: ∼0.15 cm/yr for the entire Holocene Ein Gedi core) and more congruous with homogeneous pollen concentrations [Neumann et al., 2007], which are normally closely linked to sedimentation rate [Horowitz, 1992].
[27] The truncation of the last six centuries from the studied EFE section eliminates recording the key instrumental earthquake M6.2, 7 November 1927, the source zone of which spans the site (Figure 1). Macroseismic evidence for the 1927 A.D. instrumentally recorded earthquake was reported along the Jordan River [Hough and Avni, 2011]. Niemi and Ben‐Avraham [1994] interpreted large submarine slumps in the northern Dead Sea basin to have been caused by this earthquake. For the purpose of the discussion (section 5), this event will be considered recorded in the northern Dead Sea basin.
[28] Twelve organic debris samples from the 10.7 m deep Ze’elim (ZA2) outcrop were measured. Their calibrated radiocarbon ages range from 1056 to 1276 A.D. to 4843–4583 B.C. (95% probability). A deposition model is calculated for the top 8 m of this section. Model ages of samples are given in Table 2. The more western ZA1 section (∼100 m away) was dated by Ken‐Tor et al. [2001a, 2001b] and revised by Agnon et al. [2006]. In the Ze’elim Gully previous studies infer the sedimentation rate to range between 0.28 to up to ∼1.3 cm/yr [Ken‐Tor et al., 2001a; Agnon et al., 2006; Neumann et al., 2007] reflecting the additional detrital‐clastic sediments that are more abundant in the fan delta environment. The lower sedimentation rate (0.3 ± 0.03 cm/yr) at the ZA2 section of Ze’elim (current study) reflects the proximity of this section to the lacustrine environment. The ZA2 outcrop is interpreted to show continuous deposition according to the age‐depth model (Figure 4), as opposed to the numerous unconformities at the more landward ZA1 outcrop. However, at ZA2 there is the possibility of short hiatuses compensated by additional sediments at sandy facies which therefore are not manifested in the age‐depth diagram.
[29] Ages of seismites (Table 3) are interpolated from the radiocarbon age‐depth data using Bayesian stratigraphic constraints. The ages and their uncertainties are interpolated using the OxCal program and take into consideration the asymmetrical probability distribution of radiocarbon ages. Each seismite is assigned a probability distribution histogram with a 68% (∼1s) and 95% (∼2s) probability age range (Figures 3 and 4). Model ages are presented (Table 3) with a nominal precision of a single year, however due to the Bayesian statistical modeling each model run produces slightly different age ranges and therefore ages could be rounded off by 10 years. Although the annual dates are shown, they are dealt with as if rounded off; for example, when giving the historical “fit” in Table 3, the age ranges are considered in decades.
[30] Seismite ages have been compared to historical catalogs as a major component in the assessment of the validity of the interpretation of the breccia layers as seismites [e.g., Ken‐Tor et al., 2001a; Migowski et al., 2004]. At the same time, seismites can be used for the corroboration of individual earthquakes in the historical record. Ken‐Tor et al. [2001a, 2001b] used the radiocarbon ages of the individual breccia layers or liquefied sands for direct comparison with the historical records and noted that notorious historic earthquakes unrepresented in the geological record lie within sedimentary hiatuses in the western Ze’elim Gully section (termed here ZA1). Migowski et al. [2004] positively identified these “missing” earthquakes in the continuous lacustrine section of the Ein Gedi core, supporting the hiatus‐hypothesis. Moreover, by counting the laminae in the intervals between seismites they were able to correlate almost the entire historical and Ein Gedi core records.
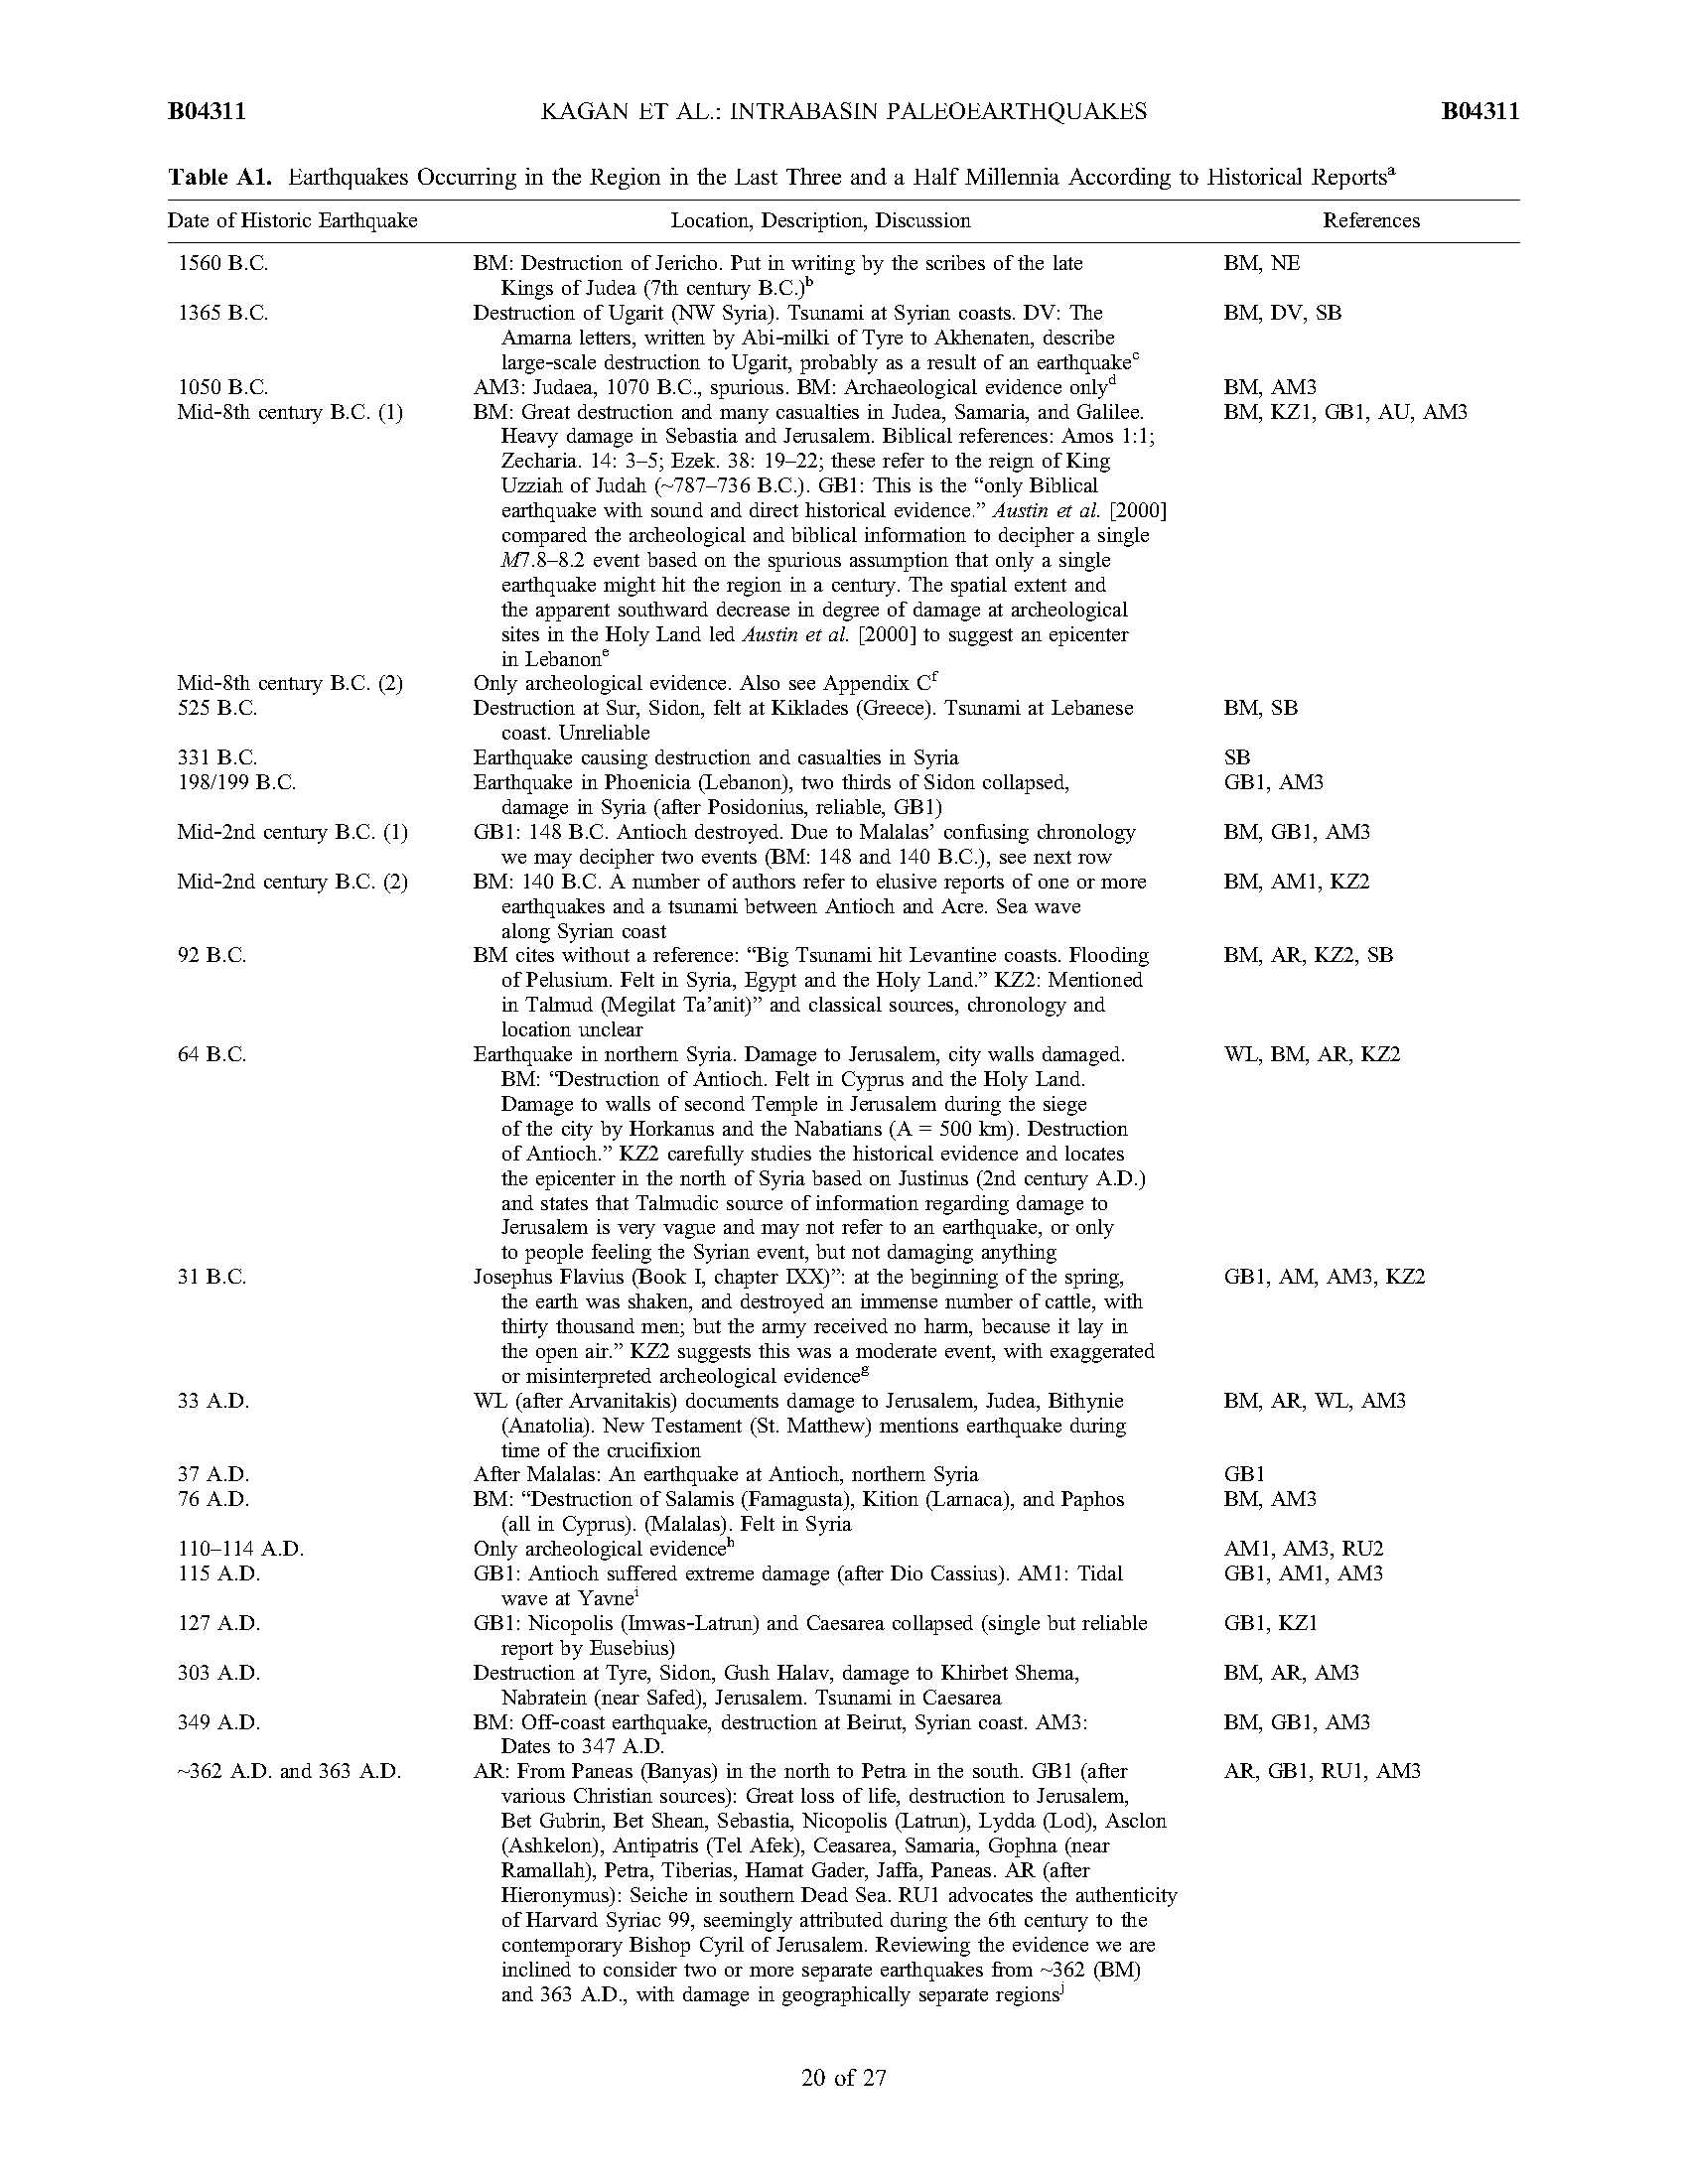
[31] Table A1 presents the historic earthquakes in the region with information regarding damage, casualties, sources of historical data, and, in the footnotes, selected archeological and paleoseismic data. Table A1 is based on earthquake catalogs, whereas the information in the catalogs is derived from historical sources. Table A1 is reliable mostly during the past two millennia (from the Roman period and onward), but less information is available for the time interval 750–1100 A.D. (when the Muslim empire center moved from Damascus to Baghdad). The historical accounts in the pre‐Christian era are rare and if they do exist tend to be vague [Karcz, 2004]. A mid‐8th century event and its paleoseismological and historical implications are discussed in detail in Appendix C. Local source moderate earthquakes are probably missing in the historical catalogs. For seismite ages where only very distant correlative historic earthquakes exist, we propose small local source events as possible sources of seismite genesis (marked LS on Table 3). A map of historical locations is given in Appendix B (Figure B1).
[32] For the past two millennia we correlated almost all of the seismites in the Ze’elim and Ein Feshkha records to historic earthquakes (details in Tables 3 and 4). All historic earthquake dates that correspond to the 95% probability range of each seismite age are given in Table 3 (right column). Those that correspond to the 68% probability range are in bold.
[33] The protocol for assigning a particular historic earthquake to a seismite in the sedimentary section is the following: (1) We consider all known earthquakes within a time segment of the age‐depth model pertaining to the seismite depth (segment = within 1–2s uncertainty of the radiocarbon model age); this step is given in column titled “all possible events” in Table 3. (2) Among the earthquakes within this time segment, we select the one that is most consistent with age‐depth models of Figures 3 and 4 (preserving the sedimentation rate); see the correlation in Figure 5. We also considered the local intensity for the earthquakes estimated for the study area when deliberating, in certain cases, between the various earthquakes.
[34] Table 4 and Figure 5 present the results of the correlation of the paleoseismic evidence (Table 3) with the historical record (Appendix A) and the comparison of these results from four sections: EFE, EG, ZA1, and ZA2. In Figure 5 the historical dates of seismites are superimposed on the age‐depth models to display the matching of the two models; the deposition model and the historical correlation model.
[35] There are two possible sources of errors in a comparison between two archives, such as the historic earthquakes and the radiocarbon dated seismites. As noted in Table 3 the uncertainty in the age‐depth model is variable but typically less than 100 years (2s). This reflects the errors derived from the age‐depth Bayesian model. The uncertainty in the “historic ages” of specific seismites reflects the spread of all historic earthquakes that lie within the 2s model age range of the specific seismite depth (the right‐hand column of Table 3). Thus, the errors on the Bayesian curve are the reasonable estimate of errors in the historical ages–seismite comparison. In other words, we say that the maximum error in our comparison is less than 100 years and, as Table 3 shows, typically lower than 50 years.
[36] A special case is the couplet of earthquakes at 1202 and 1212 A.D. that, with the typical temporal resolution in Dead Sea sediments, are not resolvable. We chose to present them as a pair of events as 1202/1212 A.D. The seismite at 28 cm depth at EFE has a 1s model age of 1199–1240 A.D. Both the 1202 and 1212 A.D. events are large M >7 earthquakes that ruptured far from the Dead Sea (north of the Sea of Galilee to Lebanon, minimum 130 km [Marco et al., 2005] and south of the Arava, minimum 250 km, respectively). Agnon et al. [2006] show two adjacent seismites at this time in the EG core record and interpret these to represent both the 1202 and 1212 A.D. events. Both are candidates for this EFE seismite.
[37] The Ein Gedi core was dated by 20 radiocarbon ages and by laminae‐counting of ∼1500 years, from 200 B.C. to 1300 A.D. [Migowski, 2001; Migowski et al., 2004]. The laminae‐counted floating chronology of the seismites was matched with the historic earthquake catalog. The best‐fit history of Migowski et al. [2004] gave ages younger than their radiocarbon ages by 50–200 years, consistent with reworking of organic debris (e.g., wood) in the nearshore environment before settling to the bottom of the dense saline lake. In our analysis, the chronologies of the Ze’elim and Ein Feshkha section indicate no long reworking time of the organic debris before settling in the sediment. When referring to the seismites from the Ein Gedi (EG) core only we use the shifted laminae‐counted chronology of Migowski et al. [2004] for the EG section.
[38] Note in Table 3 that the type B seismites, “homogenites,” clearly correlate with important historic earthquakes, which supports their interpretation as seismites.
[39] The recording of earthquakes by seismites, as well as by historical documents, requires intensity above respective thresholds. In this study our data suggest that these two thresholds are similar. Quiescence intervals are more robust than specific earthquakes, because they are less sensitive to individual date correlation. Specifically there is a quiescence interval in the seismite archive of the three sites from the end of the 2nd to the beginning of the 4th century A.D. (Figure 7). This correlates to an historical earthquake quiescence period noted without a single historically documented earthquake in the region from 127 to 306 A.D. (Appendix A).
[40] Here we summarize the occurrence of seismites at the three sites presented in section 5.1 and in Table 4: Ein Feshkha (EFE), this study; Ein Gedi (EG core; after Migowski et al. [2004]); and the two Ze’elim Gully subsites: ZA1 (western, landward; after Ken‐Tor et al. [2001a] and Agnon et al. [2006]) and ZA2 (eastern, lakeward; this study), considered henceforth as one site. We limit the comparison to the historical period starting at the 2nd century B.C.
[41] 1. Seismites that appear in all three sites (termed here intrabasin seismites (IBS)): Mid‐2nd century and 31 B.C. and 33, 419, 551, 749, 1202/1212, 1293, and 1927 A.D.
[42] 2. Seismites that appear only in Ein Gedi: 76, 90, 112, 500/502, 1042, 1546, 1588, 1656, 1712, 1759, and 1822 A.D.
[43] 3. Seismites that appear only in Ein Feshkha: 64 B.C., 349, 363, 634, 847, 859, 956, 1063, 1170, and 1312 A.D., and numerous older prehistoric seismites.
[44] 4. Seismites that appear in Ein Gedi and Ein Feshkha but not in Ze’elim: 92 B.C. and 660, 757, 873, 991*, 1033*, 1114/1117*, and 1068* A.D. Stars indicate dates at which time there is no archive at Ze’elim.
[45] 5. There is one quiescence interval at ZA and EG ∼500–150 B.C. and another at all three sites from the end of the 2nd to the middle of the 4th century A.D.
[46] The new chronologies of the seismites in the Ze’elim (ZA) and Ein Feshkha (EFE) sedimentary sections are integrated with the high‐resolution seismite chronology of the Ein Gedi (EG) core to produce a comprehensive archive of late Holocene paleoseismic earthquakes from the entire Dead Sea basin. The paleoseismic archives also provide an opportunity to reevaluate a number of earthquake histories with timing and patterns that were not well established (e.g., single or several episodes).
[47] The chronologies that were established for the Ein Feshkha and Ze’elim sections combined with that of the Ein Gedi core [Migowski et al., 2004] allow us to compare the recurrence time of the seismites in these sites and to produce an integrated picture for the appearance of seismites in the northern Dead Sea basin (Table 4 and Figure 6). The number of seismites in the Ze’elim Gully sections is significantly smaller than at Ein Feshkha and Ein Gedi for the same time interval. Ken‐Tor et al. [2001a] and Agnon et al. [2006] recognized that the missing seismites at ZA1 (explained in section 1) relate to sedimentary hiatuses in the section. The new section we described at ZA2 yielded an apparently continuous age‐depth profile, and the hiatuses in the ZA1 section can be correlated with clastic‐sandy sequences in the ZA2 section. One of the missing (sedimentary hiatus) earthquakes (in the landward ZA1 section) does appear in the continuous ZA2 section as liquefaction in a sandy unit (correlative to the historical earthquake of 551 A.D.). In two instances the situation is reversed, where two seismites, correlated to 1293 and 1212 A.D. appear in the more landward ZA1 outcrop, and do not appear in the more lakeward ZA2 section. This specific period is characterized by a sandy facies at ZA2 (Figure 4) and detailed detection is also inhibited by difficult access at this part of the section.
[48] The EFE section has 52 seismites, while for the same time period the EG section shows ∼30 seismites. A quiescence period at EFE at around mid‐1st to 3rd century A.D. is concurrent to a period in EG with microscopic seismites (Type III of Migowski et al. [2004]). This could reflect the higher detection resolution of the Ein Gedi study. Despite this resolution difference, the situation is reversed in the pre‐2nd century B.C. period where EFE has 25 seismites (<1 cm to >9 cm) compared to 7 at EG. The recurrence of earthquakes in each one of these sections is illustrated as a cumulative function in Figure 7.
[49] A quiescence at ZA and EG during a period of enhanced seismicity in the north (EFE) at ∼500–150 B.C. (Figure 7) may suggest a period of moderate earthquakes concentrated north of the Dead Sea (i.e., Kalia fault). Additionally, there is a quiescence interval in the seismite archive of the three sites from the end of the 2nd to the middle of the 4th century A.D., which correlates to an historical earthquake quiescence period 127–306 A.D. (Appendix A). This is in line with the low‐seismicity interval during this period along the DST, the high‐seismicity period on the North Anatolian Fault, and the mechanical coupling and alternation of activity of the two faults suggested by Migowski et al. [2004] and Agnon et al. [2006].
[50] The comparison of EFE versus both EG and ZA clearly suggests higher activity in EFE. This can be explained by a difference in sensitivity between the sites, or the proximity of EFE to the Kalia transverse fault bounding the Dead Sea basin from the north (Figure 1). The EFE site is located on the continuation of this fault to the WNW, and has likely recorded local earthquakes of magnitude ∼5.5 that were too far to affect EG and ZA. Also, several seismites (during the time interval of the historical charts) were recorded only at the northern site of Ein Feshkha (e.g., 64 B.C. and 349, 363, 634, 847, 859, 956, 1063, 1170, and 1312 A.D.). Most of these events have destruction documented mainly in the northern Holy Land or further north (Antioch, Tyre, Turkey; see Appendix A), 1312 A.D. being the main exception. Since the work of Russell [1980], the 363 A.D. earthquake is often considered as one that ruptured from the north to the Arava. We suggest that this interpretation congeals two earthquakes, one northern and another southern (see Appendix A). The lack of documentation of earthquakes in the south can reflect bias due to population density, the south being more arid. However, the excess of recorded earthquakes at Ein Feshkha may corroborate higher seismic activity in the north. First let us consider the local setting of the Ein Feshkha Nature Reserve site: it is positioned at the edge of both the Jericho fault and the Kalia transverse fault (Figure 1). Ze’elim Gully, on the other hand, is several tens of kilometers from both Jericho and Arava faults, the likely sources of M > 6.5 events. Therefore, earthquakes rupturing the northern part of the Jericho segment will record at Ein Feshkha but not at the southern sites. Likewise, magnitudes 5.5–6 from the Kalia fault may be recorded locally but not at the southern sites.
[51] Our sites are located on the western shore of the lake, close to the western strand of the transform duplex. This observation may suggest an alternative explanation to the excess of earthquakes in the northern site EFE: The site is close to the Jordan (aka Jericho) fault that might act as a waveguide, a property documented for the plate boundary south and north of the Dead Sea [Haberland et al., 2003; Shtivelman et al., 2005]. Guided earthquake waves have been invoked to explain anomalous accelerations and damage in instrumentally recorded Dead Sea events [Wust‐Bloch, 2002]. The seismite sites in the south (EG, ZA) are farther from the Jordan fault, and disconnected from the Araba/Arava fault. This explanation can be tested by a similar research on the eastern shore: it would predict that the southern sites there will show more frequent events.
[52] In this section we discuss the temporal distribution of seismites that are recorded at all of our sites (intrabasin seismites (IBS)). Eight seismic events are recorded in all three sections, north, center and south. In addition we add to this list the 1927 A.D. instrumentally recorded event that formed seismites at the EG and ZA1 sites for which macroseismic evidence was found along the Jordan River [Avni, 1999] and caused slumping under the Dead Sea waters (interpreted by Niemi and Ben‐Avraham [1994]) near the EFE site. The 1927 A.D. event also produced the most pronounced sedimentary structure (in the ZA Gully) with sand liquefaction reaching >1 m in thickness (Figure 8). In addition, two seismites that were recovered from the Ze’elim and Ein Gedi sections and correlated to the 1458 and 1834/1837 A.D. historical events are not represented in Ein Feshkha since this part of the section is missing. However, we predict that processing of the upper part of the section preserved east of our EFE study site will recover these events. Note that the age of the seismite at ZA2 correlated to 1458 A.D. is above the dated and modeled part of the section and its age is extrapolated from the deposition model (see Figures 4 and 5). Part of this group of IBS seismites (mid‐2nd century and 31 B.C. and 33, 419, 1212, and 1293 A.D.) appears in sedimentary sequences of the lacustrine facies indicating clearly offshore conditions of at least 10–20 m of water above the sediment. Other IBS seismites (551, 749, and 1927 A.D.) were at nearshore conditions (hiatus at ZA1, sand and lacustrine sediments at ZA2, lacustrine sediments at EFE and EG). Thus, we see no clear correlation between lacustrine conditions and the three‐site seismite appearance. This observation is corroborated by the lack of seismites in intervals of the lacustrine section at Ze’elim while they appear in Ein Feshkha and Ein Gedi (e.g., between 830 and 1200 A.D.; see Table 4). The conclusion that we can draw from these observations is that the temporal and spatial appearance of the seismites does not depend strongly on the limnological‐sedimentological conditions. Seismites appear in both sandy facies and clay‐evaporite (marly) sequences. The Ze’elim sections contain prominent sand layers that were clearly affected by earthquakes, producing liquefied structures. Significant earthquakes, such as 1927, do appear in all lithological units. This does not imply that low‐magnitude or remote earthquakes have no effect on sandy layers. The topic clearly requires more investigation. If sediments were deposited in the lake they are affected by the earthquakes whether they comprise sands or marls. Figure 10 indicates that soil liquefaction and lacustrine brecciation have apparently similar thresholds. Hence, the archives we documented provide a reasonable picture of the earthquake activity and its effects in the lake basin, not filtered by the lacustrine environment. This conclusion opens the way for using the seismite spatial and temporal distribution to evaluate basin effects and recurrence patterns.
[53] All seismites in the Dead Sea basin are marked on an epicentral distance versus magnitude diagram along with the field of instrumental earthquake data (Figure 9). This diagram highlights domains of intensity, which is a function of magnitude and distance of epicenter from the recording site. In Figure 9 the intensity lines are plotted according to the equation proposed by Ambraseys and Jackson [1998] (here termed A&J):
Ms = 1.54 + 0.65 Ii + 0.0029 Ri + 2.14 log Ri + 0.32p (1)
where
Ri = (ri2 + 9.72)0.5
ri, in kilometers, is the mean isoseismal radius of intensity I, and p is zero for mean values and one for 84 percentile values. This attenuation relationship is based on 123 instrumentally recorded shallow (depth <26 km) earthquakes from the eastern Mediterranean from a period of 85 years and ∼9000 intensity points. Different coefficients may be more appropriate for the magnitude‐distance field of the earthquakes associated specifically with Dead Sea Rift seismicity. The earthquakes plotted are mainly after the similar diagram by Migowski et al. [2004] and Agnon et al. [2006], where modified input data are explained below and in Appendix A. Each symbol represents a historical earthquake documented in the region, most matched to seismites (open squares), and some matched to seismites at all three sites in the study, the intrabasin seismites (IBS, solid squares). Distances are from the Ein Gedi site, for consistency with previous publications. A field corresponding to earthquakes not matched to seismites is demarcated by the thick gray curves (solid gray curve: earthquakes from historical catalogs; dashed gray curve: instrumentally recorded events). The magnitude‐distance data for each historic earthquake has significant uncertainties (for examples, see Figure 10); however this type of diagram has been shown to be useful [Migowski et al., 2004] for portraying a pattern in the presence of a large sample, barring any systematic bias. Figure 10 depicts only the IBS with estimated uncertainties. Each earthquake shows as a rectangle. We were especially cautious when estimating the upper left corner for each IBS rectangle. This corner, minimum magnitude and maximum distance, corresponds to the minimum intensity at the seismite site, which may be a threshold for intrabasin seismites. The considerations we applied when defining the IBS positions and uncertainties in Figure 10 are given here:
[54] Mid‐2nd century B.C.: Guidoboni et al. [1994] cite one event or more recorded at Antioch (for a summary of historic earthquakes in the region, see Appendix A; for locations of historical cities and towns, see Appendix B). The only traceable historical record for an earthquake comes from the cultural and political center at Antioch, where buildings were reportedly damaged, and Sbeinati et al. [2005] assign local intensity I = VII. For comparison, the 1202 A.D. event was only felt in Antioch, no damage reported [Ambraseys and Melville, 1988; Ambraseys, 2009; Guidoboni and Comastri, 2005]. Therefore if the magnitude of the mid‐2nd century B.C. event is smaller than M7.5 assigned for 1202 A.D., then the source was closer to Antioch and farther from the Dead Sea. Hence for the mid‐2nd century B.C. event we assign an uncertainty rectangle constrained by a bottom left corner coinciding with the 1202 A.D. position. The rectangle represents a range of local intensities spanning V–VII at Antioch, where the distance is calculated to the closer end of the respective rupture (consistent with the magnitude) along the DST. For this specific earthquake we cannot, at present, constrain the top left corner.
[55] 31 B.C.: The magnitudes of 31 B.C. and 749 A.D. are set at 7.2 assuming similarity in rupture length, both reported to have ruptured 110‐km‐long Jordan Valley segment [Reches and Hoexter, 1981]; the sites of damage attributed to the 31 B.C. event demarcate that segment. Ambraseys [2009] points out that 3.5 m dip‐slip displacement reported by Reches and Hoexter [1981] would correspond to an earthquake too large comparing with the historical reports. However, the displacement is measured locally on unconsolidated sediments. Reches and Hoexter [1981] explicitly avoid rejecting the possibility that a part of the slip occurred during several centuries following the event. Moreover they are aware of local complications in the strike of the fault that amplify dip‐slip. Hence we tentatively adopt the identification of the surface rupture with the 31 B.C. event. Gardosh et al. [1990] reevaluated the trench data in light of a newer geomorphic surface faulting study in the Dead Sea area. They conclude that slip accumulation reaches 1.2 m for two events in the past 2000 years on the trench strand. The uncertainty range of the magnitude of this event (Figure 10) is projected from a minimum given by Karcz [2004] and a maximum given by the rupture length discussed here.
[56] 419 A.D.: Damage from this event was reported for Jerusalem and “many cities and towns” and “all great cities” (sources in the works of Russell [1985] and Guidoboni et al. [1994]). Archaeological damage from Antipatris (central Holy Land) has been attributed to this earthquake [Karcz and Kafri, 1978] suggesting a Jordan Valley rupture. We think that it is feasible that the source of this event was similar to that of 1927 A.D. earthquake (see below). We assume a 6 ≤ M ≤ 6.5, with a maximum distance of 50 km.
[57] 551 A.D.: The event was updated to a larger magnitude offshore Lebanon earthquake, as is more widely accepted in the literature (Appendix A). Magnitude estimation is based on sonar imaging of seafloor morphology [Elias et al., 2007] and historical account compilation [Sbeinati et al., 2005].
[58] 749 A.D.: The historical sources are consistent with a rupture event or two in the Jordan Valley (between the Dead Sea and Sea of Galilee). The range of magnitude (M6.6–7.7) in Figure 10 reflects either a single event or a double event with a cumulative rupture of that 110‐km‐long segment (calculated using the results of Wells and Coppersmith [1994], Marco et al. [2003], and Karcz [2004]; see Appendix A).
[59] 1202/1212 A.D.: A single event brecciated the sediments in the EFE section in the early 13th century. Two events are recorded in EG. ZA recorded one or two events. Therefore only one of them is an IBS and the dating cannot rule which. For the 1202 event we use M7.4–7.6 based on historical analysis of Ambraseys and Melville [1988] and Ellenblum et al. [1998]. Paleoseismic and archaeoseismic trenching corroborate these assessments [Ellenblum et al., 1998; Marco et al., 2005; Daeron et al., 2007; Nemer et al., 2008]. The distance of the rupture edge from the farthest seismite site is 165 ± 10 km, based on rupture uncovered in trenching at the northern shore of the Sea of Galilee [Marco et al., 2005]. For the 1212 event, Ambraseys et al. [1994] suggest a rupture south of the Dead Sea or in the Gulf of Eilat (Red Sea). In severity of damage and aftershock occurrence it is seemingly similar to the 1995 modern event [Hofstetter, 2003], or could have been closer to the Dead Sea, according to the high level of damage at Aila and Karak. This similarity prompts us to give a best estimate of 7.2 magnitude and 300 km distance.
[60] 1293 A.D.: Based on evidence at an archeological site built on the Arava segment of the DST, the northern Arava did not rupture during this event [Haynes et al., 2006]. We consider the 12‐km‐long Amatzyahu fault (Figure 1) as the source for this event. This rupture length is consistent with a 6.2–6.7 magnitude earthquake. The maximum intensity recorded for this event was recorded at Karak (eastern Dead Sea), 45 km from the Amatzaya fault [Ambraseys et al., 1994; Guidoboni and Comastri, 2005], consistent with a magnitude of 6.7 according to the A&J equation (equation (1)). Taking into account poor construction and site effects this intensity could be achieved at a somewhat lower magnitude.
[61] 1927 A.D.: This event was recorded instrumentally [Shapira et al., 1993] (M6.2) and its distance uncertainty range is based on the distance from the ZA site to the Kalia transverse fault in the northern Dead Sea (Figure 1). It is also a possible scenario that the main fault of the DST ruptured along a limited length causing the 1927 earthquake.
[62] We have excluded the 33 A.D. IBS event from Figure 10 for lack of reliable historical evidence [see Ambraseys, 2009].
[63] In addition to the IBS magnitude‐distance discussion in this section (above), other modifications (Figure 9) made to the published magnitude‐distance diagrams are explained here. Regarding the 363 A.D. event, our review of the evidence indicates two or more separate earthquakes from ∼362 and 363 A.D., with damage in geographically disparate regions (see Appendix A). Also, symbols were added (in Figure 9) for 331 and 199 B.C. and 835 and 847 A.D. historic earthquakes, which are matched to seismites in this study, but not in previous studies at the Dead Sea basin. For the 331 B.C. event, Sbeinati et al. [2005] give intensity VI in the general region of “Syria.” For this ancient and not well‐covered event only a rough calculation is possible. An isoseismal distance of 70 km is consistent with a M6.5 earthquake using the attenuation relation of A&J. This is a relatively ancient event, population density was low, and a distance of ∼70 km from seismic source to historic source is reasonable. For the 199 B.C. event, assuming the intensities documented are from the same event (VII and VIII in “Syria,” probably Damascus, and Sidon, respectively [Sbeinati et al., 2005]), the magnitude is estimated in the same way to Ms6.8. For 847 A.D. the magnitude is taken from the analysis of Sbeinati et al. [2005]. The 873 and 956 A.D. events [Ambraseys et al., 1994; Guidoboni et al., 1994], matched to seismites in this study, are not on the distance‐magnitude diagram for lack of sufficient information.
[64] Second earthquakes were added at ∼mid‐2nd century B.C. and at 362/363 and 747/749 A.D. The location and magnitude of these added events are not known, each appearing in the diagram as a small circle on the symbol of the previously published single event.
[65] The intrabasin seismites that were recorded in all three sites (EFE, EG, ZA) define a well‐constrained field in the magnitude‐distance diagram, which cuts the A&J intensity lines plotted (Figures 9 and 10). Of the earthquakes matched to seismites on this diagram, 60% occupy the field of intensities larger or equal to IV. Eighty‐nine percent of the IBS seismites occupy the field of intensities larger or equal to V (or 100% if 1202 is chosen over 1212 A.D.; see above discussion), as opposed to 46% of all seismites.
[66] Figures 9 and 10 suggest that farther and stronger earthquakes require lower local intensities for being recorded in the entire basin (IBS). If we accept that 1212 A.D. is the IBS (as opposed to 1202 A.D.) at the beginning of the 13th century then it is the farthest (300 km) with M7 and I = IV. Otherwise the 551 A.D. earthquake and the mid‐2nd century B.C. earthquake are the farthest. The intensity threshold for magnitude 6.2 seems to be VII (419 and 1927 A.D.). A possible explanation for this observation is sensitivity to long‐period waves. The frequency content of the wave train is biased to long periods in earthquakes from large and remote sources. A Ms6 earthquake shows a corner frequency fc ∼ 0.1 Hz (period ∼10 s), whereas Ms7 shows fc ∼ 0.04 (period 25 s) [e.g., Geller, 1976]. Attenuation of the wave during travel, where the waves are damped according to the number of cycles between the source and the site in question, results in further bias toward lower frequencies.
[67] The sensitivity to low frequency may indicate that the critical condition for brecciation may depend on ground velocity rather than ground acceleration, where the frequency equals the ratio of the latter to the former. Heifetz et al. [2005] and Wetzler et al. [2010] suggest a Kelvin‐Helmholtz instability mechanism for the disturbances in the sediments (intraformational folding leading ultimately to brecciation). In this scenario the sediment bed is considered to have a gradient in the horizontal velocity (due to a density decrement). If the duration of the wave cycle is sufficiently long (or the frequency sufficiently low), a disturbance can be sustained: the growth rate of a disturbance must be larger than the driving frequency.
[68] The thick gray curve on Figure 10 represents the farthest epicentral distance of liquefaction of soil caused by modern earthquakes in the Aegean region [Papathanassiou et al., 2005]. Note that if 1202 A.D. is the date of the early 13th century IBS (as opposed to 1212 A.D.) then the threshold for intrabasin seismite genesis is very similar to this soil liquefaction curve.
[69] The average recurrence time of IBS is ∼200 years, which is significantly longer than the ∼50–95 years based on all seismites in the Ein Gedi core during the past 1600 years [Migowski et al., 2004] or ∼50 years at EFE since 525 B.C. The possibility to establish a high‐resolution comparison between distinct sedimentary sections located in different sites of the Dead Sea basin opens the way to further explore the response of the lacustrine system to various sources of seismic activity and thus extends the paleoseismic study to older sections such as those of the last glacial Lake Lisan. Such a comparison is currently under investigation.
[70] 1. This study established for the first time an integrated chronology of spatially distributed paleoearthquakes (seismites) in the late Holocene Dead Sea basin. Radiocarbon chronologies based on Bayesian statistics were constructed for two new stratigraphic sections at the northern and southern parts the basin (at the Ein Feshkha Nature Reserve and at the Ze’elim Gully, respectively). The ages of the seismites were compared with the paleoseismic chronology proposed for the Ein Gedi core [Migowski et al., 2004] located at the central part of the basin and with catalogs of historic earthquakes during the past 2000 years.
[71] 2. Temporal and spatial appearance of the seismites shows no strong dependency on the limnological–sedimentological conditions in the specific sections (representing lake conditions of up to several tens of meters depth). Sediments of various sedimentary facies were affected simultaneously by the earthquake’s activity (e.g., liquefied sands and disturbed lacustrine marly sequences). Thus, the documented records provide a reasonable picture of the earthquake activity in the vicinity of the Dead Sea basin without being filtered by the sedimentary environment.
[72] 3. Several seismites (1927, 1293, 1202/1212, 749, 551, 419, and 33 A.D. and 31 and mid‐2nd century B.C.) were recorded in all three stratigraphic sections (termed IBS). The recurrence interval of the IBS during the period of continuous deposition is ∼200 years. Compiling the IBS record filters the shorter recurrence intervals of the individual records.
[73] 4. Several seismites (during the time interval of the historical catalogs) were recorded only at the northern site of Ein Feshkha (64 B.C. and 349, 363, 634, 847, 859, 956, 1063, 1170, and 1312 A.D.) This may be due to the northern source of these events or to wave guiding along the main plate boundary.
[74] 5. Quiescence intervals in seismite appearance are apparent at ∼500–150 B.C. at the two southern sites and from the end of the 2nd to the beginning of the 4th century A.D. at all three seismite sites. These are correlative to historical earthquake quiescence periods and suggest similar intensity thresholds for both types of data sets in this region.
[75] 6. The IBS define a steep diagonal array in the magnitude‐distance diagram that lies in the sector of high‐intensity lines that were established by Ambraseys and Jackson [1998]. This is similar to the soil liquefaction threshold calculated for modern earthquakes in the Aegean region. Thus, the IBS provide a pattern of temporal behavior of relatively strong earthquakes that are associated with the Dead Sea Transform.
[76] Historical documentation is mostly reliable in the last two millennia. Some archeological and paleoseismic evi- dence for the events is given in the footnotes. A location map of many of the sites mentioned in Table A1 is given in Appendix B.
[77] Figure B1 provides a map of historical locations mentioned in the manuscript and in Appendix A, based on Google Earth (http://www.google.com/earth/index.html), Guidoboni and Comastri [2005], Guidoboni et al. [1994], and Ambraseys [2009].
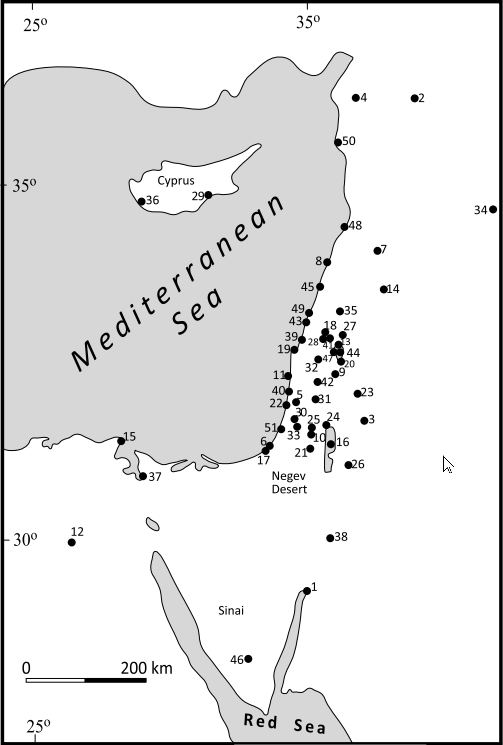
Key to map numbers; modern location names are given in parentheses:
- Aila (Aqaba)
- Aleppo (Halab)
- Amman (Philadelphia)
- Antioch
- Antipatris (Tel Afek)
- Asclon (Ashkelon)
- Baalbek
- Beirut
- Bet Shean
- Bethlehem
- Caesarea
- Cairo
- Capernaum
- Damascus
- Damietta
- Dead Sea
- Gaza
- Gush Halav–Jish
- Haifa
- Hamat Gader
- Hebron
- Jaffa
- Jerash
- Jericho
- Jerusalem
- Karak
- Kasrin (Qatzrin)
- Khirbet Shema
- Kition (Larnaca)
- Lydda (Lod) (Ramla is adjacent to Lydda)
- Nablus
- Nazareth
- Nicopolis (Imwas‐Latrun)
- Palmyra (Tudmor)
- Paneas (Banyias)
- Paphos
- Pelusium
- Petra
- Ptolemais (Acre‐Akka‐Akko)
- Qaqun (Netanya)
- Safed
- Samaria
- Scandelion (Iskandarouna)
- Sea of Galilee
- Sidon
- St. Catherine monastery (Sinai)
- Tiberias
- Tripoli
- Tyre (Sur)
- Ugarit
- Yavne
click on image to open in a new tab
Kagan et al. (2011)
[78] An earthquake at this time has been linked historically to the prophecy by Amos of Teko’a mentioned numerous times in the bible (e.g., Amos 1:1, dated to 760 B.C.). In the rigorous historical work by Guidoboni et al. [1994] this event is considered the “only Biblical earthquake with sound and direct historical evidence.” Previous discussions in the literature regarding the occurrence of one or two earthquakes [Austin et al., 2000] can now be resolved by the paleoseismic evidence here. The Ein Feshkha (EFE), Ein Gedi (EG), and Ze’elim (ZA2) seismite records show two seismites at around this time. At EG the two seismites are separated by 4 cm while at ZA2 by 10 cm, and at EFE by 6 cm, which is comparable to a few decades.
[79] The apparent southward decrease in extent of damage at archeological sites in the region led Austin et al. [2000] to suggest an epicenter in Lebanon with local magnitude estimated at about 8. They argued that the recurrence interval of earthquakes during historical times was around a century and merged all damage observed in 8th century B.C. sites to one event. This argument has no basis in fact since there is a plentitude of evidence for couplets of earthquakes, for example the 1202 and 1212 A.D. [Guidoboni et al., 1994; Amiran et al., 1994; Guidoboni and Comastri, 2005]. Paleoseismological as well as historical evidence summarized by Agnon et al. [2006, Figure 13] points to recurrence intervals of 50–73 years for the period of 1000–1800 A.D. Archaeological evidence of events is abundant throughout the area (see map of Austin et al. [2000, Figure 1]). Additional support of two events includes studies at Megiddo archeological site [Marco et al., 2006] also show two deformation events, one postdating 800 B.C. and the other postdating 700 B.C. The archeological dating of the strongest evidence for shaking has a resolution of approximately 100 years, so it could correlate with the Dead Sea seismites. Paleoseismic trenches at the Tel Rehov archeological site near Bet She’an revealed a fault scarp created by two seismic events, one in the 7th and 6th century B.C. [Zilberman et al., 2004]. Our results, in addition to those of other paleoseismological and archaeological studies, support two earthquakes during the mid‐8th century B.C.
Observations of intraclast breccia layers in the Dead Sea basin, formerly termed "mixed layers," provide an exceptionally long and detailed record of past earthquakes and define a frontier of paleoseismic research. Multiple studies of these seismites have advanced our understanding of the earthquake history of the Dead Sea and of the processes that form the intraclast breccias. In this paper, we describe a systematic study of intraclast breccia layers in laminated sequences.
The relationship of intraclast breccia layers to intraformational fault scarps has motivated the investigation of these seismites. Geophysical evidence shows that the faults extend into the subsurface, supporting their potential association with strong earthquakes.
We define field criteria for the recognition of intraclast breccias, focusing on features diagnostic of a seismic origin. The field criteria stem from our understanding of the mechanisms of breccia formation, which include ground acceleration, shearing, liquefaction, water escape, fluidization, and resuspension of the originally laminated mud.
Comparison between a dated record of breccia layer and the record of historical earthquakes provides an independent test for a seismic origin. The historical dating is significantly more precise and accurate than the radiocarbon dating of breccia layers. Yet, assuming that the lamination of the sediments shows an annual cycle, the precision of counting laminae may approach the precision of the historical record. A similar accuracy is then expected for the intervals between earthquakes. We review our work based on counting laminae representing the historical period, mutually corroborating the seismic origin and the annual lamination.
The correlation of documented historical earthquakes with individual breccia layers provides quantitative estimates for the threshold of ground motion for breccia formation in terms of earthquake magnitude and epicentral distance.
The investigation of breccia layers and the associated historical earthquakes has underscored cases in which a breccia layer represents a pair of earthquakes. We consider the resolution of individual events in records of breccia layers. A thick breccia layer can account for multiple events, biasing the paleoseismic record. The resolution of an interseismic time interval is no better than the ratio between the thickness of a breccia layer and the rate of sedimentation.
We use revised age data for the Lisan Formation and reassess temporal clustering of earthquakes during the late Pleistocene. The variation of recurrence interval corroborates significant clustering. During periods of clustered earthquakes, of order of 1000-5000 yr, the interseismic interval becomes short, and the resolution diminishes, so the peak rate of recurrence may be underestimated.
Recurrence intervals inferred from the Dead Sea record of Holocene breccia layers do not feature the extreme variation encountered in the late Pleistocene record. Yet the Holocene record shows marked transitions between periods, each with relatively uniform recurrence interval. Two of the transitions are contemporaneous with transitions in the recurrence intervals of the Anatolian faults, implying broad-scale elastic coupling.
The young discipline of paleoseismology applies geological methods to two aspects of destructive earthquakes: geological faults as earthquake sources and the recognition of geological evidence of strong ground shaking (McCalpin, 1996; Yeats et al., 1997). Earthquake sources are studied by on-fault investigations, typically excavating trenches across and along fault traces and analyzing geomorphology controlled by the fault zone. Ground shaking studies, not necessarily conducted on fault traces, are based on analyzing liquefied sands, landslides, slumps, rock-falls, and sediments deposited in water bodies (Obermeier, 1996). Rock-falls inside caves, associated with damage and growth of speleothemes, can be dated precisely by U-Th analysis of these cave deposits (Kagan et al., 2005). Water waves generated by earthquakes (tsunami and seiche) can disrupt sedimentary structures at considerable distances from the earthquake source (Cita et al., 1996; Kastens and Cita, 1981), and lacustrine seiche waves can produce slump deposits that preserve a record of past earthquakes (Chapron et al., 1999; Siegenthaler et al., 1987). While such sediments can offer evidence for past earthquakes, the disruption might also be attributed to nonseismic processes that involve high mechanical energies (e.g., Li et al., 1996). In this paper, we present recent advances in off-fault paleoseismological studies related to our ongoing research of Dead Sea sediments.
Faulted sediments in the Dead Sea basin have long been used to locate the Sinai-Arabia plate boundary (Garfunkel et al., 1981; Neev and Emery, 1967; Zak and R. Freund, 1966) and related secondary fault traces (Agnon, 1982, 1983; Bowman, 1995; Gardosh et al., 1990) (Fig. 1). A pioneering paleoseismic study of the Jericho fault trace near the Dead Sea constrained recent activity and related surface ruptures to the historical earthquakes of 31 B.C. and 749 A.D. (Reches and Hoexter, 1981, Gardosh et al., 1990). More recent paleoseismic studies outside the Dead Sea basin have added information related to the long-term behavior (Amit et al., 2002) and its slip rate for the past two millennia (Klinger et al., 2000; Meghraoui et al., 2003; Niemi et al., 2001). A unique collaboration of archaeology, history, and geology has resolved individual slip events with considerable accuracy on the Jordan Gorge segment of the Dead Sea fault (Ellenblum et al., 1998), and further studies of offset stream channels have defined a lower bound for the long-term slip rate of 3 mm/yr (Marco et al., 2005). A variety of indicators give a similar value for the Arava Valley (Fig. 1), south of the Dead Sea (Avni et al., 2000; Klinger et al., 2000). A 2000-year-old aqueduct in Syria (350 km north of the Dead Sea) is displaced 14 m, yielding a maximum slip rate of 7 mm/yr (Meghraoui et al., 2003).
The past decade has brought a surge of paleoseismic studies in the Dead Sea basin. Active fault traces have been identified as much as 3 km away from the proposed location of the master faults (Fig. 1) (Bartov, 1999; Gluck, 2001). This corroborates earlier findings by Agnon (1982, 1983) expanded by Gardosh et al. (1990). Seismic potential of main faults was also established by studying sedimentary structures away from fault traces. Liquefied sands and convoluted beds indicative of earthquake shaking (seismites) have been reported in several locations (Bartov, 1999; Bowman et al., 2000; Enzel et al., 2000; Ken-Tor et al., 2001a). Along with these earthquake-related sedimentary structures, another kind of seismites unique to laminated sediments has been recognized: intraclast breccias (previously termed "mixed layers") that punctuate sequences of uniformly laminated late Quaternary lacustrine sediments (Marco and Agnon, 1995). Intraclast breccias formed by earthquake shaking have been reported from elsewhere (e.g., Davenport and Ringrose, 1987), and in places convincingly related to earthquakes (Doig, 1991).
Expansive outcrops of late Quaternary sediments in the Dead Sea region establish direct links between on-fault and off-fault observations. Intraclast breccias derived from laminated chalks in the Dead Sea basin are associated with surface faulting, which provides a stratigraphic test for temporal relationships between homogenization of the laminated sediment and surface faulting (Marco and Agnon, 2005). Moreover, the Dead Sea sediments are radiometrically datable (Haase-Schramm et al., 2004; Stein and Goldstein, this volume), and independent historical evidence for earthquakes is abundant (Ambraseys et al., 1994; Amiran et al., 1994; Guidoboni, 1994). Therefore, the Dead Sea intraclast breccias hold promise for a deeper understanding of soft-sediment deformation, earthquake shaking, and the seismotectonics of the Dead Sea fault, a model continental transform (Freund, 1965; Garfunkel, 1981; Quennell, 1956; Wilson, 1965).
Spectacular examples of convoluted sediments in the laminar Lisan Formation in the Dead Sea basin have attracted the attention of sedimentologists and overshadowed the less remarkable intraclast breccias. Early works ascribed the convoluted bedding to decollement structures, implying contortion at some finite depth in the sediment (Pettijohn et al., 1987). El-Isa and Mustafa (1986) postulated that the structures formed when the deformed sedimentary layer was at the lakebed. These authors pioneered attempts to extract quantitative information on earthquake return intervals from the stratigraphic distribution of convoluted beds in a section of the Lisan Formation. Slump structures identified in a seismic reflection survey at the Jordan delta were attributed to the 1927 A.D. earthquake (Niemi and Ben-Avraham, 1994). Uncertainty regarding the burial depth of the sediment and the source of energy for deforming the soft sediments have hindered the use of these sedimentary structures to decipher the Late Quaternary seismicity in the Dead Sea.
The discovery of syndepositional faults juxtaposed to intraclast breccias in the Dead Sea basin (Marco and Agnon, 1995) created an opportunity to constrain the lake bottom conditions during homogenization of the originally laminated sediment. During the decade since the recognition of fault-related intraclast breccias, we have established a hypothesis that such layers are seismites; i.e., layers recording seismically-triggered deformation. Our investigation includes a direct correlation of intraclast breccia with synsedimentary faults, the temporal correlation with historical earthquakes, laboratory experiments, and mechanical analyses. Here we review our geological studies related to the original work and present additional results.
The following terms have been used in the literature to describe various types of deformed unconsolidated sedimentary layers associated with earthquakes:
- mixed layers (Marco and Agnon, 1995; Marco et al., 1996b): this term may cause confusion with a number of unrelated uses in the earth sciences;
- mixtites (Jackson and Bates, 1997): this term describes any clastic layer regardless of composition or origin; any flood deposit may fall in this category;
- homogenites (Kastens and Cita, 1981): the term stresses uniform composition of the deposit, yet does not account for systematic variations across the layer;
- seismites (Seilacher, 1969): this term is interpretative; and
- intraclast breccias (Marco and Agnon, 2005): we use this descriptive term to separate observations from interpretations: "intraclast" refers to the origin of the clasts being reworked from within the sedimentary section (Jackson and Bates, 1997), and "breccia" refers to the texture of the deposit.
Intraclast breccias are distinctive in sequences that are otherwise well-bedded or, better yet, laminated. Lamination is typical in the lacustrine facies of the Dead Sea deposits and makes recognition of intraclast breccias practical because of the conspicuous alternation between chemically precipitated white aragonite and darker detritus (Fig. 2) (Katz et al., 1977).
In the present context, intraclast breccias within a laminated sequence can be distinguished by the following criteria:
- The primary mineralogical composition of an intraclast breccia is identical to the underlying strata (and typically the overlying layers also). Thus, the intraclast breccia appears similar to the enclosing deposits. The absence of fine-scale lamination observed from a short distance helps to recognize the intraclast breccia in the field.
- Fragments of laminae may vary in distributions of size. Tabular fragments of competent laminae (with the long dimension commonly 1-5 mm) float in a fine-grained matrix. Graded bedding is common, either fining or coarsening upward.
- Intraclast breccia layers are typically several centimeters thick, but can be as thin as a few laminae (viewed under a microscope; cf. Fig. 2B).
- The upper contact of an intraclast breccia is invariably sharp and is typically overlain by laminated beds.
- Basal contacts can be gradual, but occasionally are sharp. In the former case, folded and torn packets of laminae are abundant (Figs. 2A, 2C).
- The verified lateral extent of individual intraclast breccias is on the order of 100 m. Over lateral distances of several tens of meters, the layers vary little in thickness, except where they onlap local paleorelief that formed during earthquakes (Fig. 3).
- geological setting,
- extent of the deformed units,
- absence of evidence indicating other potential trigger mechanisms, and
- presence of evidence of other potential trigger mechanisms elsewhere in the stratigraphic section associated with undeformed sediment.
The Dead Sea intraclast breccias have many similarities to seismites described from the lacustrine environment as well as from glacial deposits and volcanic terrains. Breccia layers associated with microfaults and intraformational folds in glacial deposits were reported in Scotland (Davenport and Ringrose, 1987). Earthquake-induced soft sediment deformation in Late Pleistocene lacustrine beds associated with activity at the Narugo Volcano, Japan, has been reported by Jones and Omoto (2000), who suggest the above-mentioned criteria to identify seismic triggering agents.
Most of the paleoseismic studies focus on Pleistocene to Recent deposits, but seismites have been reported in significantly older rocks, including Silurian strata (Kahle, 2002) and laminated Neogene deposits in Spain (Rodriguez-Pascua et al., 2003). In the area of the Dead Sea Rift, intraclast breccia layers are also present in Senonian chert (Mishash Formation), which crops out near the Lisan Formation (Fig. 2B). Similar fabrics in the breccias in these formations prompted Kolodny et al. (2005) to suggest a similar mechanism of formation.
Interpreting the origin of ancient seismites often relies on intuition and on understanding models of the mechanism of their formation. Features interpreted as ancient seismites should resemble those formed by modern earthquake deformation. Soft sediment deformation associated with strong earthquakes is documented by observations of recent seismic events (Allen, 1974; Sims, 1973). Earthquakes have caused silting and resuspension of sediments in Canadian lakes in association with earthquakes and in turbid water observed in lakes <10 km from the epicenter of the 1935 Temiskaming, Canada, M 6.3 earthquake (Doig, 1990, 1991). Piston cores from the bottom of that lake recovered a 20-cm-thick chaotic layer composed of tabular fragments derived from a preexisting silt layer. Graded bedding has been suggested as a criterion for subaqueous liquefaction based on observations in Kobe, Japan, following the 1995 earthquake (Kitamura et al., 2002).
Earthquake-induced historical homogenites are reported in Lake Lucerne, Switzerland (Siegenthaler et al., 1987). Lake Le Bourget, France, has homogenites that correlate with the A.D. 1822 earthquake (local intensity VII-VIII), the strongest known historical earthquake of the French outer Alps (Chapron et al., 1999). Historical accounts of this earthquake report violent lake water oscillations, which were probably a seiche, and an earthquake-induced subaqueous slide may have formed the homogenite layer.
The formation of intraclast breccias involves five stages (Fig. 3). First, layered deposits at the lakebed (Fig. 3A) are disrupted and deformed by ground shaking, motion of the water column, and water escape from the underlying uncompacted sediment (Fig. 3B). During this stage, the pressure of pore fluids in the sediment exceeds the confining pressure of the overlying lake brine, resulting in liquefaction of the sediment. Subsequently, the top of the sedimentary succession becomes fluidized and suspended at the bottom of the water body; fault ruptures can create topographic steps at the lake bottom (Fig. 3C). Seismic waves can trigger mechanical instability in the sediment, expelling pore fluid into the overlying suspension (Hamiel, 1999; Heifetz et al., 2005). Long water waves that oscillate the entire lake (seiche) carry significant momentum at the bottom of the lake, keeping the sediment suspended. After the waves have dispersed and attenuated, an intraclast breccia is deposited from the suspension by grain settling and water escape (Fig. 3D). After settling, the intraclast breccia is capped by the continuing deposition of laminated sediments that gradually bury any fault-related topography (Fig. 3E).
The intraclast breccia's texture attests to the interplay between forces in the sediment; namely, the pressure of the pore fluids, the contact forces between solid particles, and gravity. The clasts were originally part of laminae, and rupture of the laminae is a precursor of a liquefied state, where pore pressure exceeds cohesive forces and drives cracks through the sediment. As long as the pore pressure exceeds the lake pressure head, fluids that escape the liquefied bed exert drag stress on particles in the top part of the layer. When this drag exceeds gravitational forces, particles are suspended and the sediment is fluidized.
The formation energy of seismites in general is supplied by seismic shaking, but gravitational energy contributes on slopes, where the disturbed bed slides downhill, expending potential energy. Gravitational energy can also contribute to the formation of seismites where the density profile of the undisturbed sediment is inverted (dense on top): overturning the sediment releases the gravitational potential for overcoming resistance. There is no evidence that gravitational energy was a factor in the formation of common Dead Sea intraclast breccias. The seismites were deposited on flat surfaces, and no evidence for density inversion was found. Some gravitational energy is involved when pore fluid is injected upward, but most of the formation energy is of seismic origin. Three agents of seismic energy for disruption can be considered: the shaking of the ground below, the motion of the water above, and the injection of pore water from below.
Fragments of laminae in upward-fining intraclast breccias indicate that the lake-bottom sediment was compacted and cohesive before the earthquake. During the event, laminae shattered, and fragments were suspended into the fluid. Liquefaction of sediments under earthquake shaking is well documented and is traditionally related to the passage of shear waves (e.g., Allen, 1982). Yet observations of liquefaction features from recent large earthquakes highlight the role of P-waves (Lin, 1997), and engineering design based on resistance to cyclic shear loading has occasionally failed (Hatanaka et al., 1997). Observations of intraclast breccias in the Dead Sea basin have stimulated new theoretical and experimental studies of liquefaction (Bachrach et al., 2001; Hamiel, 1999; Lioubashevski et al., 1996).
An alternative mechanism is the Kelvin-Helmholtz Instability (KHI) mechanism, in which stably stratified layers undergo a shear instability during relative sliding, which is set off by earthquake shaking (Heifetz et al., 2005). Analysis suggests a threshold for ground acceleration increasing with the thickness of the folded layers. The maximum thickness of folded layers, on the order of decimeters, corresponds to ground accelerations of up to 1 g. The application of the KHI model to earthquakes is based on a translation of the instrumentally measurable ground accelerations to pressure gradients. The KHI model is at a preliminary stage and does not provide precise correspondence between field observations and the actual driving ground accelerations. Moreover, it does not rule out alternative sources for pressure gradients, such as surface and internal waves in the depositing water body. Since water depth of Lake Lisan above the investigated area was several tens of meters (Bartov et al., 2002), ground acceleration waves might have dominated over water waves.
Several authors have cited criteria to distinguish between the seismic and nonseismic origin of soft sediment deformation features (for reviews, see Jones and Omoto, 2000; Obermeier, 1996). Marco and Agnon's (1995) studies of seismites were originally motivated by intraclast breccias juxtaposed to intraformational faults in the vicinity of Masada (Fig. 1), where a terrace capped by laminated sediments is present between the Dead Sea and the western fault escarpment (Agnon, 1983; Sagy et al., 2003). Similar exposures of fault zones juxtaposed to intraclast breccias are also present in the Lisan Peninsula. Analysis of the microstratigraphy at these sites shows simultaneity between two processes acting at the lake bottom; namely, faulting and homogenization of the lake bed (Marco and Agnon, 1995, 2005). The time interval between intraclast breccia formation and lake bottom faulting is shorter than the time it took to deposit a lamina, which is likely less than one year (see evidence below for varve-like lamination). This association is perhaps the strongest evidence for attributing datable sedimentary structures to earthquakes, hence naming them seismites. The geological observation that deformation occurred at the water-sediment interface makes intraclast breccias excellent markers to determine the times of past earthquakes, if the time of sedimentation can be determined.
The Masada fault zone has repeatedly ruptured the surface along several km (Fig. 1). In order to examine the subsurface continuity of the faults, Marco et al. (1996a) carried out ground penetrating radar (GPR) and high-resolution seismic reflection surveys to image the fault zone (Figs. 4-7).
The 275-m-long GPR survey shows fault planes extending several meters below the surface (Fig. 5). A parallel calibration profile runs at the top surface of the Lisan Formation above a buried fault whose location and dip are known from exposures (Fig. 4).
The 450-m-long seismic reflection line across the Masada fault zone overlaps the GPR profile but extends farther east and west (Fig. 6). In addition to conventional reflection data, we present diffraction data analyzed using the method proposed by Landa et al. (1987) and Kanasewich and Phadke (1988). The diffracted waves are sensitive to the discontinuities in beds due to faulting, providing an independent support for the interpretation of the reflection profile.
Three zones of discontinuous reflectors on the processed profile represent faults that extend from <0.05 s down to 0.25 s (two-way traveltime [TWTT]) at shot points 50-60, 80-95, and 125-135. The faults are also the sources of diffractions that are shown in the diffraction section from 0.05 s to 0.15 s (TWTT) at shot points ~60, 95, and 125-135 (Fig. 6).
The coincidence of the faults in the geological, radar, and seismic reflection sections shows that every outcropping fault can be traced down to ~250-300 m (Fig. 7). Eyal et al. (2002) reported similar results in another study of a fault zone in an alluvial fan. Several faults evident in the seismic section are not expressed in outcrops, which may be evidence for syndepositional faulting, or alternatively, faults that did not rupture the surface.
Based on correlations with historical earthquakes, Migowski et al. (2004) concluded that local intensity is a critical factor in the formation of intraclast breccia layers. We review this work below and define the conditions required to form intraclast breccias.
The Dead Sea region has not experienced strong earthquakes during the instrumentally recorded twentieth century (Fig. 1). Therefore, to assess the intensity required to brecciate laminated sediments, we must rely on historical records of earthquakes. The Dead Sea region has a long, rich record of historical earthquakes, which consists of information on shaking in settlements nearby (Ambraseys et al., 1994; Amiran et al., 1994; Guidoboni, 1994). Recent retreat of the Dead Sea shorelines has exposed sediments deposited in the past millennia, where the effects of known historical earthquakes can be seen in the sediments. Exposures revealing historical deposits are limited to where the lake level was higher than the level during the past decade. Even for these intervals, the sediments may lack fine bedding or may have been eroded during times of low water levels. Drill cores in lacustrine laminated facies overcome these limitations.
Another analysis, which considers both the thickness of the breccia beds and the lithology of beds directly overlying them, is applied in order to identify the stronger (M > 7) earthquakes within the record recovered from the Lisan Formation (Begin et al., 2005). The analysis is based on the occurrence of gypsum immediately above 11 breccia layers between 54 and 16 ka, a coincidence that is explained by the triggering of a strong seiche, which mixed the stratified waters of Lake Lisan. Mixing of the sulfate-rich upper water layer with the calcium-rich lower water layer could trigger the deposition of gypsum (Stein et al., 1997a). The resulting time series of earthquake recurrence interval is similar to the M ≥ 7.2 recurrence interval in the Dead Sea basin, as extrapolated from present seismicity; therefore, Begin et al. (2005) suggest that the present seismic regime in the Dead Sea basin, as reflected in its magnitude-frequency relationship, has been stationary for the past ~40 k.y.
Ken-Tor et al. (2001a) studied Holocene outcrops of Dead Sea sediments in Ze'elim fan, east of Masada (Fig. 1), where eight late Holocene seismites are exposed due to the accelerated recess of the Dead Sea during the past decades (Fig. 8). Six intraclast breccia layers (A-F) are identified in the lacustrine laminated facies. The uppermost part of the section exposes only the near-shore sandy facies, showing two liquefied sand units (G and H). Some intraclast breccias in the lower section grade laterally into liquefied beds showing flame structures as these beds change facies into beach sands. Twenty-four radiocarbon ages of plant debris are largely consistent with the stratigraphic order in the section sampled. Ken-Tor et al. (2001a) were able to fit a model of moderately varying deposition rates (3-9 mm/yr) between hiatuses by assuming that all intraclast breccias were formed during historically recorded earthquakes (Fig. 8). Significant uncertainty remained only regarding event D (~4 m above the base of the section, Fig. 8) that could correspond to either of two historical earthquakes: 363 or 419 A.D. Ken-Tor et al. (2001a) have considered both events (compare their Figures 3 and 4).
By combining radiocarbon dating with the precise dates of historical earthquakes and with field evidence suggesting subaerial exposures, Ken-Tor et al. (2001a) determined that two unconformities exist in the section between 400 (or 420) and 1200 A.D., and between 1300 and 1750 A.D. (Fig. 9). This interpretation is remarkable in that the eight major historical earthquakes that are missing from the Ze'elim fan section have all happened during the hiatuses thus dated (551, 559, 749, 1033, 1068, 1160, 1456, 1546 A.D.). This suggests that the Ze'elim earthquake record is complete for the periods of deposition, with the exception of either 363 or 419 A.D., for which only a single intraclast breccia is found. We return to this dilemma after reanalyzing the outcrop data, and again after presenting the results from drill cores.
Subsequently, Ken-Tor et al. (2001b) used the historical earthquakes to refine calibration of their radiocarbon dates and to infer that the time between death of the plant and burial in the sediment is 50 yr or less.
Figure 8 offers a revised correlation scheme between the Ze'elim stratigraphic record and the historical earthquake record that satisfies two conditions:
- All model dates match event horizons with historical earthquakes.
- A uniform sedimentation rate between successive event horizons and a slowly varying sedimentation rate between hiatuses. This allows interpolation between event horizons and determination of ages based on historical dates exceeding the precision of radiocarbon.
Our model indicates a strikingly uniform mean sedimentation rate during the three periods of continuous sedimentation: 5-6 mm/yr. Where data is ample, we note that the deposition rate may fluctuate by 50% around that mean rate: at the short period before the Christian era (between the events of 140 and 31 B.C.), we see an anomalously high rate of deposition (7 mm/yr). Subsequently, between 31 B.C. and 33 A.D., the rate declines to 3 mm/yr, maintaining an average of ~5 mm/yr.
This uniform deposition rate model results in breccia layer A in the section of Ken-Tor et al. (2001a) correlating with the 140 B.C. earthquake. The 64 B.C. earthquake, which was originally correlated with breccia layer A, cannot be distinguished from the 31 B.C. breccia layer. We prefer this correlation to the correlation of breccia layer A with the 64 B.C. earthquake because the latter correlation implies an excessive deposition rate of 24 mm/yr.
Our model correlates breccia layer D with the 419 A.D. earthquake, noting that this results in the 363 A.D. earthquake being uncorrelated. Our reconstruction agrees with lamina counting data (Migowski et al., 2004) reviewed in the next section.
Continuous cores from three sites along the Dead Sea shore were drilled during the fall of 1997 (Migowski et al., 2004), including cores from Ze'elim fan and Ein Gedi Spa (Fig. 1). The staggered-pair drilling technique recovered a continuous record of the subsurface sediments. We chose the Ze'elim fan site to correlate subsurface strata with the outcrops (Ken-Tor et al., 2001a, 2001b) and verify that both surface and drill core methods agree. The two other boreholes were drilled very close to the contemporary shoreline to avoid hiatuses due to lake level drops beyond the current level (Bookman et al., 2004) and to obtain data from very recent sediments. The 20-m-long Ein-Gedi core provides a continuous sedimentation record that spans the past 10,000 yr (Migowski et al., 2004). Above a 10 ka salt layer, the core contains two alternating principal facies: laminated fine-grained chalk (laminites) and bedded to massive silt. The laminated chalk contains aragonite laminae, resembling the lacustrine facies of Lisan Formation (Bartov et al., this volume).
The Ein Gedi core has penetrated 53 deformed intervals (Migowski et al., 2004, their Table 2). Many of the 53 deformed intervals in the core resemble the intraclast breccia beds of Marco and Agnon (1995). Migowski et al. (2004) focused on a 2.25-m-long interval of aragonite-rich laminites for a detailed inspection under an optical microscope. They counted couplets of detritus and chemically precipitated laminae as single depositional cycles. In some cycles, laminae of gypsum added to form triplets. They identified 1500 deposition cycles and suggested that a cycle represented one year of sedimentation. One way to test the annual depositional cycle hypothesis is to evaluate the lamina chronology with intraclast breccia events to see whether the time intervals match the historical record. Within that microscopically analyzed interval, Migowski et al. (2004) found 22 intraclast breccia layers and developed a chronological model for the sequence in which each cycle represents one year.
Migowski et al. (2004) constrained their chronological model to minimize the number of breccia beds for which no historical earthquake is known and found only one model that matched as many as 20 out of 22 breccia layers with historical earthquakes since ca. 150 B.C. (e.g., Fig. 10). They found that four additional earthquakes correspond to periods in which the record was destroyed by brecciation associated with subsequent earthquakes, postdating the missing events by several years (and, in a single case, by 33 yr). Figure 10 shows a unique situation where the contact between two breccia layers is preserved, so two earthquakes separated by 10 yr may be resolved.
The chosen matching, leaving out two subcentimeter breccia layers at 90 A.D. and 175 A.D., is significantly better than any other chronology model. The chosen model also minimizes the number of historical earthquakes for which no disturbance is shown in the sediment: six historical earthquakes from the entire region are missing. Clearly, some of these missing historical earthquakes were too distant or too weak to generate significant shaking in Ein Gedi.
While direct historic information on local shaking intensity at Ein Gedi is rare, empirical formulas can evaluate the historic data and estimate the magnitude of a given earthquake, as well as its location (Ambraseys, 1988). In a recent compilation of Middle East intensity data, Ambraseys and Jackson (1998) develop a formula that relates mean earthquake magnitudes to the intensity of shaking at given source distances:
M = -1.74 + 0.66I + 0.0015R + 2.26 log R, (1)where R is the distance from the earthquake focus (assumed at 7.4 km depth), I is the local intensity, and M is the magnitude. Formulas of this form, known as attenuation relations, estimate the local intensity at a site if both the earthquake magnitude and its location are known. A sufficiently close earthquake source with sufficiently large magnitude should generate intraclast breccia layers; sources that are too weak or too distant would not generate intraclast breccia layers. Figure 11 shows a compilation of all historical and instrumental earthquake sources in terms of magnitude and distance from Ein Gedi. The diagonal bold curves separate three domains: strong and close sources on the lower right, all matched with breccia layers; weak and far sources on the upper left, all unmatched; a median domain where about half of the events are matched by intraclast breccia layers. These lines can be fitted to equations of the form of equation (1). The straight line is given by:
M = 1.9 log R + 2.8. (2)The dotted and dashed lines in Figure 11 mark intensities V and VI, respectively. Note that for distances R > 50 km and magnitudes M > 5.5, we can consider the isoseismal I = V as a domain boundary. At lower distances and magnitudes, a higher intensity seems to be required for generating breccia layers.
As shown in Figure 11, all historical earthquakes with calculated local intensity at Ein Gedi I > V are matched with intraclast breccia. The earthquake of 363 A.D. may constitute an exception to that rule.
The unique match of the two independent records, namely the historical and the one derived from the core, supports three assumptions used to develop the chronological model:
- breccia layers form by seismic shaking,
- strong shaking results in breccia layers, and
- the lamination is seasonal with a detectable annual cycle.
Different paleoseismic and historic studies have indicated different recurrence intervals ranging from a century (Amiran et al., 1994) to ten millennia (Kagan et al., 2005). In some cases, the discrepancy is attributed to the threshold for detection (see Kagan et al., 2005); in others, the discrepancy may arise from the different time window studied (see Ken-Tor et al., 2001a, 2001b). The variation of recurrence interval with time is a manifestation of clustering (Marco et al., 1996b), and it can arise from the complex mechanics of the fault system (Lyakhovsky et al., 2001). Here we consider the influence of the rate of deposition on the resolution of events and discuss the effect of resolution on the apparent recurrence patterns.
Sedimentation rate influences the ability to detect individual events in the paleoseismic record. Migowski et al. (2004) discussed the "masking" of an earthquake by a subsequent earthquake as inferred for the Ein Gedi core, and Figure 8 shows possible examples from the Ze'elim outcrop (the pairs of 64-31 B.C. and 1202-1212 A.D.). Figure 10 shows how the breccia layers associated with the 1202 and 1212 A.D. pair are barely resolved from each other in the Ein Gedi core (Migowski et al., 2004).
The temporal resolution (Tres) of individual earthquakes in well-stratified lacustrine deposits depends on the rate of sedimentation, Rs, and the thickness of the breccia formed by the subsequent earthquake, Hb. The resolution limit for an individual earthquake is the critical time interval that can be resolved in a record:
Tres = Hb / Rs (3)Equation (3) defines the resolution of a breccia layer with regard to its predecessor based on field observations.
For example, consider the doublet of 1202 and 1212 A.D. earthquakes. In the Ze'elim outcrop, these earthquakes correspond to a single 13-cm-thick breccia layer, whereas in the Ein Gedi core, the events are recorded as two breccia layers, 1.6 and 2.6 cm thick, respectively (Fig. 10, Table 1). The average deposition rate in the Ein Gedi core is about one third of the rate in the Ze'elim section, yet the respective thickness is only one fifth. Indeed, in Ein Gedi we can resolve an interseismic interval of a decade, whereas in the Ze'elim section, the resolution is three decades. The data for the estimate is given in Table 1. The recurrence interval 1202-1212 A.D. is 10 yr. The deposition rate is given by the thickness of the sediment between the event horizon and the predecessor (or successor) divided by the respective time interval. This definition, applicable only for continuous deposition, neglects possible changes of thickness caused by the breccia formation (redeposition of suspension is likely to fill small-scale bottom topography, some of which may form coseismically).
In the Ein Gedi core, the rate of deposition at the time of the 1212 event is 0.2 cm/yr, and the thickness of the 1212 A.D. breccia is 2.6 cm (Fig. 10). According to Equation (3), Tres is thirteen years. This suggests that it is not possible to resolve a decade-long interval between earthquakes, and indeed Migowski et al. (2004) considered the 1202 A.D. event to be "masked." Close inspection of Figure 10 shows that a pair of aragonite-detritus laminae seems to separate the two events, suggesting that the brecciated interval corresponds to 9 yr. If correct, this indicates a deposition rate of ~0.3 cm/yr, slightly higher than the ratio between the breccia thickness and the interseismic interval. Note that all these estimates neglect lateral transport of sediment, yet this assumption is not valid in the presence of local topography. Indeed, Figure 10 indicates that small-scale topography is filled by the laminae postdating 1202 A.D. and by the breccia layer corresponding to the 1212 A.D. earthquake.
The breccia layer corresponding to the 1202-1212 A.D. doublet in Ze'elim section has Hb = 13 cm, corresponding to 26 yr of deposition at a rate of 0.5 cm/yr (Fig. 9). The calculated resolution limit is 26 yr, significantly longer than the actual recurrence interval of 10 yr. The subsequent earthquake of 1293 A.D. corresponds to an 18-cm-thick breccia layer (Fig. 9), with a resolution limit of 36 yr, about half the historical recurrence interval. This is why the 1212 and 1293 A.D. earthquakes are resolved in the Ze'elim outcrop.
As we saw for the breccia layer associated with the 1212 A.D. earthquake in the Ein Gedi core, the measured thickness of a breccia layer in the field is only a proxy for the thickness of the sediment that brecciated during an event. Inaccuracies in this proxy may result from differential compaction, suspended sediment in the breccia layer filling local topography, and inclusion of earlier unresolved events. Due to these inaccuracies, we use the mean values of observational data for analyzing resolution in the Lisan Formation.
Temporal clustering of earthquakes has been long recognized in the short term covered by instrumental seismicity records (e.g., Ni and Wallace, 1988) and in catalogues of historical seismicity (e.g., Swan, 1988). Mechanical explanations for clustering include interaction between adjacent fault segments with possible evolution of the mechanical properties of the crust (Lyakhovsky et al., 2001; Lynch et al., 2003). The Dead Sea basin is situated between two segments of the transform (Fig. 1) and the long-term sedimentary records can potentially provide data on long-term clustering.
The recognition of intraclast breccias as earthquake indicators is rather new, and more work is required on the influence of local conditions on breccia formation. Yet tentative conclusions on the behavior of the sources for earthquakes can be offered. The main observation afforded by the long paleoseismic records from the Dead Sea basin's lacustrine deposits is that strong earthquakes are clustered over a variety of time scales, at least as long as 104 yr (Marco and Agnon, 2005; Marco et al., 1996b; Migowski et al., 2004).
To assess the extent of clustering in interval population, Marco et al. (1996b) used a simple statistic: the standard deviation normalized by the mean (SDN) (also known as the coefficient of variation). For a periodic series with a constant interval (vanishing variance), this ratio vanishes. When the standard deviation is larger than the mean, the population is considered clustered (Kagan and Jackson, 1991).
Marco et al. (1996b) analyzed the temporal distribution of intraclast breccia in three columnar sections of Lisan Formation. In all three sections, the standard deviation of the thickness intervals exceeded the mean. So, assuming a constant deposition rate, the three sections indicate a temporal clustering of large earthquakes in time. In the PZ1 section, Marco et al. (1996b) went beyond the constant deposition rate approximation: the 36-m-thick section was dated at nine stratigraphic levels using the U-Th method. The age determinations implied a sedimentation-age model with three periods, each with a different rate of sedimentation. More recent field work and additional U-Th dating have modified the sedimentation-age model (Haase-Schramm et al., 2004; Stein and Goldstein, this volume). The present sedimentation-age model, based on a total of 22 age determinations, also accounts for a hiatus required by field observations (Machlus et al., 2000). Using the new deposition-age model, the SDN is 1.6, comparing with 1.8 according to the earlier deposition-age model (Table 2). The SDN is not sensitive to the hiatus between 44 and 49 ka or a possible hiatus between 67 and 62 ka (Haase-Schramm et al., 2004). We verified this by calculating statistics for synthetic records in which additional hypothetical earthquakes are introduced in the hiatuses separated by the mean interval.
Calculating the mean and standard deviation of thickness intervals between event horizons amounts to assuming a uniform rate of sedimentation. Doing this, we approximate the SDN of PZ1 at 1.5 (Table 2). If this is the case for the other sections, then SDN ≥ 1, suggesting that all sections have clustered time series. Similar clustering has been reproduced in a mechanical model that accounts for fault network evolution including rupture and healing (Lyakhovsky et al., 2001).
The mean rate of recurrence of intraclast breccia layers inferred from the late Pleistocene Lisan Formation is 2-3 events per five millennia, varying between nine and zero events per five millennia (Fig. 12). The average thickness of breccia layers in PZ1 is 15 cm. The late Pleistocene earthquake clusters show a peak rate of nine events per five millennia, between 50 and 55 ka (Marco et al. 1996b). This recurrence rate corresponds to an average interval of 500-600 yr. Two additional clusters are evident ca. 40 and 20 ka, respectively. The averages of thicknesses of breccia layers formed during the three clusters are 17, 19, and 8 cm, respectively (Table 3). The typical resolution limit for an earthquake is three hundred years for the second cluster and a hundred years for the other two (two hundred for the entire PZ1 section). This estimate suggests that resolution is not a limiting factor in detecting long-term earthquake clusters in the late Pleistocene lacustrine sections. During the cluster ca. 52 ka, the recurrence rate might exceed the estimate from our data due to lack of resolution.
The recurrence interval for the cluster between 55 and 50 ka is similar to the results of Enzel et al. (2000) from a fan delta in the Dead Sea basin for the past 6 k.y. This is consistent with the suggestion of Enzel et al. (2000), based on a comparison of their mean recurrence interval with that of the entire Lisan Formation, that their late Holocene data represent a cluster of earthquakes.
Another factor that affects the resolution of earthquakes in the lacustrine record is the detection limit of individual breccia layers, Hd. The recognition of a breccia layer depends on the thickness of individual laminae and color contrast between neighboring laminae, which vary from section to section and within sections. Moreover, the method of inspection of the section controls Hd: the detection limit under the microscope is a few millimeters (Fig. 2B), whereas in outcrop it is 2 cm at best. We approximate the detection limit for a given section by the thickness of the thinnest breccia layer, allowing for variations in exposure, color contrasts, and rate of sedimentation.
The variable Hd is useful for the comparison of seismicity recorded by different sections. The recurrence rate in PZ1 peaks ca. 52 ka (Fig. 12) with a recurrence interval of 170 yr. For a similar time span, the recurrence rate inferred for the Ein Gedi core peaks in the past 2 k.y. with a mean recurrence interval of 50 yr (Table 2). The thinnest breccia layer reported in PZ1 is 2 cm, and in the 52 ka cluster it is 3 cm, compared with 2 mm in the Ein Gedi core (Migowski et al., 2004, their Table 2). It is likely that microscopic inspection of the Lisan sediments would reveal additional breccia layers that could not be confidently detected in the field and were classified as clastic layers. Even with such a microscopic study, one would need to account for the threefold ratio between the rates of sedimentation (compare Rs in Tables 1 and 3).
The normalized standard deviation of the historic section in the Ein Gedi record is 0.75, whereas for the entire section SDN = 0.9 (Table 2). Hence, the statistics do not indicate clustering. Migowski et al. (2004) noted variation in the rate of recurrence in the Dead Sea paleoseismic-historical record, with recurrence rates changing drastically on a time scale of half a millennium. This behavior is reminiscent of the historical record of the Anatolian Faults during the first millennium and half of the second millennium A.D. Ambraseys (1971) has pointed out that the historical record of the North and East Anatolian faults show alternation of activity on a 0.5 k.y. time scale. We further this comparison by seeking intervals of uniform rate of seismicity in all three records. We were able to define uniform rates, such that for each of the Anatolian faults, the rate of seismicity fluctuates between two levels of intervals. Figure 13 reproduces Ambraseys' (1971) representation of the cumulative number of earthquakes versus calendar years in the North and East Anatolian faults together with our data from Dead Sea breccia layers.
Figure 13 is striking in two aspects: The first is the uniformity of recurrence rates during several centuries, with rather abrupt shifts. This is clear on the upper panel that shows box-car functions describing the shifting rates in terms of recurrence intervals. The second striking aspect is the timing of the shifts, simultaneous in pairs of faults. At the fifth century A.D., the East Anatolian fault shows an order of magnitude decrease in recurrence interval from 70 yr to 8 yr. At about that time, the recurrence interval of Dead Sea breccia layers decreases from 300 yr to 95 yr. Shortly afterward, the recurrence interval recorded in the North Anatolian fault increases by an order of magnitude from a decade to a century. This quiescent period ends in the tenth century A.D., when the recurrence interval decreases back to a decade. Shortly before the end of the tenth century, the recurrence interval inferred from the Dead Sea breccias decreases from 95 to 50 yr. The recurrence interval increases back to a medium level of 74 yr at the fourteenth century A.D., simultaneously with the order of magnitude increase in the East Anatolian Fault that returns to a recurrence interval of 70 yr.
It is tempting to draw conclusions from these records on the behavior of the plate boundaries. One should keep in mind that these records may be biased as they record ground shaking on the site of the recorder (Dead Sea sediments or Old World chroniclers). Even so the periods of frequent activity are reminiscent of the twentieth century in the North Anatolian Fault, where a series of ruptures have propagated along the plate boundary from east to west (Toksoz et al., 1979; Stein et al., 1997b). Similarly, the series of earthquakes recorded in the Dead Sea from the beginning of the second millennium A.D. seems to follow a similar propagation pattern from north to south (Marco and Agnon, 2000, 2005). If the record indeed indicates shifts in activity along the plate boundary, the concerted transitions may indicate a mechanical coupling.
The systematic approach to accumulating observations on intraclast breccia layers permits their analysis as recorders of paleo-earthquakes. Such breccia layers, previously called "mixed layers," are abundant in sedimentary sections of Quaternary lakes from the Dead Sea basin. The finding of intraclast breccia layers juxtaposed against surface faults has driven a wide range of studies focused on these long-term seismic recorders. The fault scarps form a fault zone, traced to the subsurface by high-resolution geophysical surveys. This fault zone is a subsidiary structure to the master fault bounding the Dead Sea basin from the west and extending north to the transform plate boundary. While the record of displacement of the fault zone is limited to particular slip events that activate this secondary structure, the record of breccia layers may be complete for events that rupture the plate boundary.
We define field criteria for the identification of intraclast breccias, focusing on features that can indicate a seismic origin. The wealth of data for such earthquake indicators collected in natural outcrops within the Dead Sea basin offers insights into the phenomenology and systematics of earthquakes on time scales that are not obtainable elsewhere.
Cores from the receding shore of the Dead Sea contain continuous sedimentary records of the past 10 k.y., undisturbed by lowstands. The Ein Gedi core features 3 m of alternating seasonal laminae. The two independent earthquake records—historical and sedimentary—offer a simultaneous test regarding two hypotheses: the earthquake origin of breccia and the annual cycle of laminae. The likelihood of matching historical earthquakes with an arbitrary time series that corresponds to the breccia layers in the core is negligible. The observation that the breccia layers match earthquakes from the historical catalogues that are strong and/or close to the coring site supports both hypotheses (Fig. 11). Changes in the rate of recurrence of earthquakes in the Dead Sea record during the historical period seem to correlate with changes in the Anatolian Fault system. If the rates of recurrence could be taken as indicators of activity of the plate boundaries, then these plate boundaries might be coupled on the time scale of 500 yr.
The brecciation from an earthquake that succeeds another strong earthquake might obliterate the breccia layer of the predecessor. This hampers the potential that lies in the laminated sediment to resolve pairs of earthquakes. The resolution of an interseismic interval is no better than the ratio of the thickness of a breccia layer to the rate of deposition. But the resolution limit of individual earthquakes does not affect the observation of clustering in the record, which is evident in the long periods of quiescence alternating with periods of recurrence of earthquakes. During most of the period recorded, we find that the apparent recurrence interval is significantly longer than the resolution limit. During a cluster of earthquakes ca. 52 ka, the interseismic interval becomes shorter than 200 yr, which is close to the resolution limit for the Lisan outcrops.
Kagan, E., et al. (2011). Intrabasin paleoearthquake
and quiescence correlation of the late Holocene
Dead Sea. Journal of Geophysical Research
116(B4): B04311.
Kagan, E., et al. (2011). Correction to "Intrabasin
paleoearthquake and quiescence correlation of the
late Holocene Dead Sea". Journal of Geophysical
Research: Solid Earth 116(B11): B11305.
Kagan, E. J. (2011). Multi Site Quaternary
Paleoseismology Along the Dead Sea Rift:
Independent Recording by Lake and Cave Sediments.
PhD Dissertation, Hebrew University of Jerusalem.
Neumann, F. H., et al. (2007). Palynology,
sedimentology and palaeoecology of the late
Holocene Dead Sea. Quaternary Science Reviews
26(11-12): 1476-1498.
- from Wikipedia
 PEF Rock Inscription
Rock used by the Palestine Exploration Fund to mark the level of the Dead Sea in the beginning of the 20th century
Wikipedia - CC BY 2.0
In October 1900, R. A. Stewart Macalister found a suitable rock towards the southern end of 'Ain Feshkah's reeds area, next to the Dead Sea shore and standing some 20 ft above the water.[13] A second boulder underneath the first offered a ledge to stand on.[13] He had brought with him a stonemason from Jericho, who carved an 8-9 inches long line into the rock face which was to be used for reference, and the initials "PEF" beneath it.[13] It became known as the PEF rock. Macalister undertook a first measurement and noted that the line stood at exactly 14 ft above the water. [13] Macalister's reference line was then used until 1913 by the PEF researcher, E. W. G. Masterman (1867-1943), who came down from Jerusalem for rigorous biannual measurements. [14][15] Long-forgotten, it was rediscovered after the Six Day war by Israeli geographer and cultural researcher, Zev Vilnay.[14][15]
JW:Macalister (1901:4-5) wrote the following about his inscription on the PEF rockThis mark is a horizontal line, 8 or 9 inches long, with the initials PEF beneath it. The line at the time when it was cut was exactly 14 feet above the surface of the sea (determined by a common tape-measure). Time, 10 a.m., October 9th, 1900