Deir el-Achayer Excavation and Faqaa Trench
Maps, Aerial Views, Photomosaics and Trench Logs, Age Model, and Photos
Maps
- Fig. 1 Location Map (Tectonics)
from Nemer et al (2008)

 Figure 1
(a) The left-lateral Dead Sea Transform Fault extending from the Gulf of Aqaba to southeast Turkey. Modified from McBride et al. [1990] with permission from Elsevier. Box shows location of Figure 1b. White arrows indicate the GPS velocities (mm/a) of the Arabian plate relative to Africa after Gomez et al. [2006].
(b) Shuttle Radar Topography Mission 90-m-resolution digital elevation model of the Lebanese restraining bend showing the main units and structures:
- CF, Coastal Flexure
- CM, Chouf Monocline
- DF, Damascus fault
- HB, Hula basin
- HF, Hasbaya fault
- JGF, Jordan Gorge fault
- MF, Missyaf fault
- OM, Offshore monocline
- RcF, Rachaya fault
- RF, Roum fault
- SF, Serghaya fault
- YF, Yammouneh fault
White circles indicate the estimated locations of epicenters of historical earthquakes as reported by Sbeinati et al. [2005] and references therein. Box indicates location of Figure 2.
Nemer et al (2008) - Fig. 2 Location Map
(Tectonics and Seismology) from Nemer et al (2008)

 Figure 2
(a) Digital elevation model of the RcF-SF area (location on Figure 1b) showing the different places referred to throughout the text. White boxes indicate the locations of subsequent figures. White arrows indicate the slope break at the base of the northern flank of Mount Hermon. Probable faulting (broken line southwest and northeast) of SF is after Gomez et al. [2003].
(b) Instrumental seismicity of the RcF-SF area for the period 1903-2004 compiled from EMSC, NEIC and ISC bulletins.
Nemer et al (2008) - Fig. 4a Location Map
for Faqaa Trench from Nemer et al (2008)

 Figure 4a
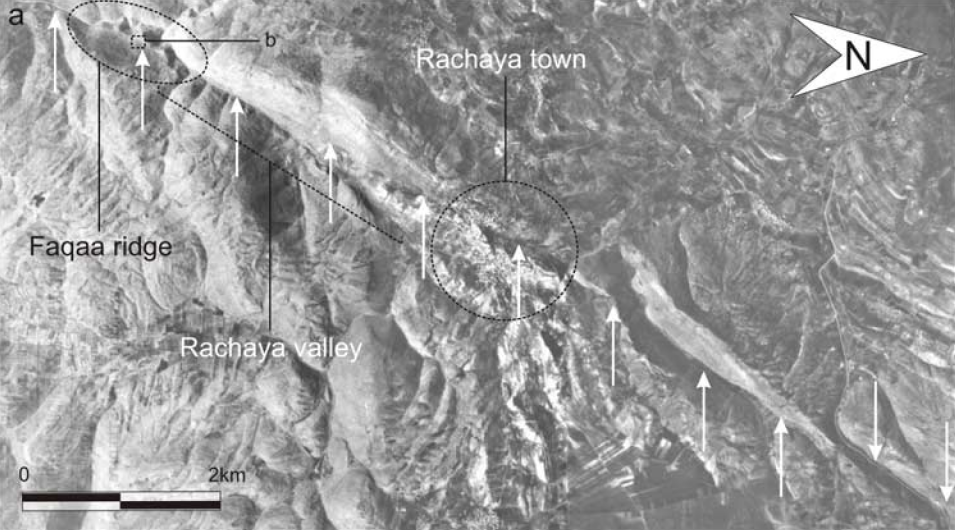
Aerial photograph showing the Rachaya fault (indicated with arrows) in the Rachaya area (see Figure 2a for location).
Nemer et al (2008) - Fig. 5 Location Map
for Deir el-Achayer excavation from Nemer et al (2008)

 Figure 5
Aerial photograph showing the Deir-el-Achayer area (see Figure 2a for location) where the Serghaya fault splays into 2 branches as indicated with the arrows. White line indicates the location of the paleoseismic excavation (section 5.2; Figure 9).
Nemer et al (2008)
Aerial Views
Photomosaics and Trench Logs
Faqaa Trench
 Figure 7
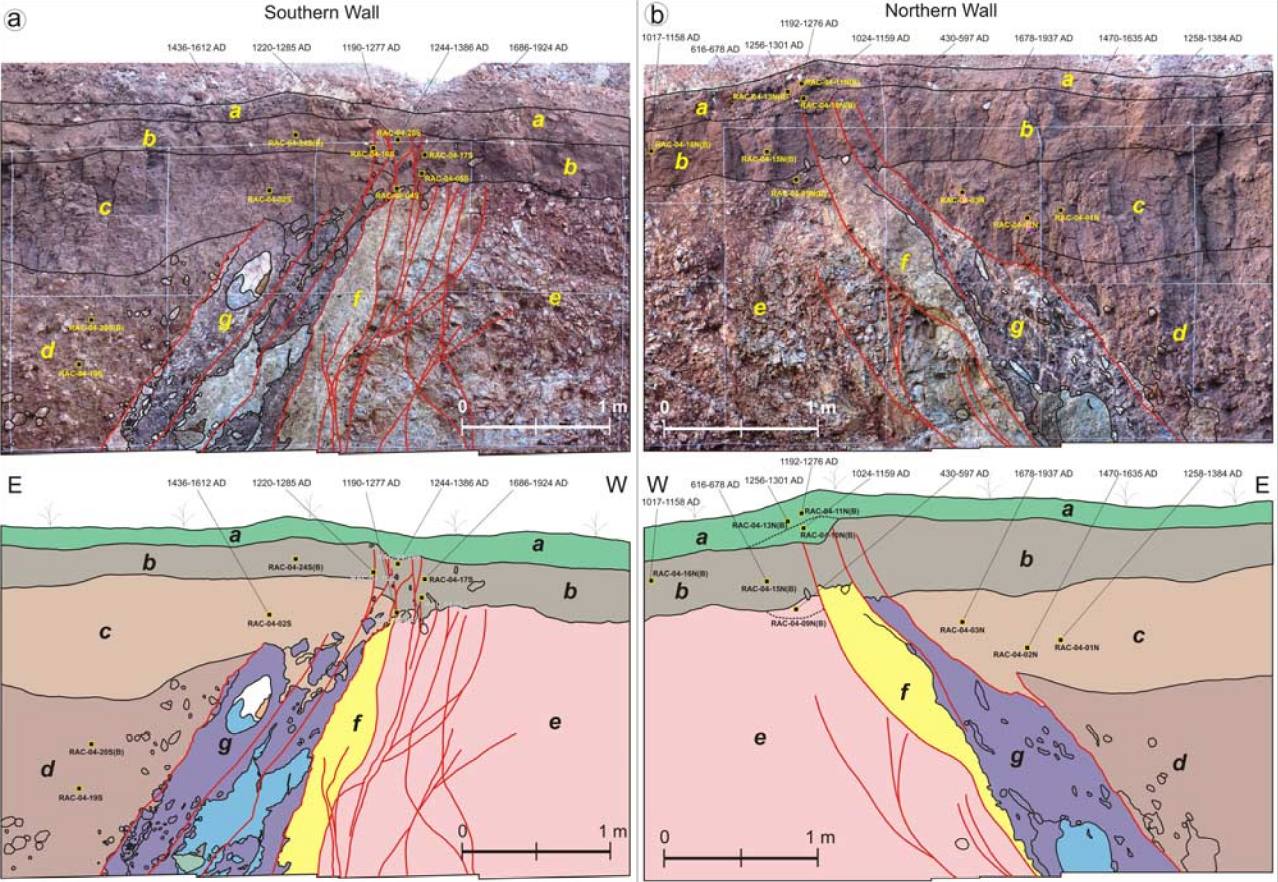
Photo-mosaics and traces of the southern (a) and northern (b) walls of the Faqaa trench. Stratigraphic and shear units are labeled a-g (see text for details). Red lines indicate the fault branches. Black squares are the locations of the 14C samples with their corresponding names and age ranges.
Nemer et al (2008)
Deir-el-Achayer excavation
 Figure 9
Photo mosaic (a) and trace (b) of the Deir-el-Achayer excavation. Stratigraphic units are labeled a-d. Dashed red lines indicate the fault branches. Black squares are the locations of the 14C samples with their corresponding names and age ranges.
Nemer et al (2008)
Age Model - Faqaa Trench
 Figure 8
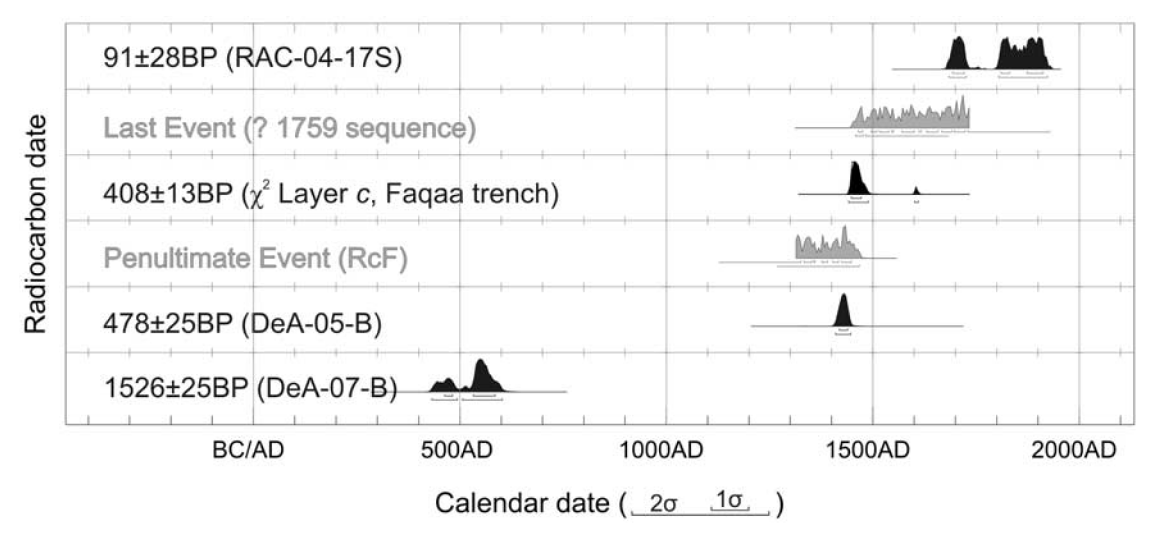
Probability distribution of 14C ages (Table 1) obtained from sequential radiocarbon dates automatically performed by the OxCal 3.10 Program (Bronk Ramsey [1998]). Calibrated dates (black) are presented with 1σ and 2σ age ranges (68.3% and 95.4% density, respectively). Age ranges of seismic events (grey) are determined using Bayesian distribution and related conditional probability imposed by the stratigraphic sequence and 14C dating of the Faqaa trench.
Nemer et al (2008)
Photos
- Fig. 4b Faqaa Trench Site
from Nemer et al (2008)

 Figure 4b
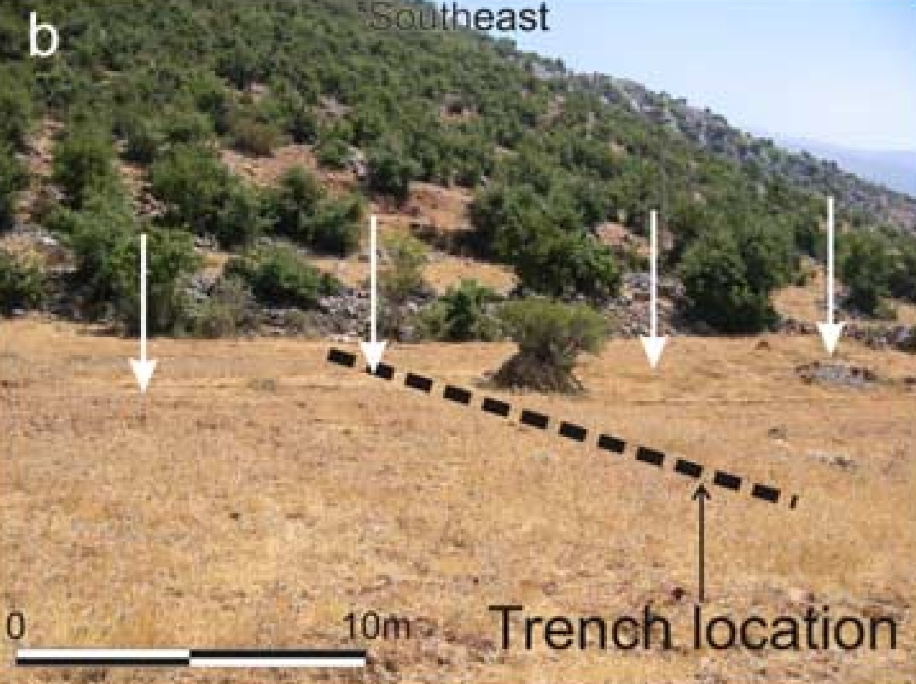
Fresh fault scarp (indicated with arrows) detected along the Faqaa ridge. Dashed line indicates the location of the paleoseismic trench (section 5.1; Figure 7). View SE.
Nemer et al (2008) - Fig. 3 Offset Alluvial Fan
from Nemer et al (2008)

 Figure 3
(a) Field photograph (location on Figure 2a) showing 2 fresh traces of the RcF (indicated with black arrows) and an offset alluvial fan (Chebaa fan, circled). View E and upslope.
(b) A closer view of the Chebaa fan offsets. Note the fresh fault traces (white arrows) and the offsets. View W and downslope
Nemer et al (2008) - Fig. 6 Pressure Ridge
from Nemer et al (2008)

 Figure 6
Field photograph (location on Figure 2a) showing young, en-echelon, periclinal pressure ridges (circled) preserved in unconsolidated sediments along the Serghaya fault. The field of view is about 200 m. View E
Nemer et al (2008)
Master Seismic Events Table
Deir el-Achayer Excavation
Faqaa Trench

