Bet Zeyda

Tying the offsets to event ages. The events that were recognized by Wechsler et al. (2014) are represented by their age probability density functions (pdfs) as generated by Oxcal, and color coded by channel. For each event, an associated offset is attached. Colored boxes at the top represent the age extent of each channel's sediments. Historically known earthquakes are marked by grey lines. There is an age uncertainty as to the age of the oldest units in channel 4 (units 490–499) marked by a dashed rectangle. Inset – the result of the CVt calculation for the earthquake ages.
JW: Shape of events at 1202 and 1759 on this plot understate uncertainty and present unrealistic probability distributions - because these two events came from older work where such a probability density vs. time plot wasn't generated. Event E.H. 1 dates to between 1020 and 1280 CE and very likely reflects the 1202 CE earthquake. Event E.H.2 struck after 1415 CE but it is not known how long after. It could have been a result of a number of different earthquakes such as the 1546, 1759, and 1837 earthquakes. Marco et al (2005) favored the 1759 CE earthquake but considered the possibility of other earthquakes.
Wechsler at al. (2018)
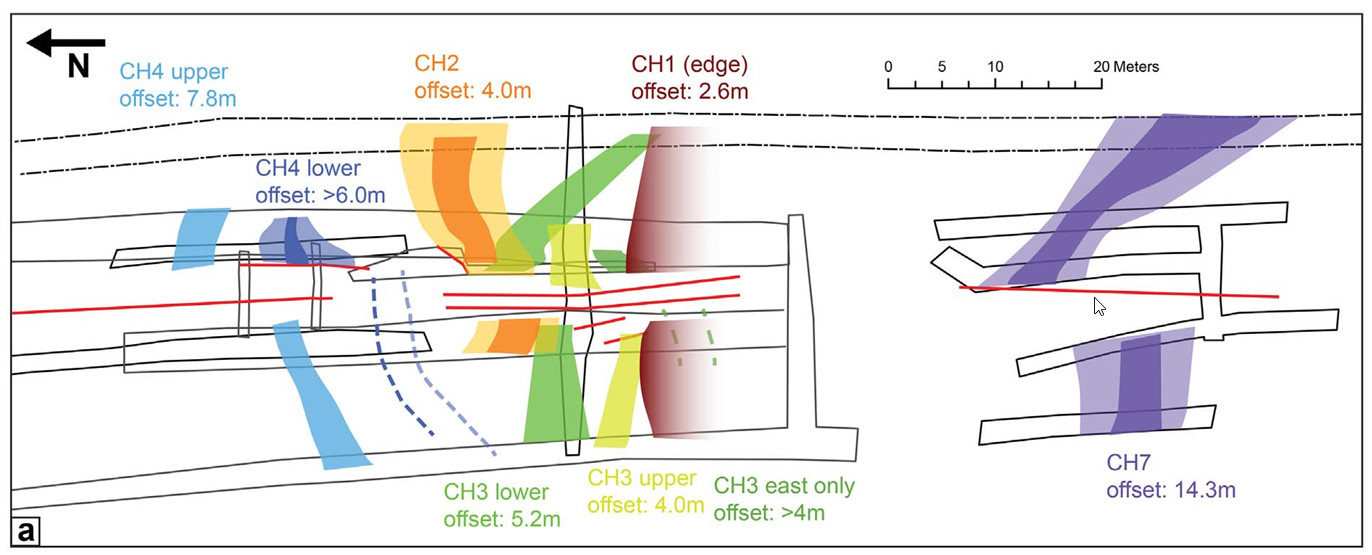
Figure 8a
Generalized map of the channels and their associated offsets
Wechsler at al. (2018)
| Transliterated Name | Source | Name |
|---|---|---|
| Bet Zeyda | Hebrew | בית ציידא |
| Beteiha |
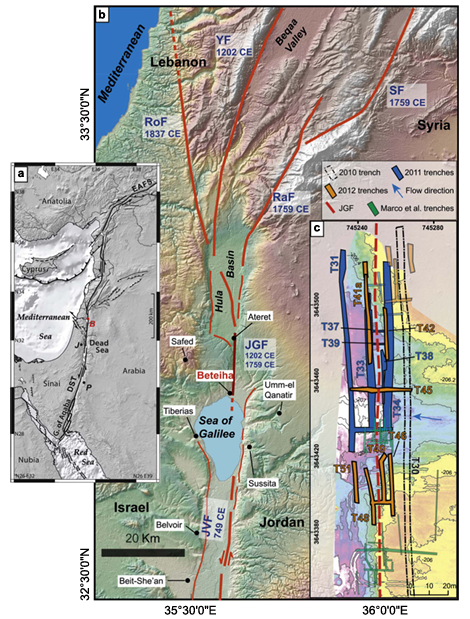
- Plate tectonic settings of the Middle East, with major faults.
- EAFS– East Anatolia Fault
- DST– Dead Sea Transform
- J– Jerusalem
- K– Kerak
- P– Petra
- B– Beteiha trench site
- Location of major and minor faults of the DST in the vicinity of Hula basin and the Sea of Galilee.
- JGF, Jordan Gorge fault
- JVF, Jordan Valley fault
- RaF, Rachaya fault
- RoF, Roum fault
- SF, Serghaya fault
- YF, Yammouneh fault
- Map of the Beteiha paleoseismic site with outlines of all trenches dug during the 3-year campaign, and the approximate location (based on air photos) of the trenches of Marco et al. (2005). The trenches discussed in this paper are highlighted and labeled. Topography model was obtained using TLS (Terrestrial Laser Scanner) prior to 2nd year trenching, courtesy of O. Katz from the Geological Survey of Israel. The contour lines represent elevation b.m.s.l.
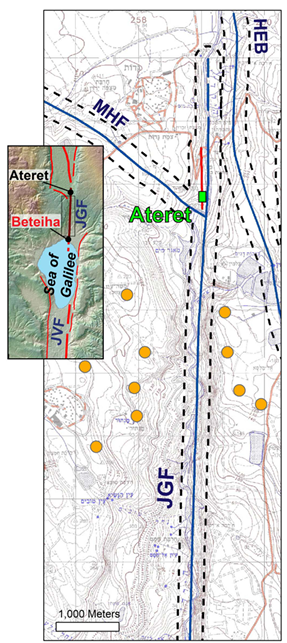
An excerpt from the Israel's active fault map (Sagy et al., 2016) along the JGF. Active faults are marked in red, suspected active in blue. Orange circles mark the near field stations of the GPS campaign measurements locations (Hamiel et al., 2016). The Ateret crusader castle (green rectangle) is situated on top of a branch of the JGF (marked red), parallel to the main fault and north of a branching point with MHF, while the GPS array of Hamiel et al. (2016) crosses the JGF south of the branching point. The Beteiha paleoseismic site is ~4 km south of the map's lower edge. Inset– location map, black rectangle marks the extent of the excerpt from the active faults map. MHF– Mishmar Hayarden fault (normal/ss). HEB– Hula Eastern border fault (normal).
Wechsler at al. (2018)
- Bet Zeyda Trenches Area in Google Earth
 Bet Zeyda Trenches Area in Google Earth outlined in red
click on image to explore this site on a new tab in Google Earth - Bet Zeyda Trenches Area on govmap.gov.il
on govmap.gov.il
 Bet Zeyda Trenches Area on govmap.gov.il
click on image to explore this site on a new tab in govmap.gov.il
Figure 1c
Map of the Beteiha paleoseismic site with outlines of all trenches dug during the 3-year campaign, and the approximate location (based on air photos) of the trenches of Marco et al. (2005). The trenches discussed in this paper are highlighted and labeled.
Topography model was obtained using TLS (Terrestrial Laser Scanner) prior to 2nd year trenching, courtesy of O. Katz from the Geological Survey of Israel. The contour lines represent elevation b.m.s.l.
clcik on image to open in a new tab
Wechsler at al. (2018)

General settings of the Beteiha (aka Bet Zayda) site.
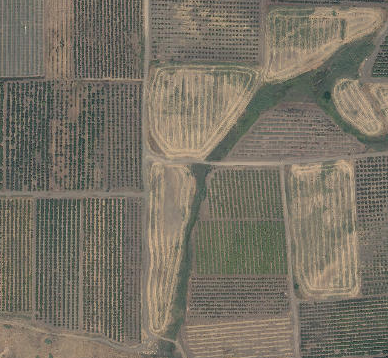
(a) An air photo of the field where the trenches were excavated, with the Jordan River, the main fault, and the local drainage demarcated. The channel flowing west through the trench site (double thin-dashed line) is abandoned and the field is now drained by the marked artificial canal (short thick-dashed line).
(b) A photo of the trench site at the beginning of the first-trenching campaign, looking north toward the Jordan Gorge. A white car stands next to T30. A vegetation lineament associated with the fault is visible at the front.
(c) The trench site with outlines for all trenches dug during our campaign, as well as the location of Marco et al. (2005) trenches. The trenches discussed in this paper are highlighted and labeled. The modern channel margins are marked by a dashed line. The topography model was obtained using a terrestrial laser scanner prior to second-year trenching, courtesy of O. Katz from the Geological Survey of Israel. The contour lines represent variations in elevation.
Wechsler at al. (2014)
Bet Zeyda Trenches Area in Google Earth outlined in redclick on image to explore this site on a new tab in Google Earth

Figure 3
Partial trench logs for T45 (north and south walls), focusing on the fault zone. Inset: Location map of trenches and channels mentioned in the paper. The outline of the channels is drawn schematically, based on this study and previous results (Marco et al., 2005; Wechsler et al., 2013). The legend applies to Figures 6–8 as well.
Wechsler at al. (2014)
 Figure S1
- a - north wall of T45
- b - south wall of T45
Click on image to open a high resolution magnifiable image in a new tab
Wechsler at al. (2014)

Figure 6
Trench logs for T37 (north and south walls). Event horizons are marked with dashed lines and faults in gray. The inset map and legend are the same as Figure 3.
Wechsler at al. (2014)
 Figure S1
- d - north wall of T37
- e - south wall of T37
Click on image to open a high resolution magnifiable image in a new tab
Wechsler at al. (2014)
Figure 7
Trench logs for T33 (east wall), where channel 4 is exposed. Event horizons are marked with dashed lines and faults in gray. The intersections with T37 and T39 are marked. Ages in italic denote proxy locations (same unit, different exposure) from another exposure of the same wall (see Fig. S1c available in the electronic supplement). The inset map and legend are the same as Figure 3.
Wechsler at al. (2014)
 Figure S1
- f - east wall of T33 where channel 3 is exposed
Click on image to open a high resolution magnifiable image in a new tab
Wechsler at al. (2014)
 Figure S1
- c - east wall of T41a, which is a deeper re-exposure of T33
Click on image to open a high resolution magnifiable image in a new tab
Wechsler at al. (2014)

Figure 8
Trench logs for T39 (north and south walls). Event horizons are marked with dashed lines and faults in gray. The sample at the bottom of T39N is in a proxy location from a lower unit of channel 6, below the channel 4 deposits (see Fig. S1c available in the electronic supplement). The inset map and legend are same as in Figure 3.
Wechsler at al. (2014)
 Figure S1
- g - north wall of T39
- h - south wall of T39
Click on image to open a high resolution magnifiable image in a new tab
Wechsler at al. (2014)

Figure 2
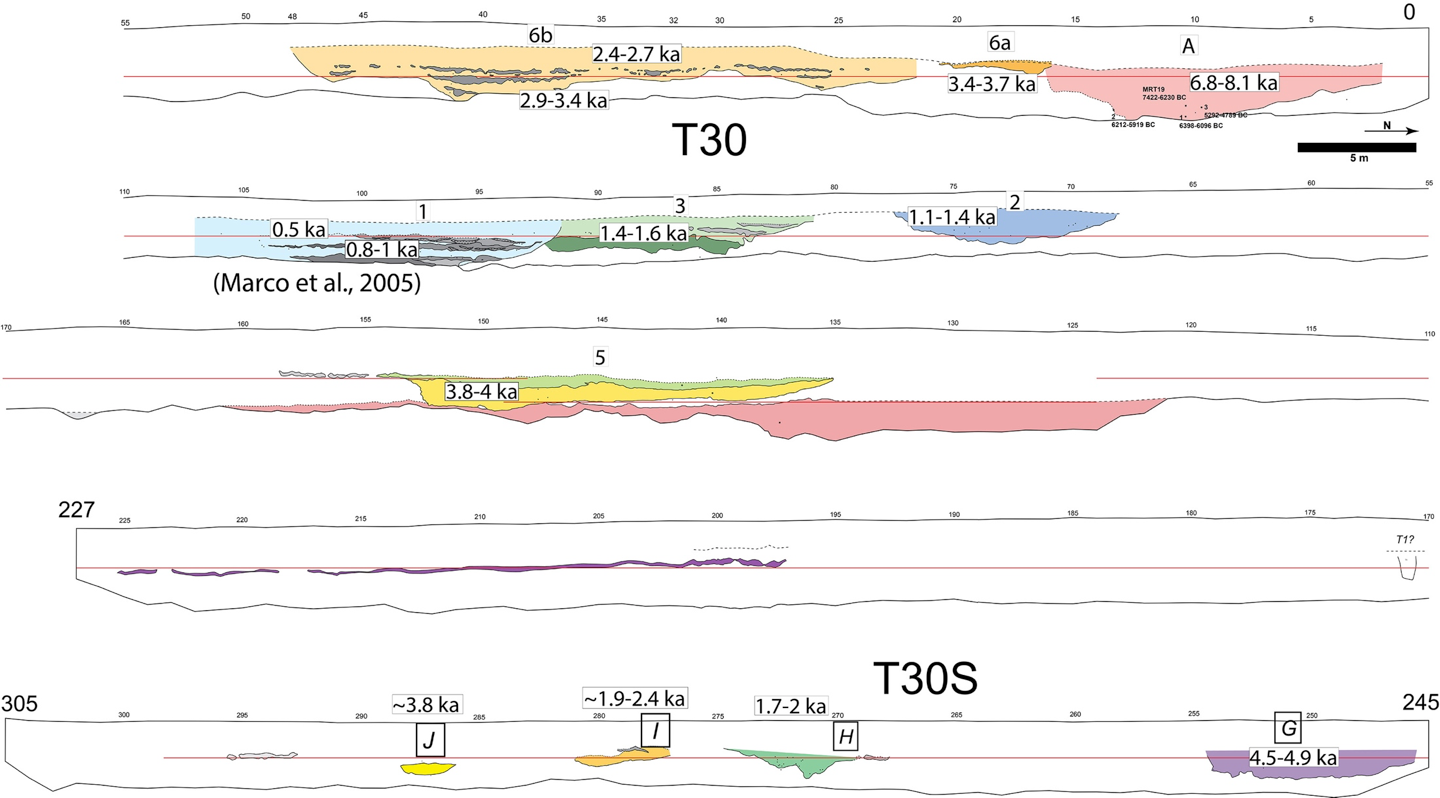
A simplified log of the parts of the west wall of T30 where channels cut into the massive clay. Channels are marked by their corresponding numbers in the text. The legend is the same as in Wechsler et al. (2014). Channel 4 was not exposed in T30. Inset on lower left – an example partial photolog of T37S, where the coarse sediments of channel 4 can be seen in fault contact. Faults are marked in red, event horizons in orange (full log was published in Wechsler et al., 2014).
Wechsler at al. (2018)
T30 Trench Log
Unpublished Image - courtesy of from Tom Rockwell (email 30 March 2022)
 Figure S1
- i - east wall of T34, where channels 2 and 3 are exposed
Click on image to open a high resolution magnifiable image in a new tab
Wechsler at al. (2014)
 Figure S1
High resolution photomosaic logs of trench walls. 14C sample dates in the log are not calibrated (years BP). For trench locations, see Figure 2c in the main article. Units are numbered and their descriptions appear in Table S1 of the supplementary material:
- north wall of T45
- south wall of T45
- east wall of T41a, which is a deeper re-exposure of T33
- north wall of T37
- south wall of T37
- east wall of T33 where channel 3 is exposed
- north wall of T39
- south wall of T39
- east wall of T34, where channels 2 and 3 are exposed.
Click on image to open a high resolution magnifiable image in a new tab
Wechsler at al. (2014)
Tying the offsets to event ages. The events that were recognized by Wechsler et al. (2014) are represented by their age probability density functions (pdfs) as generated by Oxcal, and color coded by channel. For each event, an associated offset is attached. Colored boxes at the top represent the age extent of each channel's sediments. Historically known earthquakes are marked by grey lines. There is an age uncertainty as to the age of the oldest units in channel 4 (units 490–499) marked by a dashed rectangle. Inset – the result of the CVt calculation for the earthquake ages.
JW: Shape of events at 1202 and 1759 on this plot understate uncertainty and present unrealistic probability distributions - because these two events came from older work where such a probability density vs. time plot wasn't generated. Event E.H. 1 dates to between 1020 and 1280 CE and very likely reflects the 1202 CE earthquake. Event E.H.2 struck after 1415 CE but it is not known how long after. It could have been a result of a number of different earthquakes such as the 1546, 1759, and 1837 earthquakes. Marco et al (2005) favored the 1759 CE earthquake but considered the possibility of other earthquakes.
Wechsler at al. (2018)
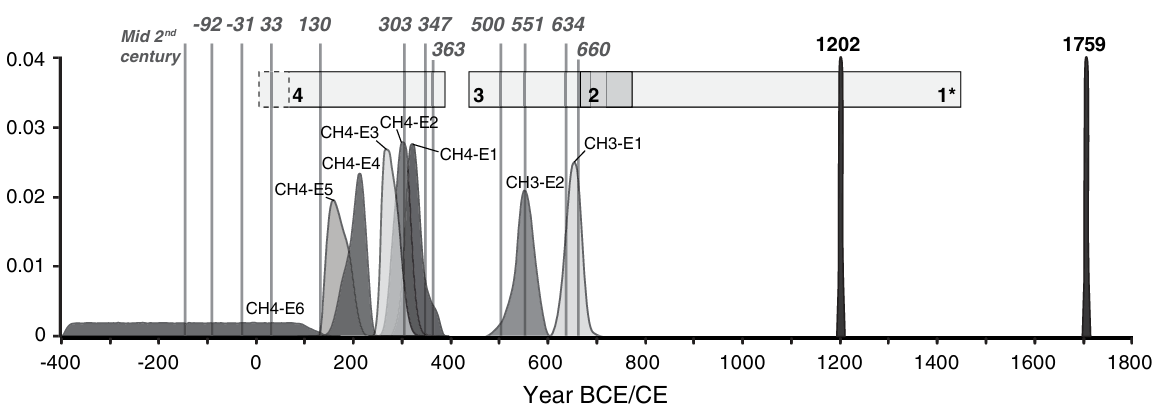
Probability density functions for all paleoseismic events, based on the OxCal modeling. Historically known earthquakes are marked by gray lines. The age extent of each channel is marked by rectangles. There is an age uncertainty as to the age of the oldest units in channel 4 (units 490–499) marked by a dashed rectangle. Channel 1 refers to the channel complex studied by Marco et al. (2005).
JW: Shape of events at 1202 and 1759 on this plot understate uncertainty and present unrealistic probability distributions - because these two events came from older work where such a probability density vs. time plot wasn't generated. Event E.H. 1 dates to between 1020 and 1280 CE and very likely reflects the 1202 CE earthquake. Event E.H.2 struck after 1415 CE but it is not known how long after. It could have been a result of a number of different earthquakes such as the 1546, 1759, and 1837 earthquakes. Marco et al (2005) favored the 1759 CE earthquake but considered the possibility of other earthquakes.
Wechsler at al. (2014)

Figure 4
the revised OxCal model for channels 2 and 3. Changes relative to Wechsler et al (2014) are marked in red
Wechsler at al. (2018)
Figure 4
the revised OxCal model for channels 2 and 3. Changes relative to Wechsler et al (2014) are marked in red
Wechsler at al. (2018)

Figure 5
An OxCal model of the overall stratigraphy of the channel complex using OxCal 4.1 (Bronk-Ramsey, 2009). We use the Marco et al. (2005) ages as an upper bound for our model, and a sample obtained from below channel 4 as a lower bound.
Wechsler at al. (2014)
Figure 5
An OxCal model of the overall stratigraphy of the channel complex using OxCal 4.1 (Bronk-Ramsey, 2009). We use the Marco et al. (2005) ages as an upper bound for our model, and a sample obtained from below channel 4 as a lower bound.
Wechsler at al. (2014)
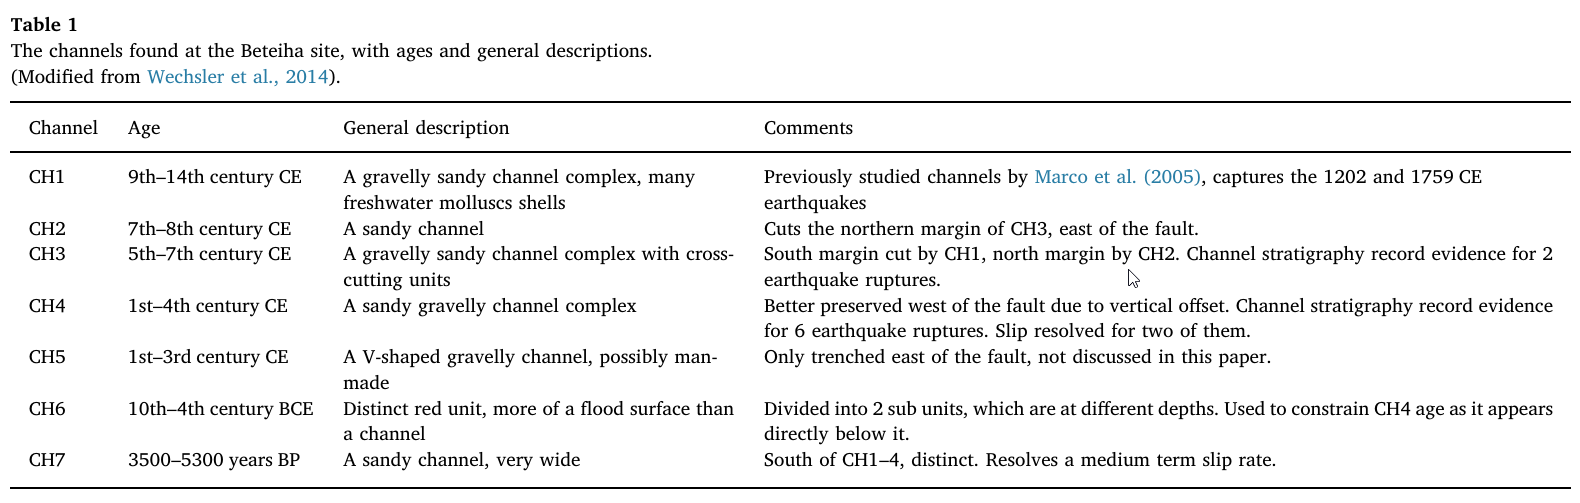
Table 1
The channels found at the Beteiha site, with ages and general descriptions. (Modified from Wechsler et al., 2014).
Wechsler at al. (2018)
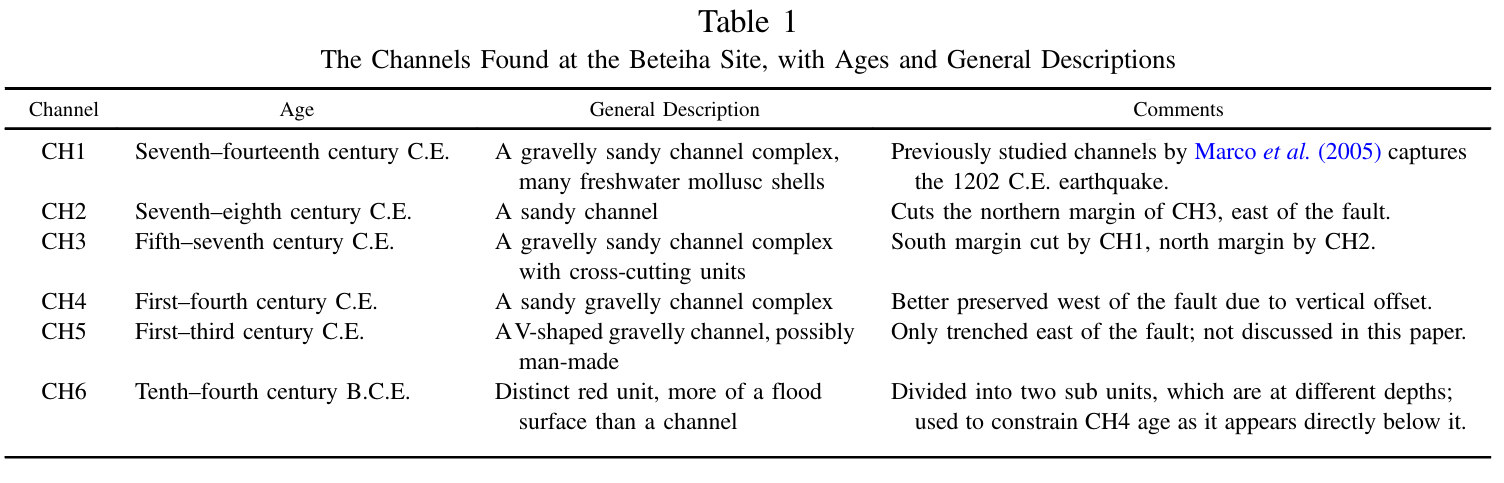
Table 1
The Channels Found at the Beteiha Site, with Ages and General Descriptions
Wechsler at al. (2014)
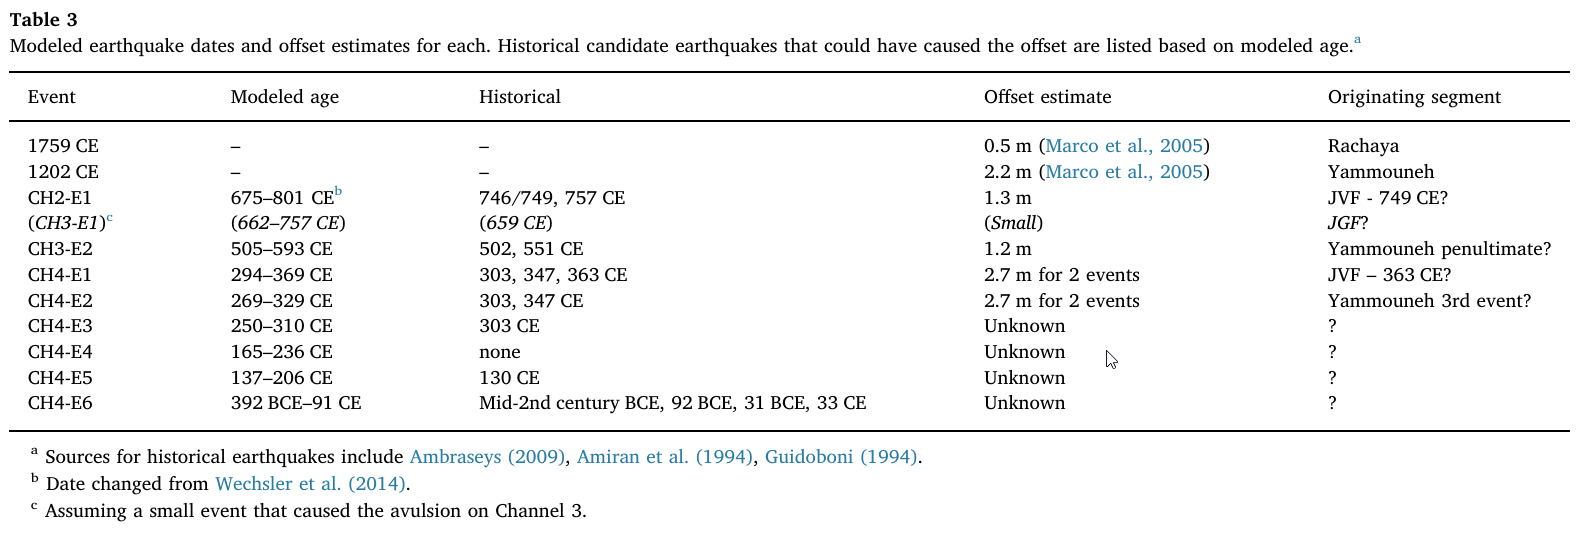
Table 3
Modeled earthquake dates and offset estimates for each. Historical candidate earthquakes that could have caused the offset are listed based on modeled age.
Wechsler at al. (2018)
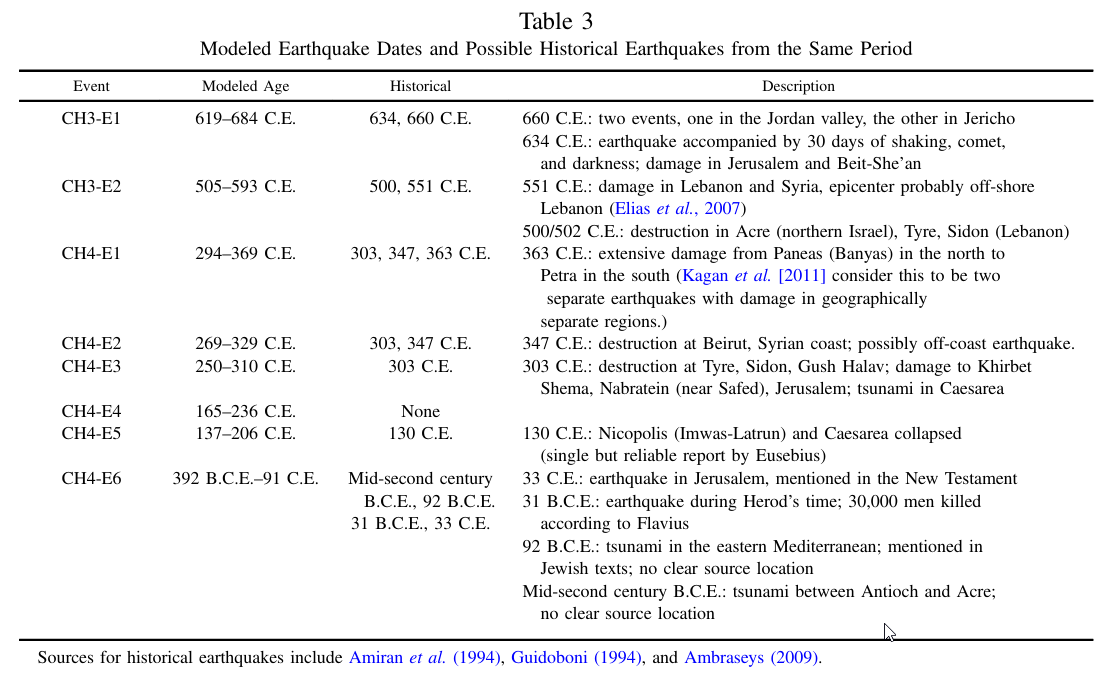
Table 3
Modeled Earthquake Dates and Possible Historical Earthquakes from the Same Period
Wechsler at al. (2014)
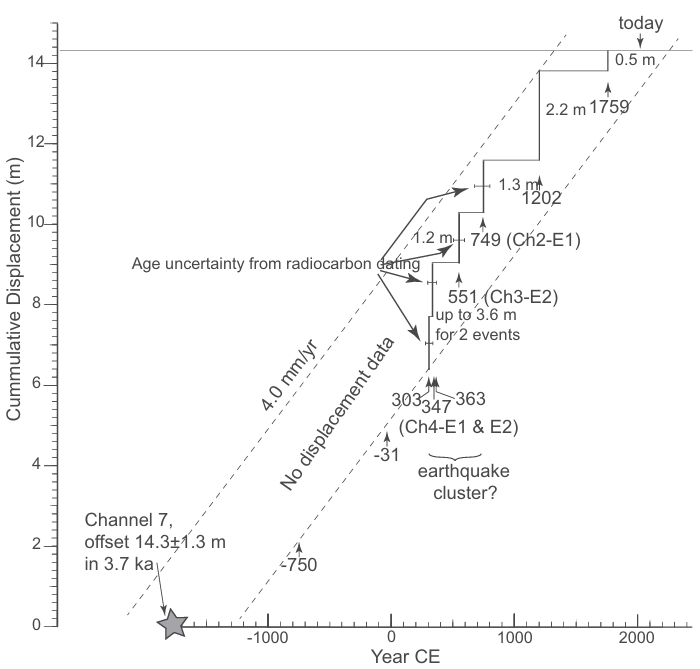
Figure 12
Cumulative displacement vs. time based on historical earthquake dates and offsets from the reconstructed channels.
Wechsler at al. (2018)
Figure 8a
Generalized map of the channels and their associated offsets
Wechsler at al. (2018)
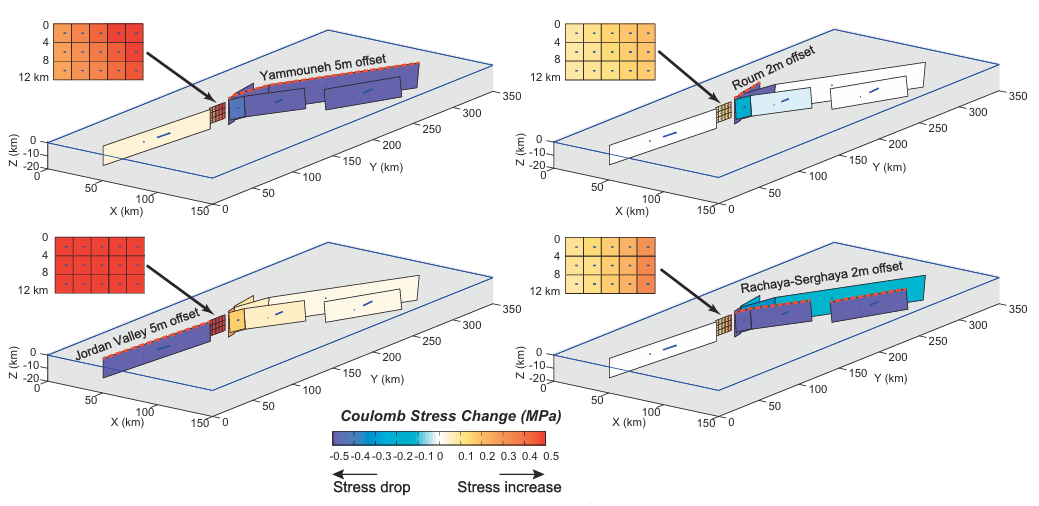
Figure 9
Coulomb Stress modeling (using Coulomb 3.3, Toda et al., 2011) of the area using a simplified fault model of the DST from the Jordan Valley segment to the Lebanese restraining bend (not including the Mt. Lebanon thrust).
In each model, an earthquake was applied on one fault (marked in dashed red line), based on rupture estimates for the last earthquake on that fault (left-lateral strike slip). The resulting Coulomb Stress change on the neighboring faults was calculated.
See Table S1 for model parameters of each run.
Wechsler at al. (2018)
- from Marco et al. (2005)
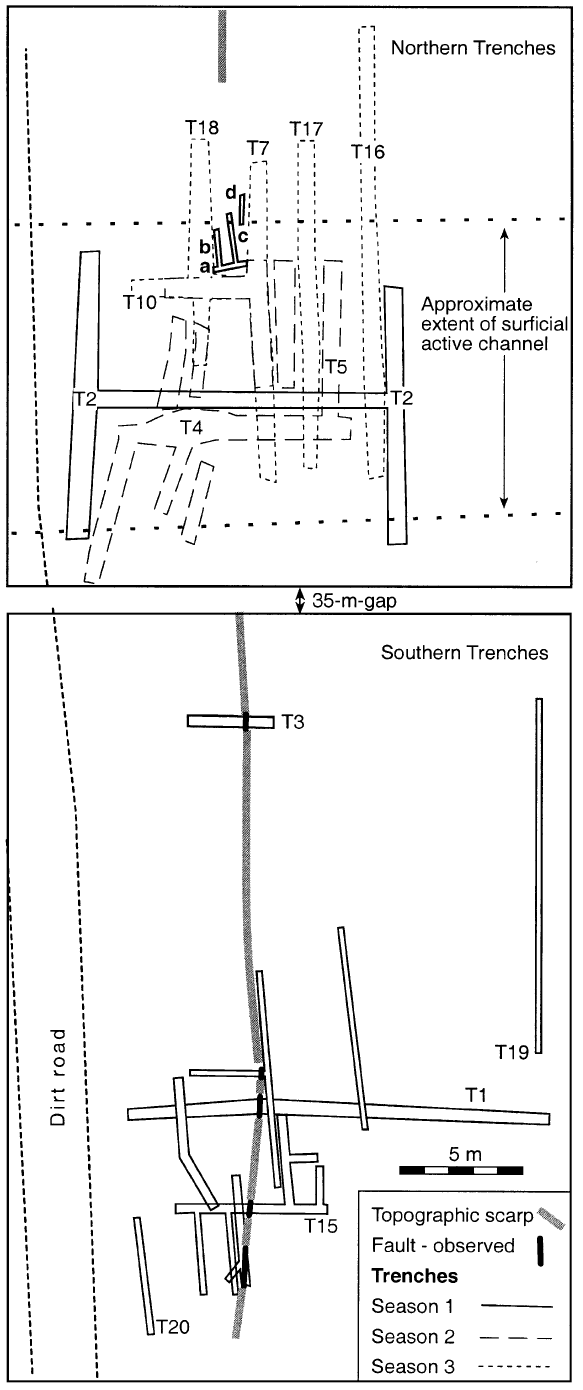
Fig. 4
Map of trench site. The site was developed over three seasons, each marked with a different line.
Marco et al (2005)
- from Marco et al. (2005)

Fig. 6
Fault-parallel trench logs of the northern group show offset stream channels. Alternating alluvium and lake deposits reflect fluctuations of water level of the Kinneret. Clay units 1 and 8 below and above the channels indicate high stands of the Kinneret whereas channel incision indicates low stand.
Marco et al (2005)
- from Marco et al. (2005)

Fig. 7
Trench logs and dated stratigraphy of Trenches T10 (bottom) and T4 (top). Solid lines mark the faults, dashed are very faint,discontinuous disturbances, which we attribute to late adjustments of the overlying strata. Two slip events are observed in T10. Based only onthe 14C dating, the first slip event (E.H. 1) postdates the 12th century and predates the 13th century. The second slip (E.H. 2) postdates the 15thcentury. Based on historical earthquake catalogues and correlation to Ateret we correlated the slip events to the earthquakes of 20 May 1202 and 30 October 1759. The trace of the 1759 slip is not clear in trench T7 because of the poorly-consolidated unit 6c. We therefore mark only E.H. 1.
Marco et al (2005)
- from Marco et al. (2005)

Fig. 8
The stratigraphy near the fault at Trench T15 of the southern group. The oldest age of bulk organic matter leached from of the alluvial sand layer is 5 kaF50 yr. The concordance of the other dates with the stratigraphy indicate their reliability. The top of the trench shows the surface expression of the fault, where the eastern side is about 0.8 m higher than the western side.
Marco et al (2005)
- from Marco et al. (2005)

Top: calibrated date distribution for samples from trenches T2, T4, and T10. Center: probability density functions for radiocarbon dates that constrain the timing of the penultimate event at the Bet-Zayda palaeoseismic site. The dates were trimmed with Bayesian statistics in OxCal,and the probability density function for the event age is calculated from the radiocarbon ages. Note that the historical 1202 earthquake falls within the probability distribution, and is in fact the only historical earthquake in the vicinity that can possibly fit the age distribution. This indicates that the detrital charcoal dated for this study was not resident in the system for an extended period of time (decades versus centuries). Bottom: calibrated date distribution for samples from trench T15. Calibration of 14C ages was done with the Bronk Ramsey’s (2002) OxCal program version 3.8 using the atmospheric data of Stuvier et al.
Marco et al (2005)
- from Marco et al. (2005)
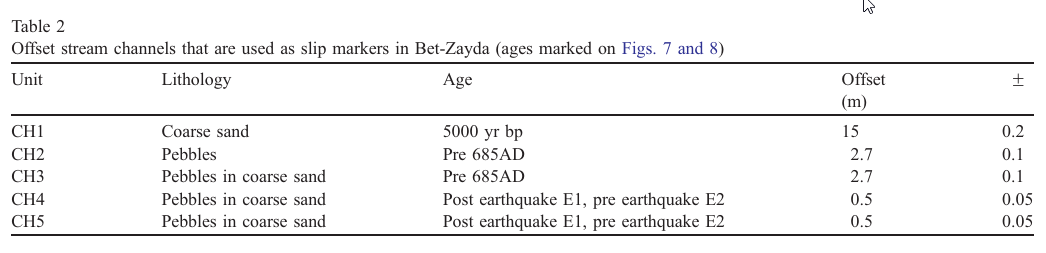
Table 2
Offset stream channels that are used as slip markers in Bet-Zayda (ages marked on Figs. 7 and 8)
Marco et al. (2005)
Probability density functions for all paleoseismic events, based on the OxCal modeling. Historically known earthquakes are marked by gray lines. The age extent of each channel is marked by rectangles. There is an age uncertainty as to the age of the oldest units in channel 4 (units 490–499) marked by a dashed rectangle. Channel 1 refers to the channel complex studied by Marco et al. (2005).
JW: Shape of events at 1202 and 1759 on this plot understate uncertainty and present unrealistic probability distributions - because these two events came from older work where such a probability density vs. time plot wasn't generated. Event E.H. 1 dates to between 1020 and 1280 CE and very likely reflects the 1202 CE earthquake. Event E.H.2 struck after 1415 CE but it is not known how long after. It could have been a result of a number of different earthquakes such as the 1546, 1759, and 1837 earthquakes. Marco et al (2005) favored the 1759 CE earthquake but considered the possibility of other earthquakes.
Wechsler at al. (2014)
Table 3 and Figure 9 summarize the event ages obtained from the OxCal model and compare them with known historical earthquakes from that period. The uncertainty regarding the age of the oldest event in channel 4 makes finding the equivalent historical earthquake difficult; however, if indeed the lower part of channel 4 is closer in age to the rest of the channel units, then it is reasonable to assume the event occurred around the turn of the millennium and could correlate with the 31 B.C.E. earthquake of Herod’s time. Earlier candidate events include 92 B.C.E. and an earthquake in mid-second century B.C.E., but the location of those events is not clear (Table 3).
Table 3
Modeled Earthquake Dates and Possible Historical Earthquakes from the Same Period
Wechsler at al. (2014)
In the historical records there is no mention of any earthquake anywhere along the DST between 130–303 C.E., and the same is true for the Dead Sea cores (Kagan et al., 2011). Channel 4 units span this period of time, and in them we detected evidence for 3–4 events with model ages that over-lap this time period (events CH4-E5 through E2), and one of those events fall completely within the supposed seismic quiescence period (CH4-E4). It is well known that the historical earthquake record is incomplete in general, and specifically for that time period (Late Roman) during which the Roman empire was in decline, and the main historical texts describing this period are compilations written by historians who lived during later periods. It is therefore likely that a moderate earthquake could occur and not be recorded in either historical sources or by the Dead Sea seismites, yet cause sediment disruption and surface rupture along the JGF. An earthquake of magnitude ∼6–6:5 would rupture the surface at Bet-Zayda Valley and be detectable in trenches (e.g., Liu-Zeng et al., 2007) but not by Dead Sea seismites that are more than 100 km away (figure 9 of Kagan et al., 2011).
In the historical earthquakes catalog for the time period equivalent to the paleoseismic record, there are a few earthquakes with evidence of damage that are not centered along the JGF or in northern Israel. For example, the 551 C.E. earthquake is thought to have ruptured offshore Lebanon, on the Mount Lebanon Thrust (Elias et al., 2007). Yet we must consider the possibility that the rupture extended to the south, along the Roum fault (Darawcheh et al., 2000) and onto the JGF (Wechsler et al., 2009) or that what is described as one earthquake in the historical record was actually a series of events, one triggering the other, that were amalgamated in the historical record. Some of the ruptures recorded in the paleoseismic record could be either the rupture tip of an earthquake that originated on another fault segment (north or south of the site) or a triggered event on the JGF that would not merit its own historical mention. An example for an earthquake that originated to the north is the 1202 C.E. event, which was centered on the Yammouneh fault but also ruptured all the way south through the JGF and maybe even farther south.
Other known historical earthquakes that were not centered on the JGF, but which may have either ruptured to the Sea of Galilee or triggered slip or an aftershock include earthquakes in 33, 130, 303, 347, 363, 500, 634, and 660 C.E. (Fig. 9, Table 3). Considering that all detrital charcoal ages are maximum ages for the host deposit because the date reflects the growth and death of the original wood rather than its burning or deposition, some of the events we identify and date in the channel stratigraphy may have a slight bias toward an older age, in which case most may actually be represented in the historical record. In any case, a slight shift in event ages does not affect our overall conclusion that there was a cluster of earthquakes that produced surface rupture along the JGF during the first millennia C.E., followed by a relative dearth of events in the second millennia C.E.
Table 1
The channels found at the Beteiha site, with ages and general descriptions. (Modified from Wechsler et al., 2014).
Wechsler at al. (2018)
General descriptions of the channels are summarized in Table 1. Detailed trench logs are available in the E. supp. of this paper, Fig. S1 and unit descriptions are in Table S2. In the following section, we describe the channel reconstructions along with the channel ages and their relationships to the offsets, and then follow with probable correlations to historical earthquakes.
Tying the offsets to event ages. The events that were recognized by Wechsler et al. (2014) are represented by their age probability density functions (pdfs) as generated by Oxcal, and color coded by channel. For each event, an associated offset is attached. Colored boxes at the top represent the age extent of each channel's sediments. Historically known earthquakes are marked by grey lines. There is an age uncertainty as to the age of the oldest units in channel 4 (units 490–499) marked by a dashed rectangle. Inset – the result of the CVt calculation for the earthquake ages.
JW: Shape of events at 1202 and 1759 on this plot understate uncertainty and present unrealistic probability distributions - because these two events came from older work where such a probability density vs. time plot wasn't generated. Event E.H. 1 dates to between 1020 and 1280 CE and very likely reflects the 1202 CE earthquake. Event E.H.2 struck after 1415 CE but it is not known how long after. It could have been a result of a number of different earthquakes such as the 1546, 1759, and 1837 earthquakes. Marco et al (2005) favored the 1759 CE earthquake but considered the possibility of other earthquakes.
Wechsler at al. (2018)
Table 3 and Fig. 8 summarize the event ages and the offsets attributed to each event. The earthquake ages were used for calculating the mean recurrence time between events and the corresponding coefficient of variation on timing (CVt), using a Monte-Carlo approach: the probability density functions (pdfs) of event ages are sampled thousands of times and the mean μ, standard deviation σ and CVt are calculated on the sampled set (Biasi, 2013; Zielke et al., 2015). The resulting mean recurrence time is 190 years and the CVt is 1.05 (Fig. 8b), which implies elevated periods of seismic activity followed by periods of quiescence, or clustered behavior. In the following section we discuss our results in light of the historical record of earthquakes and the known paleoseismic record on neighboring faults.
Table 3
Modeled earthquake dates and offset estimates for each. Historical candidate earthquakes that could have caused the offset are listed based on modeled age.
Wechsler at al. (2018)
The 1759 CE and 1202 earthquakes have 0.5 and 2.2 m of horizontal displacement attributed to them, respectively; the 1202 offset is the largest slip-per-event recorded at the site. The pre-1202 offset of Channel 2 of about 1.3 m is interpreted to represent slip in one moderately large earthquake. Channel 3 records one moderately large slip event of about 1.2 m, and possibly one additional small earthquake based on the cross-fault stratigraphy (Wechsler et al., 2014), although the displacement is virtually the same as that of Channel 2 suggesting that events CH2-E1 and CH3-E1 are the same event as indicated by their nearly identical ages.
Deposits in Channel 4 record evidence for six earthquakes in addition to those of Channels 1 through 3 (Wechsler et al., 2014); two of them affected the upper units with resolved additional cumulative slip 2.7 +2/−2.5 m. Likely both are moderate in size, each with about 1.3 m of horizontal slip, although it is possible that one of the two events may have significantly larger offset, as in 1202 CE, while the other may be a smaller, 1759-style event. We cannot rule out the possibility that there may be >2 events that contributed to the difference in offset between channels 3 and 4, but we lack records for such events due to a disconformity in the deposition sequence.
From historical records and paleoseismology, the Yammouneh segment ruptured in 1202, between 405 and 945 CE and between 30 BCE and 469 CE (Daëron et al., 2007; Fig. 8). The penultimate Yammouneh rupture could be one of the mid-8th century earthquakes (CH2-E1 or CH3-E1, which are probably the same event). During that period, three distinct earthquakes occurred in the region and were felt from Syria in the north to Petra in the south (Fig. 1a): the first around 746 CE, the second in 749 CE and the third around 757 CE, and while the second of which most likely ruptured the Jordan Valley segment, the first or the third could have been associated with the Yammouneh fault (Ambraseys, 2005, 2009).
The JVF is interpreted to have ruptured in the earthquakes of 1033 CE, 749 and 363 based on both paleoseismic and historical records (Alfonsi et al., 2013, Ambraseys, 2009, Ferry et al., 2011, Fig. 8). Thus, the events with resolved offset at the Beteiha site could have from local earthquakes on the Jordan Gorge segment of the DST. This does not mean that the Jordan Gorge fault ruptured at precisely the same time, as historical records often refer to an earthquake as lasting for weeks or months and a large aftershock on the Jordan Gorge fault could have been amalgamated into the main-shock event. Thus, the observed displacements that we document here (CH2-E1) could have been coseismic with a well-known historical event or they could have been separate events that were induced or triggered by the larger regional events, although in this case the displacement may be smaller than the detection threshold of this study.
The first event documented by Wechsler et al. (2014) in channel 3 sediments (CH3-E1) is considered either quite small (less than 0.5 m offset) or the same as CH2-E1, as discussed above. The lack of datable material from the capping units prevents dating the CH3-E1 event horizon more accurately and distinguishing between it and CH2-E1. To resolve, we use the dates from Channel 2 as the upper bound and date it to the mid-7th to mid-8th century CE (Table 2, Fig. 4). The two candidate historical earthquakes for that period are the 632/634 CE and the 659/660 CE events. The 634 earthquake occurred concurrently with the appearance of a comet, causing great consternation yet little damage in the area (Ambraseys, 2009; Guidoboni, 1994). The 660 earthquake caused extensive damage in the Jordan valley and damage in settlements throughout the region. The earthquake most likely ruptured at least part of the JVF and had documented strong aftershocks (Ambraseys, 2009).
The second event seen in channel 3 sediments (CH3-E2) dates to the 6th century CE. During that period of time several earthquakes are known to have caused damage in the region, including the 502 CE and 551 earthquakes. Both earthquakes caused damage mostly on the Lebanese and Palestinian coast, and according to damage reports, the 551 event was the stronger of the two earthquakes (Ambraseys, 2009). Paleoseismic studies point to the offshore Lebanese thrust system as the most likely source of the 551 earthquake (Elias et al., 2007), and it is possible that such a large event (estimated magnitude 7.5, Ben-Menahem, 1979) may have triggered movement on the JGF via the Roum fault, where paleoseismic evidence places the most recent event sometime after 84–239 CE (Nemer and Meghraoui, 2006). The 4th–8th century period is relatively well documented historically, so a historically “missing” event with >1 m of slip is not likely (Zohar et al., 2016), so we interpret CH3-E2 as either associated with the 502 CE or 551 earthquakes.
The two youngest events in channel 4 sediments, CH4-E1 and E2, are associated with 2.7 +2/−2.5 m of offset. This amount may represent two events of comparable magnitude, similar to the channel 3 and channel 2 offsets, or it may represent one larger and one smaller event, similar to the 1202 and 1759 CE offsets. There may even be an additional event between channel 4 and channel 3, which contributes slip to the overall measured offset, although evidence for such an event is lacking due to a gap in the sediment record (Fig. 8). Candidate earthquakes that caused the offset include historical events in the 303, 347 and 363 CE. The 303 earthquake caused damage mostly along the southern Lebanese coast whereas the 347 earthquake caused local damage that is only reported from Beirut, Lebanon. The 363 event was actually 2 earthquakes that caused extensive damage in the region, from Aqaba and Petra, Jordan, south of the Dead-Sea (Klinger et al., 2015) all the way to Paneas, north of the Sea of Galilee, and most likely one of them ruptured the Jordan Valley segment. Archaeological excavations in Sussita, east of the Sea of Galilee, revealed major destruction of an Odeion and Roman basilica, where coins found beneath the collapsed structures are dated to as late as 362 CE (Wechsler and Marco, 2017). It is reasonable to assume that the 363 earthquake rupture reached as far north as the Beteiha valley and that it is part of the measured 2.7 +2/−2.5 m offset of the youngest two events in channel 4.
Figure 9
Coulomb Stress modeling (using Coulomb 3.3, Toda et al., 2011) of the area using a simplified fault model of the DST from the Jordan Valley segment to the Lebanese restraining bend (not including the Mt. Lebanon thrust).
In each model, an earthquake was applied on one fault (marked in dashed red line), based on rupture estimates for the last earthquake on that fault (left-lateral strike slip). The resulting Coulomb Stress change on the neighboring faults was calculated.
See Table S1 for model parameters of each run.
Wechsler at al. (2018)
In order to test the feasibility of multi-segment ruptures on the JGF, a simplified model of the DST from the Jordan Valley segment to the Lebanese restraining bend (not including the Mt. Lebanon thrust) was constructed for Coulomb stress modeling. Fault orientations, dips and locking depths were taken from the literature or assumed based on surface geometry and topography (Table S1). The kinematics of the fault movement were estimated based on existing literature and fault geometry (see Table S1). We did not incorporate a creeping section along the northern JVF, to keep the model simple. In each model run, a rupture was initiated on one fault, based on displacement estimates for the last earthquake on that fault. The resulting Coulomb Stress change on the neighboring faults was calculated using Coulomb 3.3 code (Toda et al., 2011). For comparison, the typical stress drop in a surface-rupturing earthquake can range between 0.5 and 50 MPa (Allmann and Shearer, 2009), and an increase of as little as 0.1 MPa (1 Bar) in the Coulomb stress is considered in the literature as effective for triggering earthquakes (King et al., 1994).
It was found that the stress increases by at least 0.1–0.2 MPa on the JGF in all cases of rupture on nearby faults, and most strongly for large events originating on the Yammouneh or Jordan Valley faults (Fig. 9). Additionally, the model demonstrated that a large earthquake on the Yammouneh fault would un-stress and therefore delay the other Lebanese faults. The coulomb stress transfer model, while being very simple, still shows how the JGF location makes it primed for offset in the event of rupture of a nearby fault, which explains the relatively large number of moderate events observed from the trench data.
Ellenblum et al. (1998, 2015) excavated the archaeological site of Ateret (Vadum Iacub), which was constructed across the JGF about 12 km north of our paleoseismic site. They found an early Hellenistic (333–143 BCE) wall that was offset 6 m, and another late Hellenistic (143–63 BCE) wall that was estimated to be offset only 3.5 m. At our site, the cumulative offset for the last 1700 years is at least 7 m, and based on the overall slip rate it should be about 8–9 m for Hellenistic period features. It would be expected that the two sites would have similar amounts of displacement for similar amounts of time, yet the Ateret site appears to accommodate a lesser amount of cumulative slip, even ignoring the extremely low estimated offset of the late Hellenistic wall. This is also true for the 1202 CE rupture offset, estimated to be 1.5 m at Ateret, versus 2.2 m at the Beteiha site.
This difference of ~30% less slip at the Ateret site may be explained by its location astride a branch of the JGF which is near a trifurcation point and some of the offset is taken by other branches (Fig. 9). A normal fault branches to the north-west immediately south of the archaeological site, causing a left bend in the Jordan River and offsetting Pleistocene strata. Additionally, a fault strand parallel to the Ateret branch and marked as the main continuation of the JGF northward is mapped just north of the junction, east of the site (Fig. 10). Those faults and perhaps other unknown fault(s) that are immediately adjacent to the archaeological site may accommodate some of the offset. This is supported by GPS campaign data across the JGF south of the Ateret site and the branching point, which indicate a locked fault with a slip rate of 4.1 ± 0.8 mm/yr (Hamiel et al., 2016), in agreement with the paleoseismic slip estimates from the Beteiha site (this study).
We resolved slip per event for the past six surface ruptures at the Beteiha paleoseismic site, with slip estimates ranging from 0.5 to 2.2 m, a factor of more than four (Table 3) and a corresponding CVs value of 0.5–0.6. Although at first glance, this range of offsets argues against the characteristic earthquake model (Schwartz and Coppersmith, 1984), when local and regional structure is considered, the model may still apply in some cases. For instance, the largest displacement is associated with the 1202 earthquake, which is known to have ruptured the Bekka Valley with several meters of displacement (Daëron et al., 2007).
The Beteiha site may be near the southern terminus of the 1202 rupture, although it is not known whether the rupture terminated in the Sea of Galilee or propagated as far south as the Jordan Valley. As mentioned earlier, the crusader fortress of Belvoir, located only 13 km south of the Sea of Galilee, was not damaged in the 1202 earthquake indicating that rupture did likely stop at the Galilee releasing step. In contrast, damage from the October 1759 earthquake rupture is centered on the Jordan Gorge fault (Ambraseys and Barazangi, 1989; Sieberg, 1932), and 50 cm of offset at Ateret is attributed to this event, suggesting that this event ruptured only the short, 40 km-long segment of the DST that includes the Jordan Gorge and the east side of the Hula Valley until the NE-bend in the fault, or perhaps even only the 20 km long JGF.
Potentially, this earthquake may have also ruptured the Rachaya fault in Lebanon (Daëron et al., 2005), although conversely, it is possible that the Rachaya ruptured together with the Serghaya fault in the larger November 1759 event (Gomez et al., 2003). Thus, one plausible model is that small, half-meter events may represent rupture of only the 20 km-long JGF, whereas the large 1.2–2.2 offsets represent displacement in larger earthquakes that ruptured either to the north (1202 CE) or south (749, 363 CE).
In transition zones between simple and complex sections of plate boundary faults, repeating earthquakes with similar displacement and rupture extent (i.e., characteristic earthquakes) may be an over-simplified model that should not really be expected to conform to reality. It should be noted that resolving 0.5 m of slip is generally beyond the accuracy limits of this study, so while there may be other 1759-style rupture events, they have not been detected. It is possible that one or more of the channel 4 events are of the smaller 1759-offset type.
- Earthquake Archeological
Effects from Rodríguez-Pascua et al (2013: 221-224)
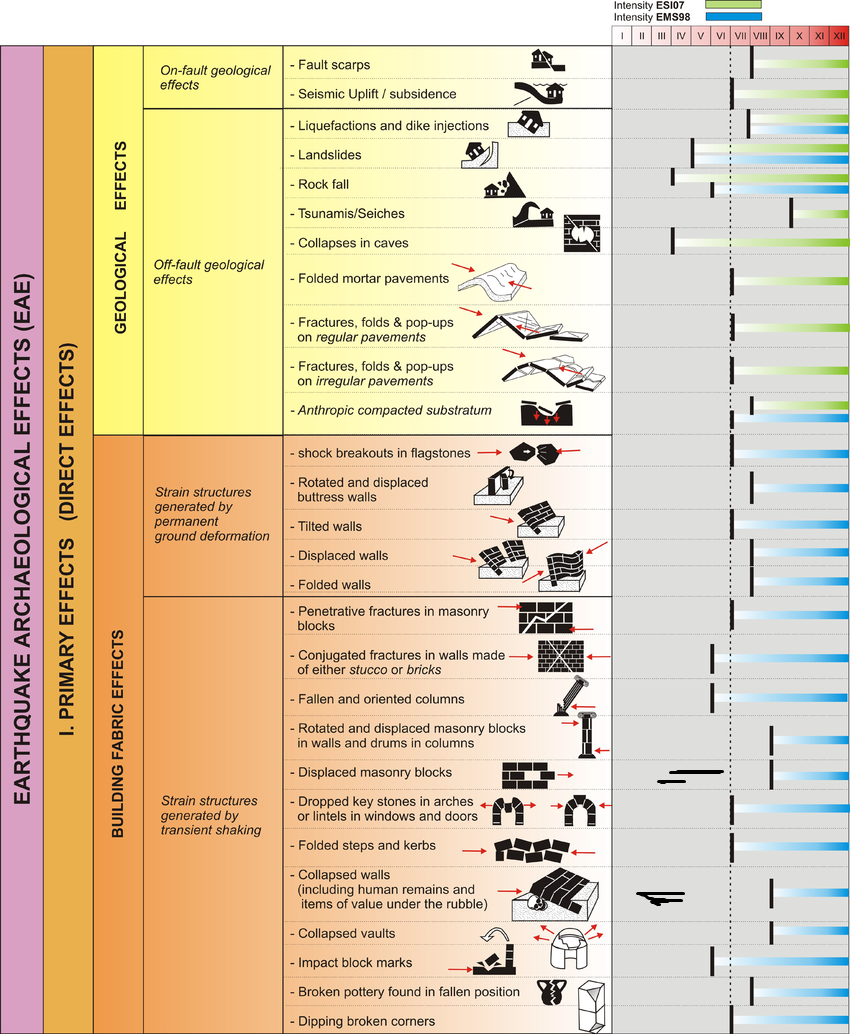 Earthquake Archeological
Effects Chart
Earthquake Archeological
Effects Chart
Click on image to open in a new tab
Rodríguez-Pascua et al (2013) - Environmental Effects (ESI 2007)
 Graphic Representation of
ESI 2007 Intensity
Graphic Representation of
ESI 2007 Intensity
Click on image to open in a new tab
- Synoptic Table of ESI 2007
Intensity Degrees from Michetti et al. (2007)
 Synoptic Table of ESI 2007
Intensity Degrees
Synoptic Table of ESI 2007
Intensity Degrees
Accuracy improves in higher degrees, especially VIII–XII.
Click on image to open in a new tab
Michetti et al. (2007)

| Event | Modeled Age | Possible Quakes (Wech14, Wech18, Marco05) |
Assigned Quake (Williams) | Offset Estimate (m) (Wech18, Marco05) |
Moment Magnitude Estimate (WC94) | Intensity Estimate (JW) |
|---|---|---|---|---|---|---|
| CH4-E6 | 392 BCE - 91 CE | 33 CE 31 BCE 92 BCE ~150 BCE |
Northern Dead Fish and Soldiers Quake (~142 BCE) ? | Unknown | 6.5+ | VII+ |
| CH4-E5 | 137-206 CE | 130 CE | Eusebius Mystery Quake/
Incense Road Quake or An Unknown Quake |
Unknown | 6.5+ | VII+ |
| CH4-E4 | 165-236 CE | Unknown Earthquake | Capitolias Theater Quake (~250 CE) | Unknown | 6.5+ | VII+ |
| CH4-E3 | 250-310 CE | 303 CE | Eusebius Martyr Quake (303-306 CE) | Unknown | 6.5+ | VII+ |
| CH4-E2 | 269-329 CE | 303 CE 347 CE |
Beirut Conversion Quake (347/348/349 CE) | 2.7 m for CH4-E2 and CH4-E1 | 6.5+1 | VII+ |
| CH4-E1 | 294-369 CE | 303 CE 347 CE 363 CE |
Northern Cyril Quake (363 CE) | 2.7 m for CH4-E2 and CH4-E1 | 7.1-7.41 | VIII+ |
| CH3-E2 | 505-593 CE | 502 CE 551 CE |
551 CE Beirut Quake (551 CE) or Fire in the Sky Quake (502 CE) |
1.2 | 6.9-7.1 | VIII+ |
| CH3-E1 | 662-757 CE (Wech 14 had this age as 619-694 CE) |
659 CE | Jordan Valley Quake (659 CE) or Sword in the Sky Quake (634 CE) |
small | 6.5+ | VII+ |
| CH2-E1 | 675-801 CE | 746/749 CE 757 CE |
Holy Desert Quake of the Sabbatical Year Quake Sequence (749 CE) | 1.3 | 6.9-7.1 | VIII+ |
| E.H. 1 | 1020 - 1280 CE | 1202 CE | 1202 CE Earthquake | 2.2 | 7.1-7.3 | VIII+ |
| E.H. 2 | post dates 1415 CE | 1759 CE | 1759 CE Safed Quake or 1837 CE Safed Quake | 0.5 | 6.6-6.9 | VIII+ |
Tom Rockwell (personal correspondence, 2022) relates the following:
In our 2014 paper, we show a map of the site, which includes our original locator trench - T30 - in which we searched for channels. For Neta's post-doc work, we focused on the northern set of channels, but look at the ages of the southern several channels - they fill in time periods that we didn't investigate. I believe that area is still open for study - was a bit salty for the farmers.
T30 Trench Log
from Tom Rockwell (email 30 March 2022)