Tiberias - Seismo-Tectonics
- Fig. 4 Map of Ancient Tiberias
with inferred fault and sites studied by Ferrario et al (2020)

 Figure 4
Map of ancient Tiberias (modified after Hirschfeld & Gutfeld, 2008) with indication of the inferred lineament and trench position.
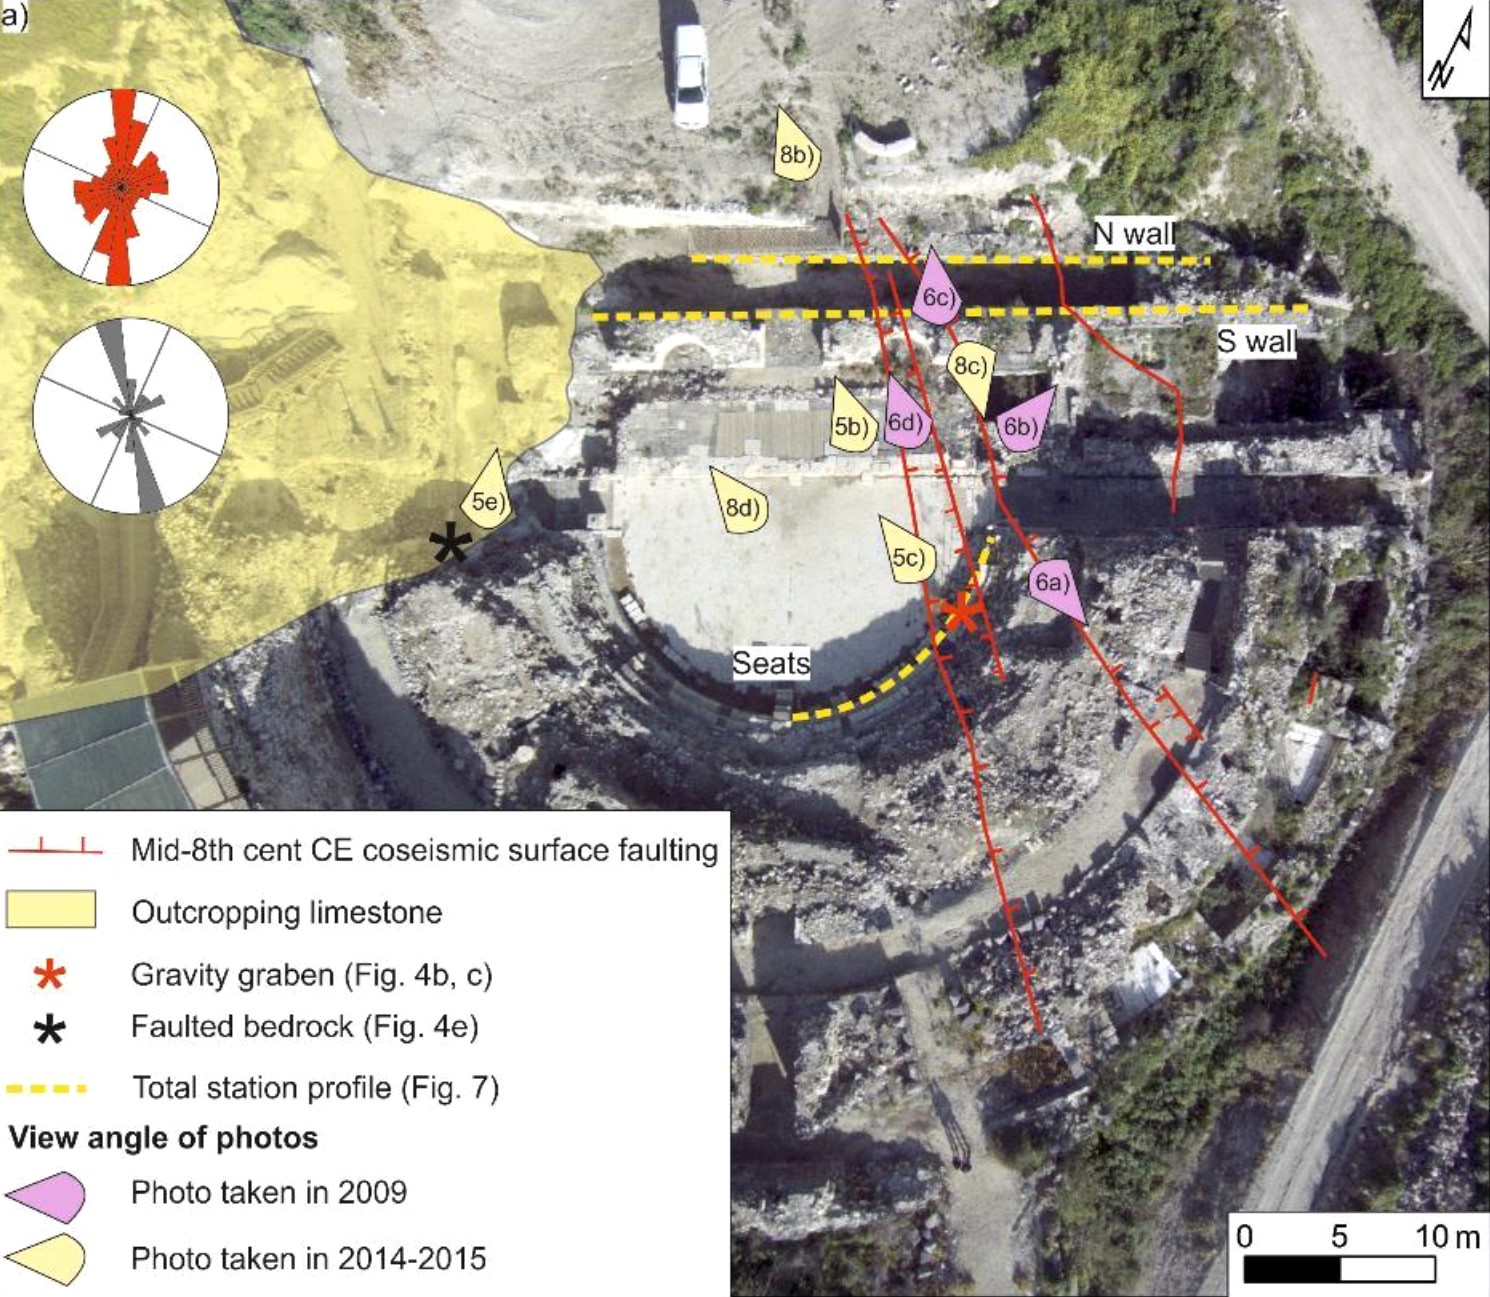
Ferrario et al (2015) - Fig. 4a Map of surface ruptures
in the Beriniki Theatre from Ferrario et al (2020)

 Figure 4a
map of ruptures across the Theatre, rose diagrams (bin size 15°) show fractures on archaeological relics from the whole site (red, n° 100) and on the orchestra floor (grey, n° 23); picture view angles (the figure number showing each picture is indicated) and trace of total station profiles are shown as well
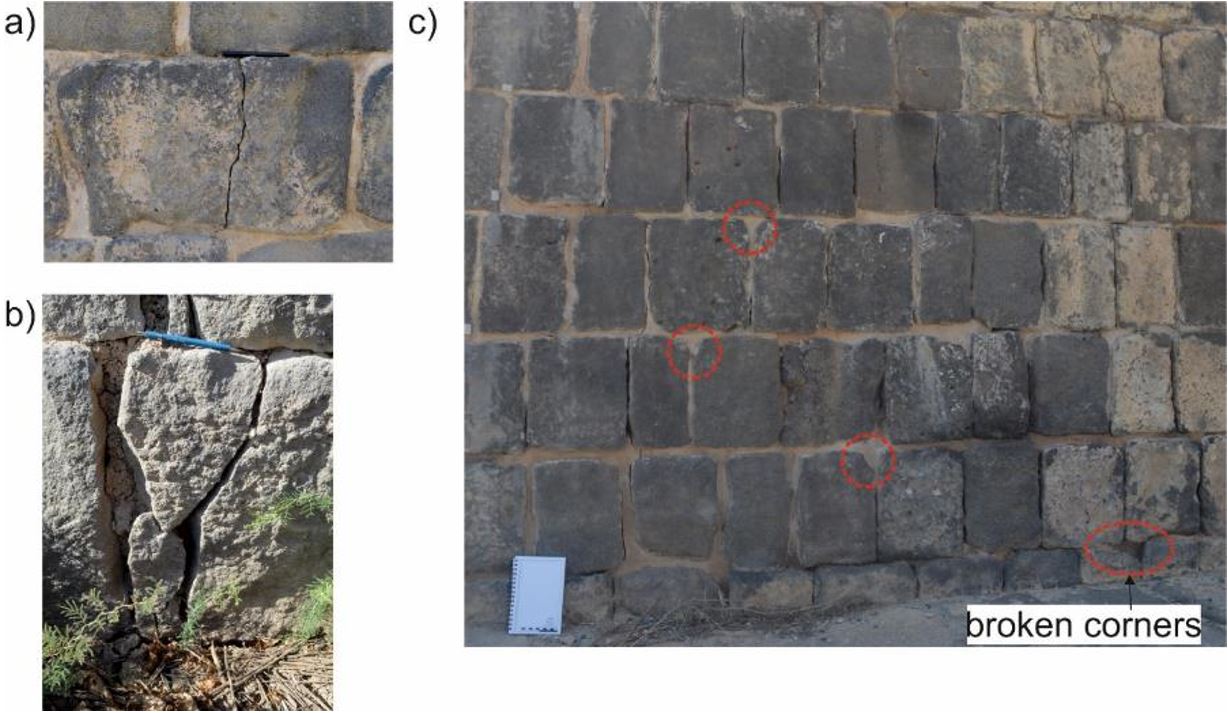
Ferrario et al (2020) - Fig. S14 fractures in
building stones from Ferrario et al (2020)

 Figure S14
a) example of a fracture affecting a ca. 40-cm high building stone at Tiberias theatre
b) fracture affecting a corner of a building stone, Tiberias theatre
c) broken corners, Tiberias theatre.
Ferrario et al (2020) - Fig. 6d inclined fractures
in water reservoir from Ferrario et al (2020)

 Figure 6d
set of fractures affecting an Umayyad water reservoir, located in between the Theatre and the Southern Gate.
Ferrario et al (2020) - Fig. 10 reconstruction of
shallow subsurface from Ferrario et al (2020)

 Figure 10
Schematic sketches of the shallow subsurface at three key positions:
a) Theatre
b) Southern Gate
c) Hamat hotsprings
d) section traces.
Information on geology is derived from the Israeli geological map (Sneh, 2008), published scientific literature (e.g., Hurwitz et al., 2002) and local reports (e.g., Zaslavsky, 2009). Boreholes logs are from GSI archive
Ferrario et al (2020) - Fig. 10a Section through
the Berniki Theater from Ferrario et al (2020)

 Figure 10 a
Schematic sketch of the shallow subsurface at the Theatre
Ferrario et al (2020) - Fig. 10b Section through
the Southern Gate from Ferrario et al (2020)

 Figure 10 b
Schematic sketch of the shallow subsurface at the Southern Gate
Ferrario et al (2020) - Fig. 10c Section through
the Hamat hotsprings from Ferrario et al (2020)

 Figure 10 c
Schematic sketch of the shallow subsurface at the Hamat hotsprings
Ferrario et al (2020) - Fig. 9 Seismic sections
from Ferrario et al (2020)

 Figure 9
Seismic lines and relative interpretation; traces in Fig. 2a.
a) Southern Gate
b) Beriniki Beach landslide
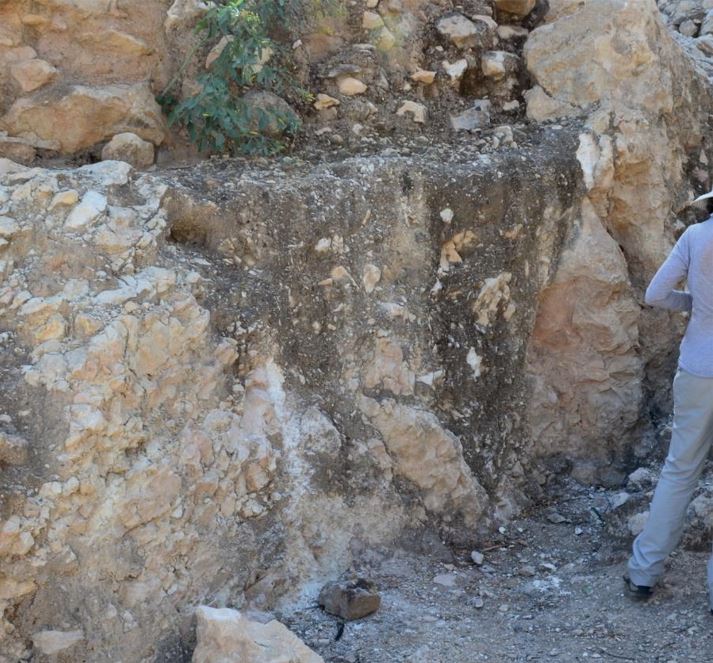
Ferrario et al (2020) - Fig. 4e Fault gouge
from Ferrario et al (2020)

 Figure 4e
detail of the limestone normal fault gouge
Ferrario et al (2020)
Ferrario et al (2020) detailed surface faulting evidence as follows:
We measured dip and dip direction of 123 fractures (in masonry blocks) in the Theatre and 59 in the Southern Gate (Table S2). They are Mode I fractures (opening fractures), affecting walls and building stones. Generally, they break the entire stone height, albeit in some cases they affect a single corner of the building stone (see Fig. S14Ferrario et al (2020) summarized why they considered surface faulting the causitive mechanism for much of the observed damage as follows:for examples). The strike of the fractures has a modal value of 160° and 140° in the whole Theatre and the orchestra floor, respectively (see rose diagrams in Fig. 4a
Figure S14
a) example of a fracture affecting a ca. 40-cm high building stone at Tiberias theatre
b) fracture affecting a corner of a building stone, Tiberias theatre
c) broken corners, Tiberias theatre.
Ferrario et al (2020)). These values are broadly consistent with the direction of the gravity graben found within the Theatre.
Figure 4a) map of ruptures across the Theatre, rose diagrams (bin size 15°) show fractures on archaeological relics from the whole site (red, n° 100) and on the orchestra floor (grey, n° 23); picture view angles (the figure number showing each picture is indicated) and trace of total station profiles are shown as well
Ferrario et al (2020)
South of the Theatre, the last excavation phase during 2017 uncovered an Umayyad water reservoir. Damage is here represented by a series of steeply inclined fractures between masonry blocks, located in a ca. 1 m wide zone (Fig. 6d). The damage zone is situated along the line connecting the graben in the Theatre and the warped Byzantine wall at the Southern Gate, i.e. on the fault line.
Figure 6d) set of fractures affecting an Umayyad water reservoir, located in between the Theatre and the Southern Gate.
Ferrario et al (2020)
... Summary of the archaeoseismic observations reveals a ~300 m long segment of the [Jordan Valley Western Boundary Fault] (JVWB) [from the] Theatre to [the] Gate that ruptured the surface during an earthquake that apparently took place at the 8th century CE. Slip along the fault is normal, vertical throw is 0.5 m.
Ferrario et al (2020) discuss the nature of faulting during this event below:The lines of reasoning listed above point toward an earthquake-related damage, and more specifically to surface faulting. The damaging event is constrained to later than 530 CE and younger than the Abassid caliphate (750-1258 CE).
- The investigated sites are built on a contact between limestones and thin (few meters) alluvial deposits; the presence of shallow limestone bedrock beneath the hanging wall alluvial deposits is also confirmed by boreholes. Bedrock outcrops inside the Theatre and at the bottom of the wadi channel at the Southern Gate.
- All damaged sites are aligned along a lineament in a N140 direction, which is consistent with the structural framework of the study area.
- All our observations document a pure dip-slip normal faulting.
- The gravity-graben inside the Theatre is a feature consistent with coseismic, near- fault deformation (e.g., Slemmons, 1957; Rodriguez-Pascua et al., 2011) and possibly due to the steepening of the fault plane approaching the surface.
- Damage is consistently found in Roman levels and in the debris flow sediments uncovered in the Theatre, but the Abassid levels were not faulted nor deformed. Archaeological stratigraphy provides tight chronological constraints, based on architectural style, building techniques and materials of the findings and structures.
The reconstruction of the stratigraphic and structural setting of the shallow subsurface (Fig. 10) shows faults reaching the surface; they were constrained by direct observation at the archaeological sites (Fig. 10a
Figure 10. Schematic sketches of the shallow subsurface at three key positions:
a) Theatre
b) Southern Gate
c) Hamat hotsprings
d) section traces.
Information on geology is derived from the Israeli geological map (Sneh, 2008), published scientific literature (e.g., Hurwitz et al., 2002) and local reports (e.g., Zaslavsky, 2009). Boreholes logs are from GSI archive
Ferrario et al (2020)and 10b
Figure 10 a) Schematic sketch of the shallow subsurface at the Theatre
Ferrario et al (2020)) or presence of the hot springs (Fig. 10c
Figure 10 b) Schematic sketch of the shallow subsurface at the Southern Gate
Ferrario et al (2020)). Other faults were imaged through the seismic lines and borehole correlation. Our data suggest the presence of a fault zone some tens of meters wide, rather than a single fault. At the Theatre (Fig. 10a
Figure 10 c) Schematic sketch of the shallow subsurface at the Hamat hotsprings
Ferrario et al (2020)) and at the Northern seismic line (Fig. 9
Figure 10 a) Schematic sketch of the shallow subsurface at the Theatre
Ferrario et al (2020)), we observe to the W a fault strand at the contact between Cretaceous limestone and the Neogene-Quaternary deposits; to the E, a second fault strand lies within the Neogene-Quaternary deposits. At the Theatre, the fault gouge in Cretaceous limestones (Fig. 4e
Figure 9. Seismic lines and relative interpretation; traces in Fig. 2a.
a) Southern Gate
b) Beriniki Beach landslide
Ferrario et al (2020)) show no signs of historical displacements, whereas the archaeological structures are faulted more to the E (Fig. 4a
Figure 4e
detail of the limestone normal fault gouge
Ferrario et al (2020)). This may suggest a basinward migration of the active fault strand, consistently with previous observations at other sites along the DSF (Marco & Klinger, 2014). At the Southern Gate the fault lies within Cretaceous limestones, as deduced from archaeoseismological observations and core drillings (Fig. 10b
Figure 4a) map of ruptures across the Theatre, rose diagrams (bin size 15°) show fractures on archaeological relics from the whole site (red, n° 100) and on the orchestra floor (grey, n° 23); picture view angles (the figure number showing each picture is indicated) and trace of total station profiles are shown as well
Ferrario et al (2020)).
Figure 10 b) Schematic sketch of the shallow subsurface at the Southern Gate
Ferrario et al (2020)
Ferrario et al (2020) considered 3 different rupture scenarios for the mid 8th century CE earthquake which they suggest caused the observed damage:
| Scenario | Fault(s) | Fault Motion |
Rupture Length (km.) |
Rupture Width (km.) |
Mw |
|---|---|---|---|---|---|
| 1 | Jordan Valley Western Boundary Fault | Normal | 45 | 6.9 | |
| 2 | Jordan Valley Fault | Strike-Slip | 125 | 12.5 | 7.3 |
| 3 | Jordan Valley Western Boundary Fault and Jordan Valley Fault |
Normal and Strike-Slip |
170 | 12.5 | 7.6 |
complete fault ruptures may be obstructed by structural thresholds. For Scenario 1, they used a scaling relationship from Wesnousky (2008:1620 - Fig. 8) for Normal Faults which has a quality score of 1 (i.e. best available) according to Stirling et al. (2013)
Mw = 6.12 + 0.47*log10(L)
L = Length of rupture (km.)
For Scenarios 2 and 3, they used a scaling relationship from Hanks and Bakun (2008:490 - Eqn. 4) for a Fault Area > 537 km.2. This scaling relationship has a quality score of 1 (i.e. best available) according to Stirling et al. (2013)
Mw = 4/3*log10(A) + (3.07 ± 0.04)
A = Fault Area (km.2)
The scaling relationships chosen followed recommendations of Stirling et al. (2013) and were of subclass A2 (Slow Plate boundary faults with slip less than 10 mm./year) which is appropriate for the Dead Sea Transforms which is estimated to slip at 4-5 mm/year Garfunkel et al (2014).
| Variable | Input | Units | Notes |
|---|---|---|---|
| km. | |||
| km. | |||
| Variable | Output | Units | Notes |
| unitless | Moment Magnitude computed using Wesnousky (2008) | ||
| km.2 | |||
| unitless | Moment Magnitude computed using Hanks and Bakun (2008) |
Ferrario, M. F., et al. (2020). "The mid-8th century CE surface faulting along the
Dead Sea Fault at Tiberias (Sea of Galilee, Israel)." Tectonics 39(9).
Hanks, T. C. and W. H. Bakun (2008). "M-log A observations for recent large earthquakes." Bulletin of the Seismological Society of America 98(1): 490-494.
Marco, S. and Y. Klinger (2014). Review of On-Fault Palaeoseismic Studies Along the Dead Sea Fault.
in Dead Sea Transform Fault System: Reviews. Z. Garfunkel, Z. Ben-Avraham and E. Kagan. Dordrecht, Springer Netherlands: 183-205.
Stirling, M., et al. (2013). "Selection of Earthquake Scaling Relationships for Seismic-Hazard Analysis." The Bulletin of the Seismological Society of America 103: 2993-3011.
Wesnousky, S. (2008). "Displacement and Geometrical Characteristics of Earthquake Surface Ruptures: Issues and Implications for Seismic-Hazard Analysis and the Process of Earthquake Rupture."
Bulletin of The Seismological Society of America - BULL SEISMOL SOC AMER 98.