Nimrod
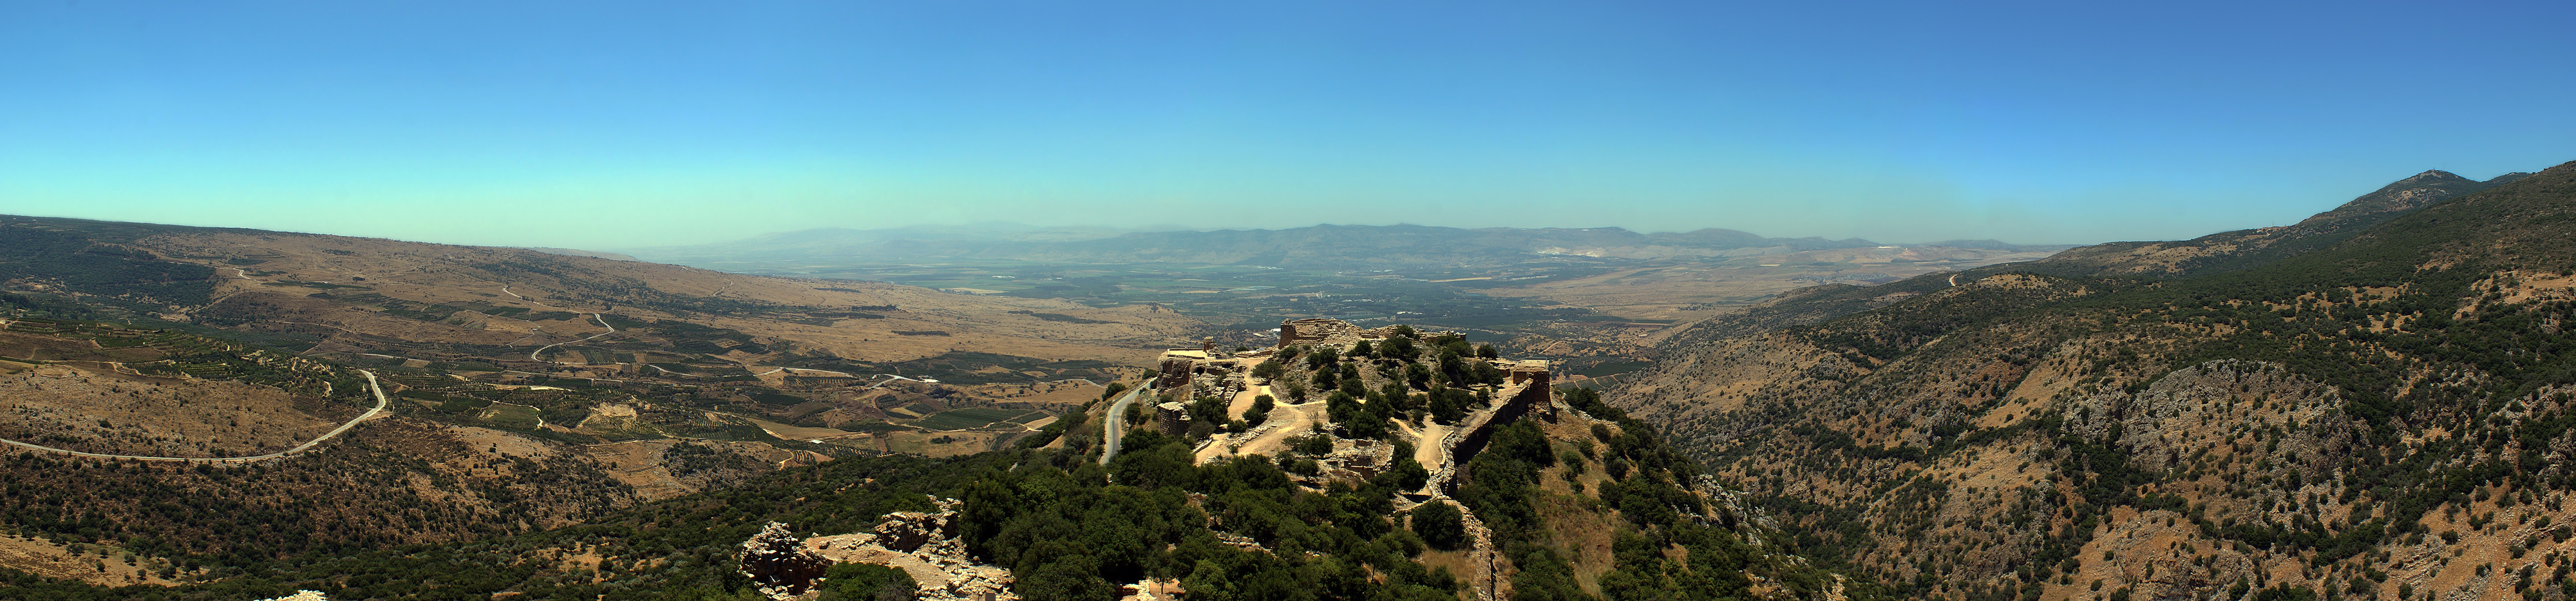 Nimrod's Fortress, looking West.
click on tab to open a magnifiable image in a new tab
Green slash Wikipedia - CC BY-SA 3.0
| Transliterated Name | Language | Name |
|---|---|---|
| Nimrod Castle | English | |
| Nimrod Fortress | English | |
| Qal'at Namrud | Arabic | |
| Qal'at al-Subeiba | Arabic | قلعة الصبيبة |
| Mivtzar Nimrod, | Hebrew | מבצר נמרוד |
- Fig. 5b - Fault Map from
Hinzen et al (2016)
 Fig. 5b
Location map of the Kalat Nimrod castle on the Golan Heights.
Hinzen et al (2016) - Fig. 5c - Geologic Map from
Hinzen et al (2016)
 Fig. 5c
Local geology and faults neighboring Kalat Nimrod after Sneh and Weinberger (2014)
Hinzen et al (2016)
- Annotated Aerial View of
Nimrod Fortress from BibleWalks.com
- Nimrod Fortress in Google Earth
 Nimrod Fortress in Google Earth
click on image to explore this site on a new tab in Google Earth - Nimrod Fortress on govmap.gov.il
 Nimrod Fortress on govmap.gov.il
click on image to explore this site on a new tab in govmap.gov.il

- Plan of Nimrod Fortress from
BibleWalks.com
- Plan of Nimrod Castle from
Stern et al (1993)
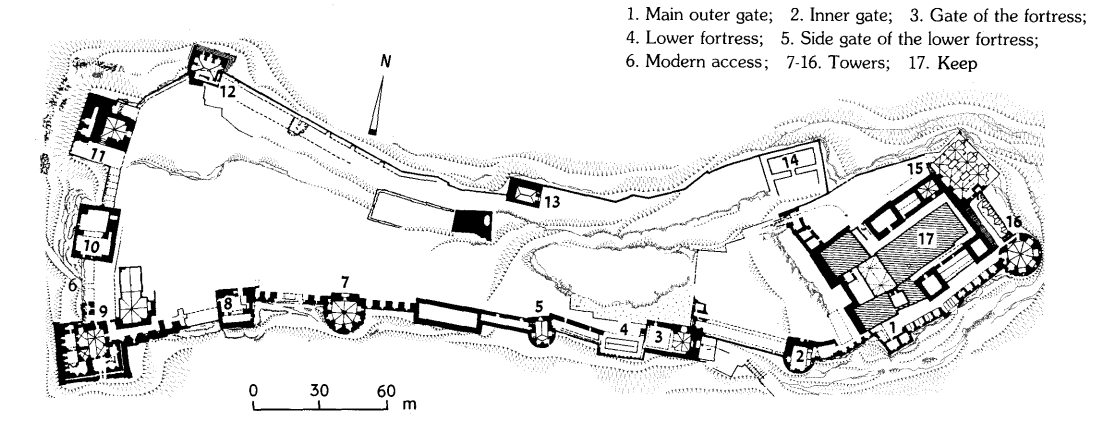 Plan of Nimrod Castle
- 1. Main outer gate
- 2. Inner gate
- 3. Gate of the fortress
- 4. Lower fortress
- 5. Side gate of the lower fortress
- 6. Modern access
- 7-16. Towers
- 17. Keep
Stern et al (1993) - Plan of Nimrod Fortress from
Stern et. al. (2008)
 Nimrod fortress: plan of the site
- 1. Main outer gate
- 2. Inner gate
- 3. Gate of the fortress
- 4. Lower fortress
- 5. Side gate of the lower fortress
- 6. Modern access
- 7-16. Towers
- 17. Keep
Stern et. al. (2008) - Fig. 6 - Plan of Nimrod Castle
with arch damage locations from Hinzen et al (2016)
 Fig. 6
Plan of the Kalat Nimrod castle based on the work of Deschamps (1939) and Hartal (2001). Superimposed on the major structural elements of the fortification are the 95 arches listed in Table 1. The center of each arrow represents the position of an arch, the arrow head points to the right when looking at the arch from the outside, and the arrow length varies with the span of the arch. Labels are those from Table 1. The axis units are in meters, the origin of the local coordinate system was chosen at the southwestern corner of the fortress.
Hinzen et al (2016) - Fig. 9 - Plan of Nimrod Castle
with Arch Damage Grades (ADGs) from Hinzen et al (2016)
 Fig. 9
On top of the map from Figure 5 the ADGs of all 90 evaluated arches are plotted. The range of values is indicated by the legend. Five zoom windows give an enlarged view of sections with dense arch coverage. At towers with arches A12.x and A8.x higher ADGs are found on the western side of the structures. For the huge tower with the arches A19.x at the northeastern corner of the fortification, the damage at the outer edge of the tower is greater than at the hill side. At the large rectangular tower at the southwestern corner, no pattern in the distribution of the damage degree was found.
Hinzen et al (2016)

- Fig. 10 - The Secret Passage
from Hinzen et al (2016)
 Fig. 10
- Perspective view from east toward the laser scan model of the secret passageway of the gate tower of Kalat Nimrod castle. Major parts of the passage are labeled. The intensity of points changes with the individual scans, which were combined into this single image
- Floor plan of the gate tower after Hartal (2001)
- Orthographic view from above to the secret passageway. The light shaded ashlars moved downward by 0.10–0.15 m as shown by the crosscuts (d1–5)
- Measured displacement of blocks from the section marked in panel (c)
Sections start at the top and are separated by 1 m distance. The gray parts indicate the two staircases. The light stripe shows the location of the two loophole openings, and the dashed lines indicate the two bends of the passage.
Hinzen et al (2016)
- Fig. 10 - The Secret
Passage from Hinzen et al (2016)
Fig. 10
- Perspective view from east toward the laser scan model of the secret passageway of the gate tower of Kalat Nimrod castle. Major parts of the passage are labeled. The intensity of points changes with the individual scans, which were combined into this single image
- Floor plan of the gate tower after Hartal (2001)
- Orthographic view from above to the secret passageway. The light shaded ashlars moved downward by 0.10–0.15 m as shown by the crosscuts (d1–5)
- Measured displacement of blocks from the section marked in panel (c)
Sections start at the top and are separated by 1 m distance. The gray parts indicate the two staircases. The light stripe shows the location of the two loophole openings, and the dashed lines indicate the two bends of the passage.
Hinzen et al (2016)
- Fig. 11 - Plan of Gate Tower
from Hinzen et al (2016)
 Fig. 11
Detailed plan of the gate tower (see Fig. 6). The plan shows the main features of the tower at different levels. The large arrows (not to scale) indicate the interpreted ground motion and structural reaction. The plan of the tower follows the work by Hartal (2001).
Hinzen et al (2016)
- Reconstruction of Tower 9
from Stern et. al. (2008)
 Reconstruction of Tower 9
Stern et. al. (2008)
As the site has not been fully systematically excavated, the date of seismic damage is conjectural. It happened sometime after the fortress was first built in the early 13th century, possibly in more than one event. Potential candidates are discussed below.
- Fig. 5c - Geologic Map from Hinzen et al (2016)
Fig. 5c
Local geology and faults neighboring Kalat Nimrod after Sneh and Weinberger (2014)
Hinzen et al (2016)
The bulk of the damage may have occurred during the 1759 CE Safed and Baalbek Quakes where high levels of seismic intensities would have likely been experienced at the site. Hinzen et al (2016:3-4) suggested that
most of the observed damagewas caused by the 25 Nov. 1759 CE Baalbek Quake while noting that they could not rule out that some less extensive damage occurred during the 30 Oct. 1759 CE Safed Quake. The reverse seems to be the case.
Hinzen et al (2016:4), while citing Ambraseys and Barzanagi (1989), appears to have underestimated the Magnitude of the 30 Oct. 1759 CE Safed Quake at ~6.2. Ambraseys and Barzanagi (1989) estimated the surface magnitude of this earthquake at 6.0 plus in their abstract and ~6.6 on page 4010. ~6.6. is their surface magnitude estimate. Daeron et al (20015) produced what appears to be improved estimates of Magnitudes and fault breaks for both 1759 CE earthquakes. Magnitudes and distances from both publications are summarized below:
| Earthquake | Ambraseys and Barazangi (1989) | Daeron et. al. (2005) |
|---|---|---|
| 30 Oct. 1759 CE Safed Quake | ~6.6 | 6.4 - 7.3 |
| 25 Nov. 1759 CE Baalbek Quake | ~ 7.4 | 7.0 - 8.0 |
| Earthquake | Approx. Epicentral Distance (km.) | Approx. Fault Distance (km.) |
|---|---|---|
| 30 Oct. 1759 CE Safed Quake | 5 | 2.5 |
| 25 Nov. 1759 CE Baalbek Quake | 89 | 15 |
| Earthquake | Average Iest | Range of Iest |
|---|---|---|
| 30 Oct. 1759 CE Safed Quake | 10 | 9-11 |
| 25 Nov. 1759 CE Baalbek Quake | ~ 9.5 | 7.5-11 |
- Fig. 5c - Geologic Map from Hinzen et al (2016)
Fig. 5c
Local geology and faults neighboring Kalat Nimrod after Sneh and Weinberger (2014)
Hinzen et al (2016)
In considering the possibility that the 1837 CE Safed Quake damaged the site, Hinzen et al (2016:3) reports that George Robinson described Nimrod Castle
in a detailed accountshortly after the 1837 CE Safed Quake. According to Hinzen et al (2016:3), Robinson stated that the fortress had
suffered damage by an ancient earthquake. I could not find this description in Volumes 1 or 2 by Robinson. In what appears to be the relevant part of Volume 1 (Chapter XII) describing travels that included Mount Hermon, there is a description by Robinson (1837:227) of
ruins of a citadel, overthrown by an earthquake some years agohowever this citadel is located near to or, more likely, adjacent to Tiberias.
| Effect(s) | Location | Image(s) | Description |
|---|---|---|---|
| Dropped Keystones in Arches | East-West Oriented Arches in the Gate Tower and elsewhere
Fig. 6 Plan of the Kalat Nimrod castle based on the work of Deschamps (1939) and Hartal (2001). Superimposed on the major structural elements of the fortification are the 95 arches listed in Table 1. The center of each arrow represents the position of an arch, the arrow head points to the right when looking at the arch from the outside, and the arrow length varies with the span of the arch. Labels are those from Table 1. The axis units are in meters, the origin of the local coordinate system was chosen at the southwestern corner of the fortress. Hinzen et al (2016)
Fig. 9On top of the map from Figure 5 the ADGs of all 90 evaluated arches are plotted. The range of values is indicated by the legend. Five zoom windows give an enlarged view of sections with dense arch coverage. At towers with arches A12.x and A8.x higher ADGs are found on the western side of the structures. For the huge tower with the arches A19.x at the northeastern corner of the fortification, the damage at the outer edge of the tower is greater than at the hill side. At the large rectangular tower at the southwestern corner, no pattern in the distribution of the damage degree was found. Hinzen et al (2016) |
 Nimrod Castle
Photo by Jefferson Williams (2018) |
|
| Displaced Masonry Blocks | northwestern tower (aka the Gate Tower) |
 Nimrod Castle - In the northwestern tower (aka the Gate Tower)
Used with permission from BibleWalks.com |
From an archaeoseismological perspective, this secret passageway is of particular interest and shows an extraordinary damage pattern. The complete row of ashlars east of the keystone moved vertically down by up to 0.25 m along the upper staircase and the corridor (Fig. 10). ... The uniform drop of the first voussoir east of the keystone along the whole passageway is exactly the same deformation pattern as seen in arches GT1, GT2, and GT3, which are located east of the passage with a cross section parallel to that of the corridor. The displacement of voussoirs here is between 0.17 and 0.37 m. Figure 11 shows a damage scenario which might explain the reason for the existing deformation. The sliding voussoirs indicate a strong westerly directed component of ground motion (arrows not to scale), which disturbed the static equilibrium of the arches. The whole mass of the tower moved westward, probably with increasing amplitudes toward its top. The arches opened and allowed the voussoirs to drop before the back swing of the motion closed the gap. The ground motion also induced some corner expulsion of building material at the northwestern corner of the gate tower, which in turn was responsible for the continuation of the voussoir sliding at the lower staircase. The motion was strong enough to topple the outer section of the gate tower, leaving an almost 45° west-dipping slope of the ruin. This rather strong directional motion also explains why Kamai and Hatzor (2007) were able to model the voussoir drop of the arch GT1 (Table 1, Fig. 6) in an east–west directed 2D discrete element model.- Hinzen et al (2016:9-) |
| Displaced Masonry Blocks |
 Nimrod Castle
Photo by Jefferson Williams (2018) |
||
| Dipping Broken Corners |
 Nimrod Castle
Photo by Jefferson Williams (2018) |
||
| Collapsed Walls | outer section of the gate tower
Fig. 11 Detailed plan of the gate tower (see Fig. 6). The plan shows the main features of the tower at different levels. The large arrows (not to scale) indicate the interpreted ground motion and structural reaction. The plan of the tower follows the work by Hartal (2001). Hinzen et al (2016) |
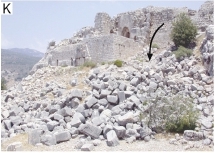 Fig. 2 K
Collapsed wall of the northern watchtowers of Kal'at Nimrod lay in disarray at the bottom of a steep slope. The large ashlars fell in 1759 Marco (2008)  Nimrod Castle - collapsed wall next to the In the northwestern tower (aka the Gate Tower)
Used with permission from BibleWalks.com  Nimrod Castle - collapsed wall next to the In the northwestern tower (aka the Gate Tower)
Used with permission from BibleWalks.com |
|
| Fractured lintels |
 Nimrod Castle
Photo by Jefferson Williams (2018)  Nimrod Castle
Photo by Jefferson Williams (2018)  Nimrod Castle
Photo by Jefferson Williams (2018) |
| Damage Type | Photo | Photographer | Comments |
|---|---|---|---|
| Displaced Keystones |
Displaced Keystones in the Gate Tower of Nimrod Castle Photo by Jefferson Williams (2018) |
Jefferson Williams 2018 |
|
| Displaced Keystones |
 Nimrod Castle
Photo by Jefferson Williams (2018) |
Jefferson Williams 2018 | |
| Displaced stones |
Nimrod Castle - In the northwestern tower (aka the Gate Tower) Used with permission from BibleWalks.com |
Yoram Hofman at BibleWalks.com | In the northwestern tower (aka the Gate Tower) |
| Collapsed Wall |
Nimrod Castle - collapsed wall next to the In the northwestern tower (aka the Gate Tower) Used with permission from BibleWalks.com
Nimrod Castle - collapsed wall next to the In the northwestern tower (aka the Gate Tower)Used with permission from BibleWalks.com |
Yoram Hofman at BibleWalks.com | next to the In the northwestern tower (aka the Gate Tower). Better quality photos than Fig. 2K from Marco (2008) |
| Displaced Keystone |
 Nimrod Castle
Photo by Jefferson Williams (2018) |
Jefferson Williams 2018 | |
| Displaced Keystone |
 Nimrod Castle
Photo by Jefferson Williams (2018) |
Jefferson Williams 2018 | |
| Displaced Arch |
 Nimrod Castle
Photo by Jefferson Williams (2018) |
Jefferson Williams 2018 | |
| Deformed Arch Chipped Corners |
 Nimrod Castle
Photo by Jefferson Williams (2018) |
Jefferson Williams 2018 | |
| Displaced Keystone Chipped Corners |
 Nimrod Castle
Photo by Jefferson Williams (2018) |
Jefferson Williams 2018 | |
| Displaced Arch |
 Nimrod Castle
Photo by Jefferson Williams (2018) |
Jefferson Williams 2018 | |
| Displaced Keystone |
 Nimrod Castle
Photo by Jefferson Williams (2018) |
Jefferson Williams 2018 | |
| Displaced Ashlar at wall top |
Nimrod Castle Photo by Jefferson Williams (2018) |
Jefferson Williams 2018 | |
| Displaced Keystone |
 Nimrod Castle
Photo by Jefferson Williams (2018) |
Jefferson Williams 2018 | |
| Displaced Keystone |
 Nimrod Castle
Photo by Jefferson Williams (2018) |
Jefferson Williams 2018 | |
| Displaced Keystone |
 Nimrod Castle
Photo by Jefferson Williams (2018) |
Jefferson Williams 2018 | |
| Displaced Ashlars |
 Nimrod Castle
Photo by Jefferson Williams (2018) |
Jefferson Williams 2018 | |
| Displaced Arch Chipped Corners |
 Nimrod Castle
Photo by Jefferson Williams (2018) |
Jefferson Williams 2018 | |
| Cracked Lintel |
Nimrod Castle Photo by Jefferson Williams (2018) |
Jefferson Williams 2018 | |
| Cracked Lintel |
Nimrod Castle Photo by Jefferson Williams (2018) |
Jefferson Williams 2018 | |
| Cracked Lintel |
Nimrod Castle Photo by Jefferson Williams (2018) |
Jefferson Williams 2018 | |
| Displaced Arch |
 Nimrod Castle
Photo by Jefferson Williams (2018) |
Jefferson Williams 2018 | |
| Displaced Arch |
 Nimrod Castle
Photo by Jefferson Williams (2018) |
Jefferson Williams 2018 | |
| Displaced Arch |
 Nimrod Castle
Photo by Jefferson Williams (2018) |
Jefferson Williams 2018 | |
| Displaced Arch |
 Nimrod Castle
Photo by Jefferson Williams (2018) |
Jefferson Williams 2018 | |
| Displaced Arch |
 Nimrod Castle
Photo by Jefferson Williams (2018) |
Jefferson Williams 2018 | |
| Chipped Corners |
Nimrod Castle Photo by Jefferson Williams (2018) |
Jefferson Williams 2018 |
- Fig. 3 - Arch Damage Matrix
 Fig. 3
The matrix shows photos of examples of damage to stone arches. Rows correspond to the indicated damage category and columns to the severity of the damage.
Hinzen et al (2016)
Arch Damage Grade (ADG) is generally based on
- fractures of plaster and/or mortar (if any) and fracturing of the building blocks of the arch
- deformations, including vertical and horizontal movements of voussoirs and/or keystones including rotations
- spall and breakout, particularly at the corners of pillar stones, voussoirs, and keystone
- Description of Fractures
- Description of Spall
- Keystone Drop as a % of the Rise
- Vertical Deformation of Voussoirs as a % of the Rise
- In Plane Horizontal Deformation as a % of the Span
- Out of Plane Horizontal Deformation as a % of the Span
- When the keystone and one or more voussoirs dropped, ADG was set to 7
- In the case of arch Collapse, ADG was set to 8
This scheme was developed mainly for application to round or segmental arches. An original draft of the scheme was modified and adapted during the processing of the 95 arches used as examples in this study. The form of an arch has a significant influence on how it reacts to ground motions. For Lancet or equilateral pointed arches that do not have a classical keystone, a somewhat modified scheme would be necessary to deduce ADGs.
- from Fig. 9 of Hinzen et al (2016)
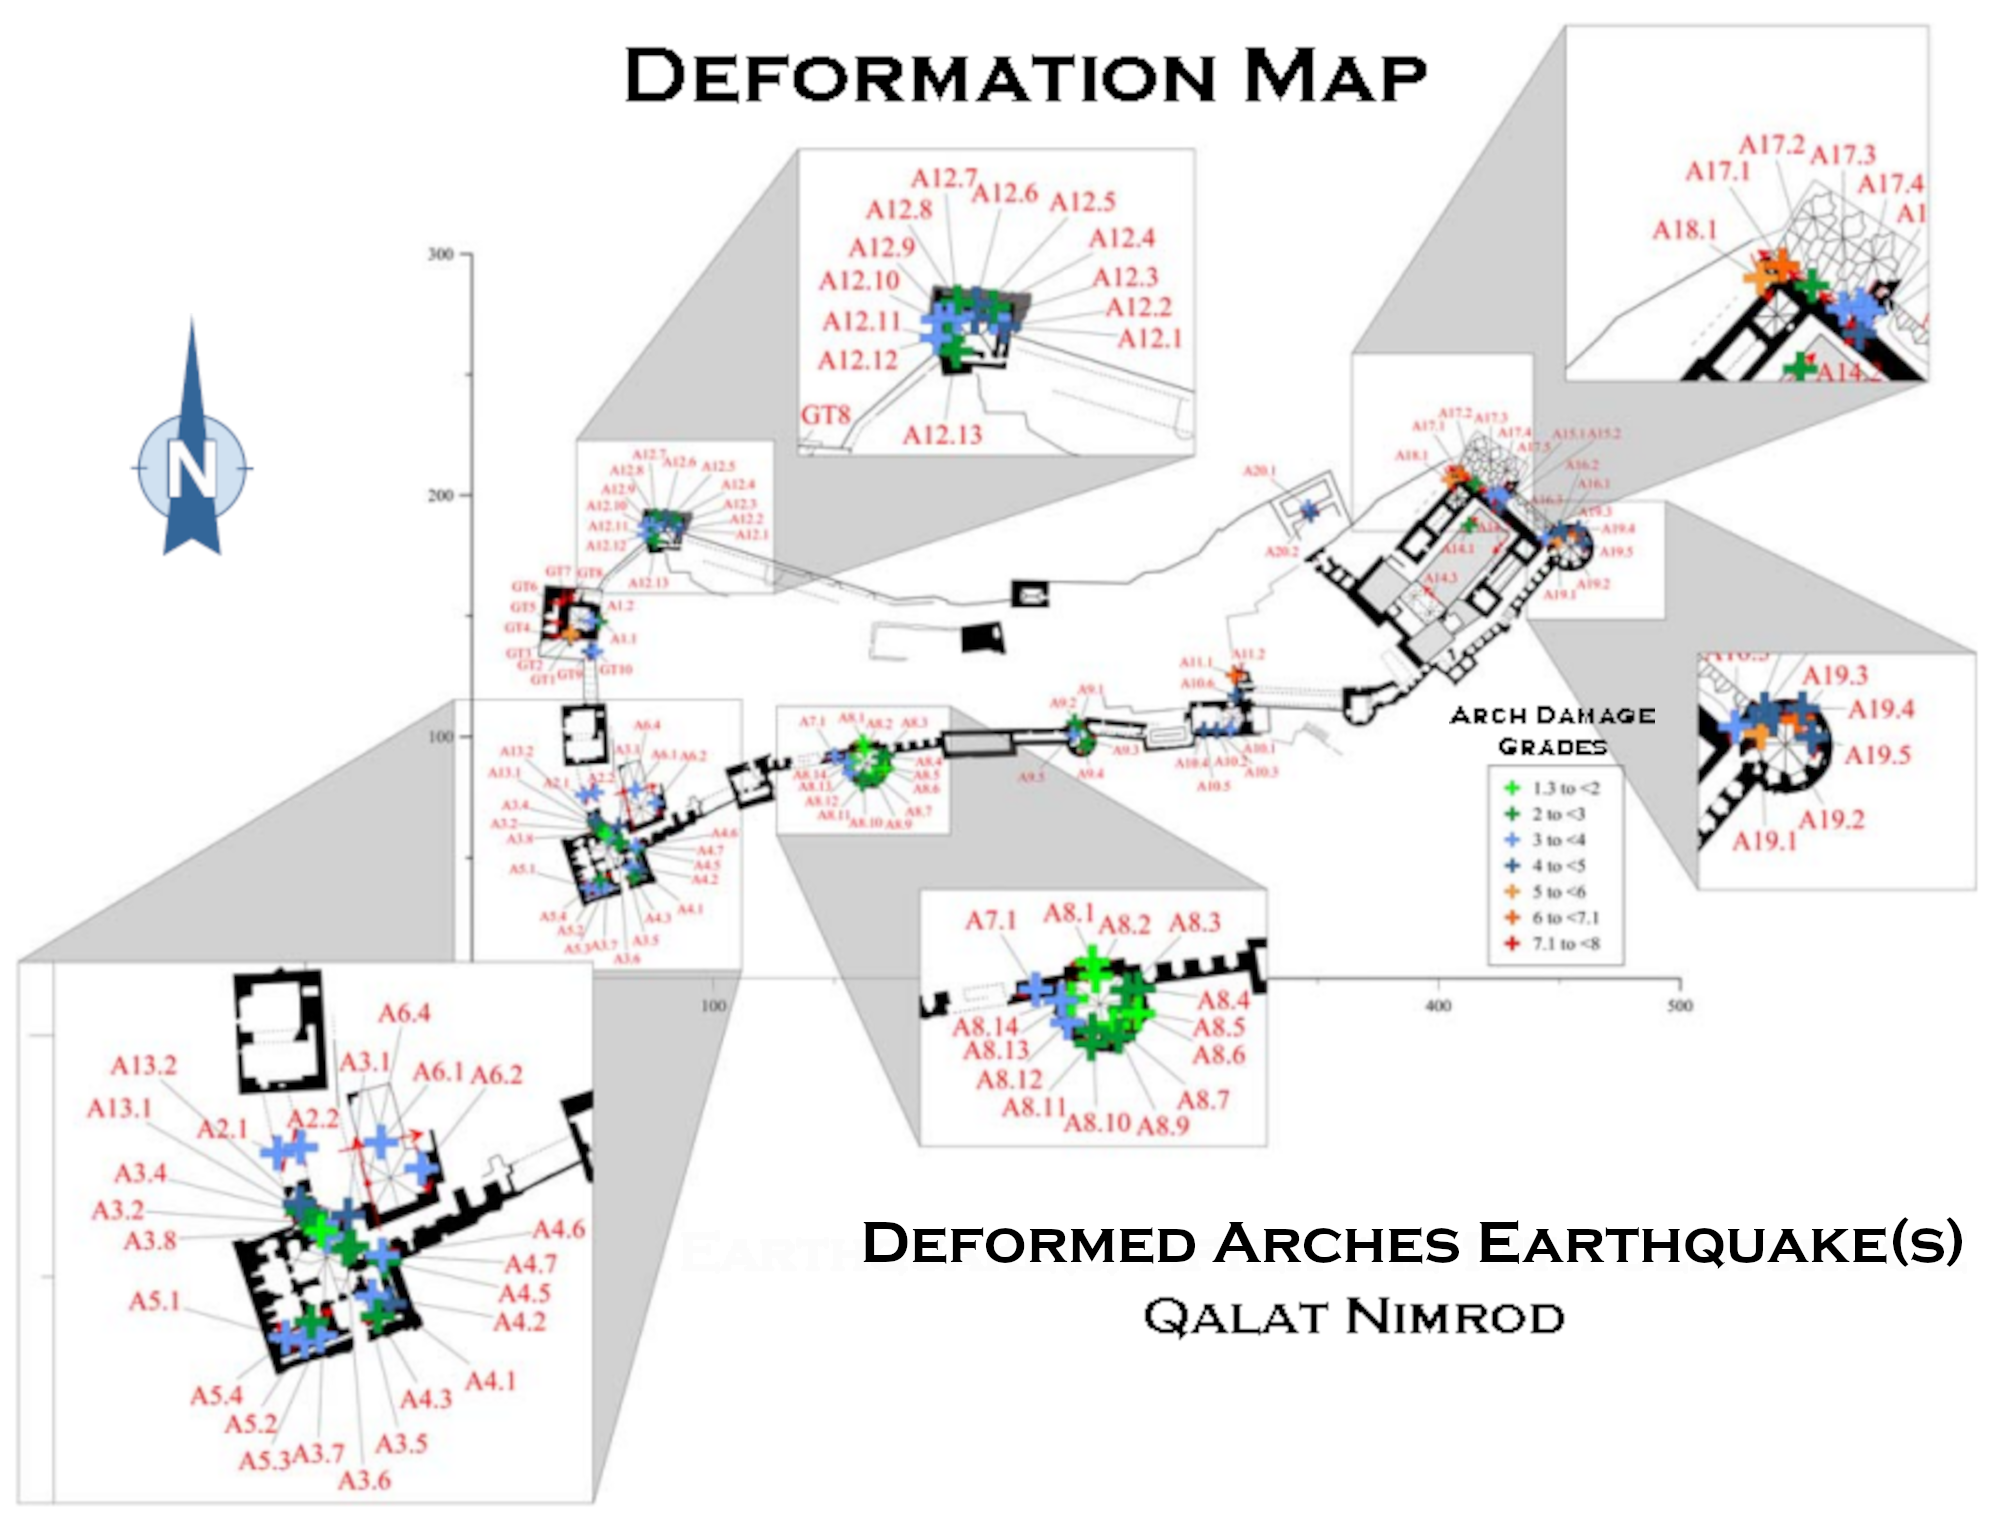 Deformation Map
click on image to open a higher resolution magnifiable image in a new tab
from Fig. 9 of Hinzen et al (2016)
- Fig. 3 - Arch Damage Matrix
Fig. 3
The matrix shows photos of examples of damage to stone arches. Rows correspond to the indicated damage category and columns to the severity of the damage.
Hinzen et al (2016)
Arch Damage Grade (ADG) is generally based on
- fractures of plaster and/or mortar (if any) and fracturing of the building blocks of the arch
- deformations, including vertical and horizontal movements of voussoirs and/or keystones including rotations
- spall and breakout, particularly at the corners of pillar stones, voussoirs, and keystone
- Description of Fractures
- Description of Spall
- Keystone Drop as a % of the Rise
- Vertical Deformation of Voussoirs as a % of the Rise
- In Plane Horizontal Deformation as a % of the Span
- Out of Plane Horizontal Deformation as a % of the Span
- When the keystone and one or more voussoirs dropped, ADG was set to 7
- In the case of arch Collapse, ADG was set to 8
This scheme was developed mainly for application to round or segmental arches. An original draft of the scheme was modified and adapted during the processing of the 95 arches used as examples in this study. The form of an arch has a significant influence on how it reacts to ground motions. For Lancet or equilateral pointed arches that do not have a classical keystone, a somewhat modified scheme would be necessary to deduce ADGs.
- from Fig. 11 of Hinzen et al (2016) and Plan of Nimrod Fortress of Stern et. al. (2008)
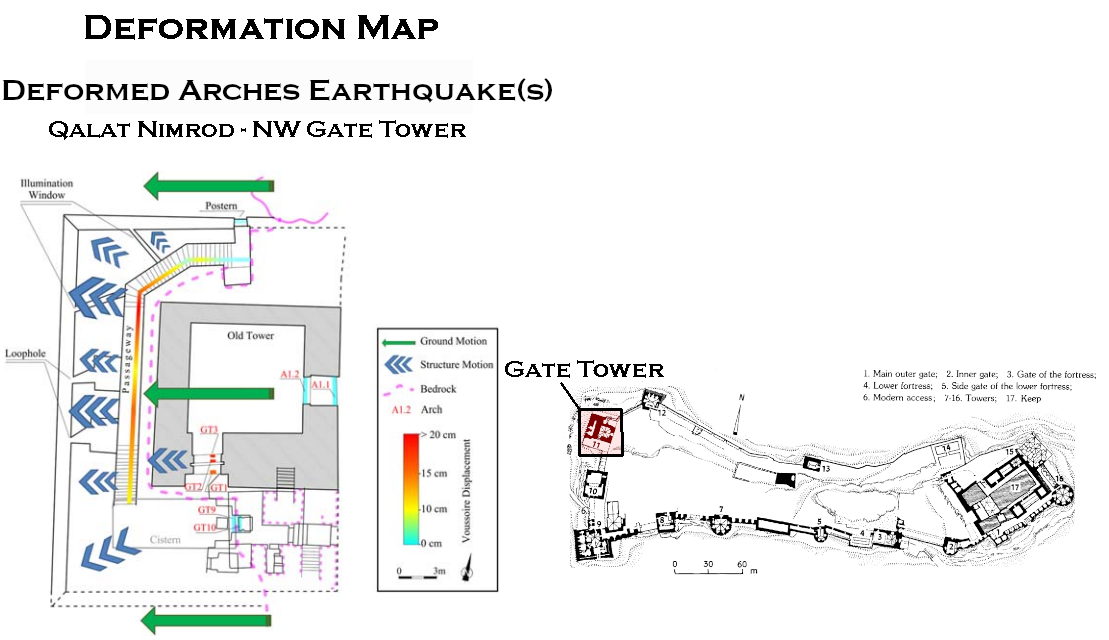 Deformation Map of Gate Tower
click on image to open in a new tab
from Fig. 11 of Hinzen et al (2016) and Plan of Nimrod Fortress of Stern et. al. (2008)
- Fig. 6 - Plan of Nimrod Castle
with arch damage locations from Hinzen et al (2016)
Fig. 6
Plan of the Kalat Nimrod castle based on the work of Deschamps (1939) and Hartal (2001). Superimposed on the major structural elements of the fortification are the 95 arches listed in Table 1. The center of each arrow represents the position of an arch, the arrow head points to the right when looking at the arch from the outside, and the arrow length varies with the span of the arch. Labels are those from Table 1. The axis units are in meters, the origin of the local coordinate system was chosen at the southwestern corner of the fortress.
Hinzen et al (2016) - Fig. 10 - Laser Scans of
the Secret Passage from Hinzen et al (2016)
Fig. 10
- Perspective view from east toward the laser scan model of the secret passageway of the gate tower of Kalat Nimrod castle. Major parts of the passage are labeled. The intensity of points changes with the individual scans, which were combined into this single image
- Floor plan of the gate tower after Hartal (2001)
- Orthographic view from above to the secret passageway. The light shaded ashlars moved downward by 0.10–0.15 m as shown by the crosscuts (d1–5)
- Measured displacement of blocks from the section marked in panel (c)
Sections start at the top and are separated by 1 m distance. The gray parts indicate the two staircases. The light stripe shows the location of the two loophole openings, and the dashed lines indicate the two bends of the passage.
Hinzen et al (2016) - Fig. 11 - Plan of Gate Tower
with postulated ground motion from Hinzen et al (2016)
Fig. 11
Detailed plan of the gate tower (see Fig. 6). The plan shows the main features of the tower at different levels. The large arrows (not to scale) indicate the interpreted ground motion and structural reaction. The plan of the tower follows the work by Hartal (2001).
Hinzen et al (2016)
Hinzen et al (2016:6-9) described the Secret Passage as follows:
A wedge extending from the western base to the eastern top of the tower collapsed and the remains are found at the foot of the hill. However, the eastern elements of the tower survived intact and display interesting deformations, including those in a so-called secret passageway which filled the space between the tower’s western wall and the cliff. At the time when the fortification was damaged by the earthquake, the gate tower had been significantly extended compared with its original size. Hartal (2001) reconstructed the size at the base of the extended tower to 22:5 × 31:8 m and a height of more than 30 m. The extension, when intact, was mantling the former tower on all but the eastern side where the lower part of the tower is leaning against the outcropping bedrock. The passage has a total length of 27 m, is 1.80 m wide and includes an upper and lower staircase with a corridor that connects both. North of the corridor at the start of the lower staircase the passage makes a 55° turn to the east followed by a second turn of 35°, so that 90° are reached in total (Fig. 10). The latter includes two loopholes, and at the upper part of the lower staircase there are two small illumination windows. The west wall and the north wall of the tower served as the passage’s outer walls, whereas the inner walls were built against the bare rock (Hartal, 2001). Both walls and the roofing barrel vault were built from large ashlars, the latter of about 0:6 × 1:2 − 1:6 m. The vault is made of two rows of these large ashlars on each side with a much smaller keystone (bottom width 0.2 m) in the middle.Hinzen et al (2016:9-) discussed the archaeoseismology of the Secret Passage as follows:
From an archaeoseismological perspective, this secret passageway is of particular interest and shows an extraordinary damage pattern. The complete row of ashlars east of the keystone moved vertically down by up to 0.25 m along the upper staircase and the corridor (Fig. 10). This deformation continues beyond the corridor around both bends of the passage where it gradually decreases toward the lower end of the passageway at the postern. Figure 10c shows four crosscuts through the laser scan model of the secret passageway. We used the virtual model to measure the resulting block movement (vector sum of horizontal and vertical displacement) at sections separated by 1 m distance (Fig. 10d). The first section was taken immediately at the beginning of the remaining roof of the passageway. The large displacement here of almost 0.20 m is influenced by the missing buttresses, particularly at the western side. From section 2 to 6, which is past the first loophole, the deformation increases steadily from 0.05 to 0.17 m. The following three sections (8– 10), which are in the range of the second loophole, are slightly less deformed. Along the further trend of the corridor, the deformation increases toward its maximum at section 14 with a value of 0.25 m. From there we see an almost linear decrease of the deformation along the second staircase up to section 20 m just in front of the second bend of the passageway. Here, the deformation is down to 0.05 m and it vanishes at section 25. This deformation pattern cannot be evaluated by the proposed scheme from Figure 4. However, the displacements of the voussoir alone result in AGDs of 6.
The uniform drop of the first voussoir east of the keystone along the whole passageway is exactly the same deformation pattern as seen in arches GT1, GT2, and GT3, which are located east of the passage with a cross section parallel to that of the corridor. The displacement of voussoirs here is between 0.17 and 0.37 m. Figure 11 shows a damage scenario which might explain the reason for the existing deformation. The sliding voussoirs indicate a strong westerly directed component of ground motion (arrows not to scale), which disturbed the static equilibrium of the arches. The whole mass of the tower moved westward, probably with increasing amplitudes toward its top. The arches opened and allowed the voussoirs to drop before the back swing of the motion closed the gap. The ground motion also induced some corner expulsion of building material at the northwestern corner of the gate tower, which in turn was responsible for the continuation of the voussoir sliding at the lower staircase. The motion was strong enough to topple the outer section of the gate tower, leaving an almost 45° westdipping slope of the ruin. This rather strong directional motion also explains why Kamai and Hatzor (2007) were able to model the voussoir drop of the arch GT1 (Table 1, Fig. 6) in an east–west directed 2D discrete element model.
- Earthquake Archeological Effects chart
of Rodríguez-Pascua et al (2013: 221-224)
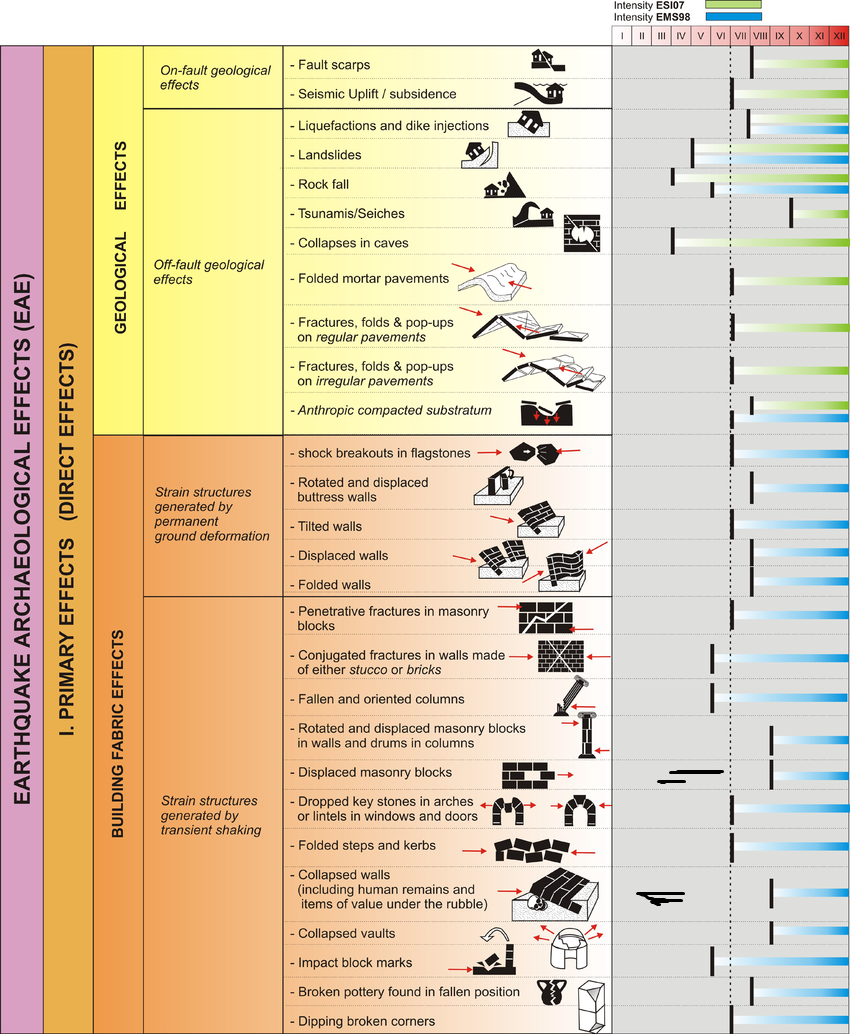 Earthquake Archeological Effects (EAE)
Rodríguez-Pascua et al (2013: 221-224)
| Effect(s) | Location | Image(s) | Description | Intensity |
|---|---|---|---|---|
| Dropped Keystones in Arches | East-West Oriented Arches in the Gate Tower and elsewhere
Fig. 6 Plan of the Kalat Nimrod castle based on the work of Deschamps (1939) and Hartal (2001). Superimposed on the major structural elements of the fortification are the 95 arches listed in Table 1. The center of each arrow represents the position of an arch, the arrow head points to the right when looking at the arch from the outside, and the arrow length varies with the span of the arch. Labels are those from Table 1. The axis units are in meters, the origin of the local coordinate system was chosen at the southwestern corner of the fortress. Hinzen et al (2016)
Fig. 9On top of the map from Figure 5 the ADGs of all 90 evaluated arches are plotted. The range of values is indicated by the legend. Five zoom windows give an enlarged view of sections with dense arch coverage. At towers with arches A12.x and A8.x higher ADGs are found on the western side of the structures. For the huge tower with the arches A19.x at the northeastern corner of the fortification, the damage at the outer edge of the tower is greater than at the hill side. At the large rectangular tower at the southwestern corner, no pattern in the distribution of the damage degree was found. Hinzen et al (2016) |
Nimrod Castle Photo by Jefferson Williams (2018) |
|
VI+ |
| Displaced Masonry Blocks | northwestern tower (aka the Gate Tower) |
Nimrod Castle - In the northwestern tower (aka the Gate Tower) Used with permission from BibleWalks.com |
From an archaeoseismological perspective, this secret passageway is of particular interest and shows an extraordinary damage pattern. The complete row of ashlars east of the keystone moved vertically down by up to 0.25 m along the upper staircase and the corridor (Fig. 10). ... The uniform drop of the first voussoir east of the keystone along the whole passageway is exactly the same deformation pattern as seen in arches GT1, GT2, and GT3, which are located east of the passage with a cross section parallel to that of the corridor. The displacement of voussoirs here is between 0.17 and 0.37 m. Figure 11 shows a damage scenario which might explain the reason for the existing deformation. The sliding voussoirs indicate a strong westerly directed component of ground motion (arrows not to scale), which disturbed the static equilibrium of the arches. The whole mass of the tower moved westward, probably with increasing amplitudes toward its top. The arches opened and allowed the voussoirs to drop before the back swing of the motion closed the gap. The ground motion also induced some corner expulsion of building material at the northwestern corner of the gate tower, which in turn was responsible for the continuation of the voussoir sliding at the lower staircase. The motion was strong enough to topple the outer section of the gate tower, leaving an almost 45° west-dipping slope of the ruin. This rather strong directional motion also explains why Kamai and Hatzor (2007) were able to model the voussoir drop of the arch GT1 (Table 1, Fig. 6) in an east–west directed 2D discrete element model.- Hinzen et al (2016:9-) |
VIII+ |
| Displaced Masonry Blocks |
Nimrod Castle Photo by Jefferson Williams (2018) |
VIII+ | ||
| Dipping Broken Corners |
Nimrod Castle Photo by Jefferson Williams (2018) |
VI+ | ||
| Collapsed Walls | outer section of the gate tower
Fig. 11 Detailed plan of the gate tower (see Fig. 6). The plan shows the main features of the tower at different levels. The large arrows (not to scale) indicate the interpreted ground motion and structural reaction. The plan of the tower follows the work by Hartal (2001). Hinzen et al (2016) |
Fig. 2 K Collapsed wall of the northern watchtowers of Kal'at Nimrod lay in disarray at the bottom of a steep slope. The large ashlars fell in 1759 Marco (2008)
Nimrod Castle - collapsed wall next to the In the northwestern tower (aka the Gate Tower)Used with permission from BibleWalks.com
Nimrod Castle - collapsed wall next to the In the northwestern tower (aka the Gate Tower)Used with permission from BibleWalks.com |
|
VIII+ |
| Fractured lintels (penetrative fractures?) |
Nimrod Castle Photo by Jefferson Williams (2018)
Nimrod CastlePhoto by Jefferson Williams (2018)
Nimrod CastlePhoto by Jefferson Williams (2018) |
VI+? |
- Figure 9 - Photos of Arch Damage
from Kamai and Hatzor (2007)
 Evidence for a destructive earthquake that hit the Nimrod Fortress most probably at 1759 (see
text for explanation):
Evidence for a destructive earthquake that hit the Nimrod Fortress most probably at 1759 (see
text for explanation):
- the same stone has slid downwards out of three parallel arches at the main gate arch
- a similar deformation is noticed at a passage-way parallel to the gate arch
- an adjacent arch facing east was not deformed
- location of the passage-way, 10 m west of main gate
Kamai and Hatzor (2007) - Photo of displaced stones
in the Gate Tower - taken by Jefferson Williams
Displaced stones in the Gate Tower of Nimrod Castle
Photo by Jefferson Williams (2018) - Figure 10 - DDA Model
from Kamai and Hatzor (2007)
 Figure 10
The DDA block system for the studied arch at Nimrod Fortress. Four fixed points (squares) are assigned to the confining block and five measurement points (circles) are assigned to the top arch blocks. The lines intersecting the arch blocks represent material lines
Kamai and Hatzor (2007) - Figure 11 - Sign convention for
the Nimrod arch blocks from Kamai and Hatzor (2007)
 Figure 11
Sign convention for the Nimrod arch blocks:
- K =keystone
- A and B for the first and second block from the keystone respectively
- R or L to indicate right or left
Kamai and Hatzor (2007)
Kamai and Hatzor (2007) performed Discontinuous Deformation Analysis (DDA) on a model (Fig. 10 above) for the dropped stones (see Photo taken by Jefferson Williams above) observed in the Gate Tower at the Nimrod Fortress (GT1 of Hinzen et al, 2016). The optimal model which best described the observed damage had an amplitude of 1 g and a frequency of 2 Hz. Only minor deformation was simulated for amplitudes below 0.8 g and the arch suffered partial destruction at an amplitude of 1.5 g and higher. The model also showed a clear preference for a frequency of 2 Hz. as opposed to 1 or 3 Hz. Kamai and Hatzor (2007) considered the possibility that seismic amplification was at play and suggested bedrock acceleration could have been as low as 0.4 g at 1 Hz.. Seismic amplification could be due to a Ridge Effect and/or the fact that
the gate tower is supported by a 30 m high retaining wall on its western side, while the eastern side rests directly on bedrock. The range of possible PGA values between 0.4 and 1 g converts to Intensities of 7.8 to 9.3 using Equation 2 of Wald et al (1999).
| Variable | Input | Units | Notes |
|---|---|---|---|
| g | Peak Horizontal Ground Acceleration | ||
| Variable | Output - Site Effect not considered | Units | Notes |
| unitless | Conversion from PGA to Intensity using Wald et al (1999) |
If the wavelength of a seismic wave is approximately equal to the appropriate dimension of the ridge, constructive interference during propagation can lead to a resonance condition where the wave is effectively amplified. Since the ridge effect, according to Massa et al (2010), tends to occur on ridges which are perpendicular (or more properly orthogonal) to incoming seismic energy, the appropriate dimension is the 420 m long axis reported by Hinzen et al (2016:2). This axis will be perpendicular to seismic energy which radiates from the Rachaiya fault which is thought to have ruptured during the 1759 CE Safed Quake. The next parameter to be determined is the shear wave velocity of the underlying bedrock. Kamai and Hatzor (2007) provided some mechanical properties that allows one to estimate shear wave velocity of ~4500 m/s using the calculator below:
- Inputs
- Shear Modulus 54.2 GPa
- Density 2604 kg/m3
- Output
- Shear Wave Velocity 4562 m/s
f = VS/λSample calculations for a wavelength (λ) of ~420 m follow :
wheref = frequency (Hz.)
VS = Shear Wave Velocity (m/s)
λ = Wavelength (m)
| VS (m/s) | λ (m) | f (Hz) |
|---|---|---|
| 3500 | 420 | 8.3 |
| 4500 | 420 | 10.7 |
| 5500 | 420 | 13.1 |
| Source | Image | Figure | Description |
|---|---|---|---|
| Hinzen et al (2016) |
 Fig. 5a
Location map of the Kalat Nimrod castle on the Golan Heights. Dead Sea fault and surroundings, the rectangle indicates the location of the more detailed map in Fig. 5b Hinzen et al (2016) |
Figure 5a | Location Map |
| Hinzen et al (2016) |
Fig. 5b Location map of the Kalat Nimrod castle on the Golan Heights. Hinzen et al (2016) |
Figure 5b | Location Map |
| Hinzen et al (2016) |
Fig. 5c Local geology and faults neighboring Kalat Nimrod after Sneh and Weinberger (2014) Hinzen et al (2016) |
Figure 5c | Geologic Map |
| Hinzen et al (2016) |
 Fig. 1
Elements and dimensions of a stone arch overlain on a photograph of arch number A6.2 from Table 1 located on the eastern side of the large cistern of Kalat Nimrod Fortress. Hinzen et al (2016) |
Figure 1 | Elements of an Arch |
| Hinzen et al (2016) |
 Fig. 2a
Top to bottom, three arches of similar span, but different rise with schematically shown forces to the buttresses Hinzen et al (2016) |
Figure 2a | Arch Loading |
| Hinzen et al (2016) |
 Fig. 2b
Principle structure of a corbeled arch and six types of true arches. Keystones are shown in gray (after Ching, 2014). Hinzen et al (2016) |
Figure 2b | Types of Arches |
| Hinzen et al (2016) |
Fig. 3 The matrix shows photos of examples of damage to stone arches. Rows correspond to the indicated damage category and columns to the severity of the damage. Hinzen et al (2016) |
Figure 3 | Arch Damage Matrix |
| Kamai and Hatzor (2007) |
Evidence for a destructive earthquake that hit the Nimrod Fortress most probably at 1759 (see
text for explanation):
Kamai and Hatzor (2007) |
Figure 9 | Photos of Arch Damage |
| Marco (2008) |
 Fig. 2 I
Chipped corners of ashlars in the 13th century Arabic fortress Kal'at Subeiba (now called Kal'at Nimrod), which was hit by the earthquake of 1759. The original joints and fractures in the stones have different orientations. Marco (2008) |
Figure 2 I | Chipped corners of ashlars |
| Marco (2008) |
 Fig. 2 E
Blocks on the sides of arches on the left slid down in the earthquake of 1759 in Kal'at Nimrod. Throughout the site, arches in walls that trend E–W are deformed whereas similar arches in N–S trending walls have remained intact. Marco (2008) |
Figure 2 E | Displaced stones in the arches of the Gate Tower |
| Marco (2008) |
Fig. 2 K Collapsed wall of the northern watchtowers of Kal'at Nimrod lay in disarray at the bottom of a steep slope. The large ashlars fell in 1759 Marco (2008) |
Figure 2 K | Collapsed wall at Kalat Nimrod |
| Hinzen et al (2016) |
Fig. 6 Plan of the Kalat Nimrod castle based on the work of Deschamps (1939) and Hartal (2001). Superimposed on the major structural elements of the fortification are the 95 arches listed in Table 1. The center of each arrow represents the position of an arch, the arrow head points to the right when looking at the arch from the outside, and the arrow length varies with the span of the arch. Labels are those from Table 1. The axis units are in meters, the origin of the local coordinate system was chosen at the southwestern corner of the fortress. Hinzen et al (2016) |
Figure 6 | Castle Plan with Arch Damage locations |
| Hinzen et al (2016) |
 Fig. 7
(a) Measured rise of 95 arches of the Kalat Nimrod fortress with respect to the span. The dashed line is a linear regression of the data points with a slope of 0.55. (b) Rose diagram of the orientations of the 95 arches from Table 1 with respect to north; bin size is 15°. Hinzen et al (2016) |
Figure 7 | Arch Damage Analysis |
| Hinzen et al (2016) |
 Fig. 8
Graphs used to evaluate the damage of individual arches of the Kalat Nimrod fortress and results of that evaluation. From left to right (top row) these include
All graphs are plotted to the same scale. Example is arch A1.2 in Table 1 Hinzen et al (2016) |
Figure 8 | Arch Damage Analysis |
| Hinzen et al (2016) |
Fig. 9 On top of the map from Figure 5 the ADGs of all 90 evaluated arches are plotted. The range of values is indicated by the legend. Five zoom windows give an enlarged view of sections with dense arch coverage. At towers with arches A12.x and A8.x higher ADGs are found on the western side of the structures. For the huge tower with the arches A19.x at the northeastern corner of the fortification, the damage at the outer edge of the tower is greater than at the hill side. At the large rectangular tower at the southwestern corner, no pattern in the distribution of the damage degree was found. Hinzen et al (2016) |
Figure 9 | Site Plan with ADGs |
| Hinzen et al (2016) |
Fig. 10
Sections start at the top and are separated by 1 m distance. The gray parts indicate the two staircases. The light stripe shows the location of the two loophole openings, and the dashed lines indicate the two bends of the passage. Hinzen et al (2016) |
Figure 10 | The Secret Passage |
| Hinzen et al (2016) |
Fig. 11 Detailed plan of the gate tower (see Fig. 6). The plan shows the main features of the tower at different levels. The large arrows (not to scale) indicate the interpreted ground motion and structural reaction. The plan of the tower follows the work by Hartal (2001). Hinzen et al (2016) |
Figure 11 | Plan of Gate Tower with postulated ground motion |
| Damage Type | Photo | Photographer | Comments |
|---|---|---|---|
| Displaced Keystones |
Displaced Keystones in the Gate Tower of Nimrod Castle Photo by Jefferson Williams (2018) |
Jefferson Williams 2018 |
|
| Displaced Keystones |
Nimrod Castle Photo by Jefferson Williams (2018) |
Jefferson Williams 2018 | |
| Displaced stones |
Nimrod Castle - In the northwestern tower (aka the Gate Tower) Used with permission from BibleWalks.com |
Yoram Hofman at BibleWalks.com | In the northwestern tower (aka the Gate Tower) |
| Collapsed Wall |
Nimrod Castle - collapsed wall next to the In the northwestern tower (aka the Gate Tower) Used with permission from BibleWalks.com
Nimrod Castle - collapsed wall next to the In the northwestern tower (aka the Gate Tower)Used with permission from BibleWalks.com |
Yoram Hofman at BibleWalks.com | next to the In the northwestern tower (aka the Gate Tower). Better quality photos than Fig. 2K from Marco (2008) |
| Displaced Keystone |
Nimrod Castle Photo by Jefferson Williams (2018) |
Jefferson Williams 2018 | |
| Displaced Keystone |
Nimrod Castle Photo by Jefferson Williams (2018) |
Jefferson Williams 2018 | |
| Displaced Arch |
Nimrod Castle Photo by Jefferson Williams (2018) |
Jefferson Williams 2018 | |
| Deformed Arch Chipped Corners |
Nimrod Castle Photo by Jefferson Williams (2018) |
Jefferson Williams 2018 | |
| Displaced Keystone Chipped Corners |
Nimrod Castle Photo by Jefferson Williams (2018) |
Jefferson Williams 2018 | |
| Displaced Arch |
Nimrod Castle Photo by Jefferson Williams (2018) |
Jefferson Williams 2018 | |
| Displaced Keystone |
Nimrod Castle Photo by Jefferson Williams (2018) |
Jefferson Williams 2018 | |
| Displaced Ashlar at wall top |
Nimrod Castle Photo by Jefferson Williams (2018) |
Jefferson Williams 2018 | |
| Displaced Keystone |
Nimrod Castle Photo by Jefferson Williams (2018) |
Jefferson Williams 2018 | |
| Displaced Keystone |
Nimrod Castle Photo by Jefferson Williams (2018) |
Jefferson Williams 2018 | |
| Displaced Keystone |
Nimrod Castle Photo by Jefferson Williams (2018) |
Jefferson Williams 2018 | |
| Displaced Ashlars |
Nimrod Castle Photo by Jefferson Williams (2018) |
Jefferson Williams 2018 | |
| Displaced Arch Chipped Corners |
Nimrod Castle Photo by Jefferson Williams (2018) |
Jefferson Williams 2018 | |
| Cracked Lintel |
Nimrod Castle Photo by Jefferson Williams (2018) |
Jefferson Williams 2018 | |
| Cracked Lintel |
Nimrod Castle Photo by Jefferson Williams (2018) |
Jefferson Williams 2018 | |
| Cracked Lintel |
Nimrod Castle Photo by Jefferson Williams (2018) |
Jefferson Williams 2018 | |
| Displaced Arch |
Nimrod Castle Photo by Jefferson Williams (2018) |
Jefferson Williams 2018 | |
| Displaced Arch |
Nimrod Castle Photo by Jefferson Williams (2018) |
Jefferson Williams 2018 | |
| Displaced Arch |
Nimrod Castle Photo by Jefferson Williams (2018) |
Jefferson Williams 2018 | |
| Displaced Arch |
Nimrod Castle Photo by Jefferson Williams (2018) |
Jefferson Williams 2018 | |
| Displaced Arch |
Nimrod Castle Photo by Jefferson Williams (2018) |
Jefferson Williams 2018 | |
| Chipped Corners |
Nimrod Castle Photo by Jefferson Williams (2018) |
Jefferson Williams 2018 |