![]()
Paleoclimate Information
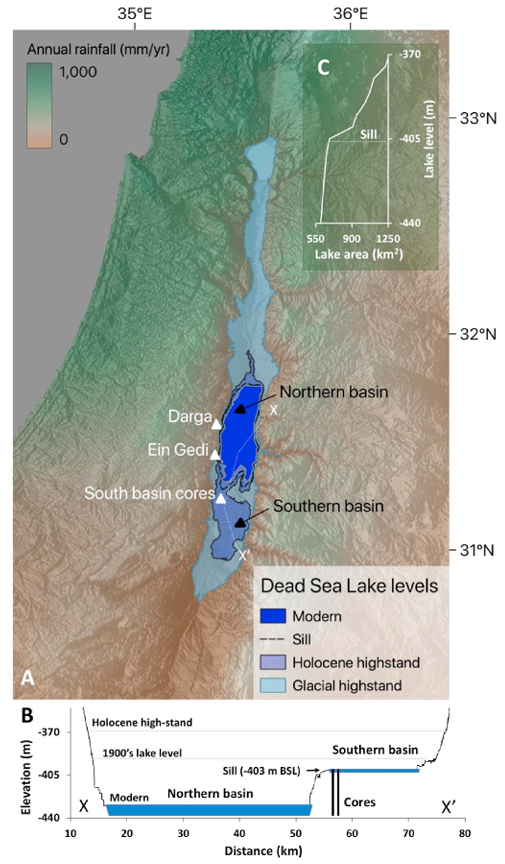
- Dead Sea lake-level status superimposed on relief and rainfall maps and showing the location of the two basins, coring site and highstand Holocene outcrops
- A topographic transect through both basins and the coring location
- An hypsometric curve of the DS, showing that changing lake-level below (above) the sill (403 m bsl) results in a small (large) change in surface area
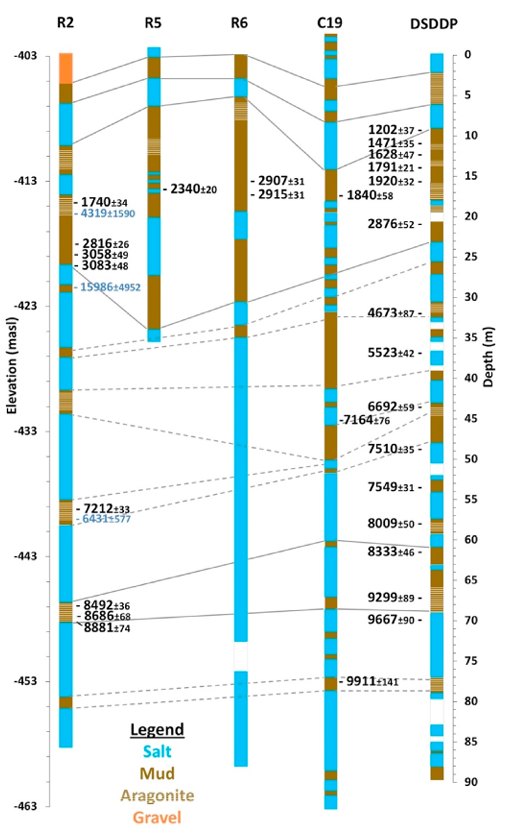 Figure 2
Core lithology and chronology. Showing the three DSW cores (R2, R5, R6) we studied, the Charrach (2019) composite record of 25 cores from the central southern basin (C19) and the DSDDP lithology (Kiro et al., 2016; Torfstein et al., 2015) and ages (Kitagawa et al., 2017). The cores are composed of
- halite (blue)
- silty-clay (brown)
- aragonite layers (brown with white lines)
- anthropogenic gravel at the top (orange)
Goldsmith et al. (2023)
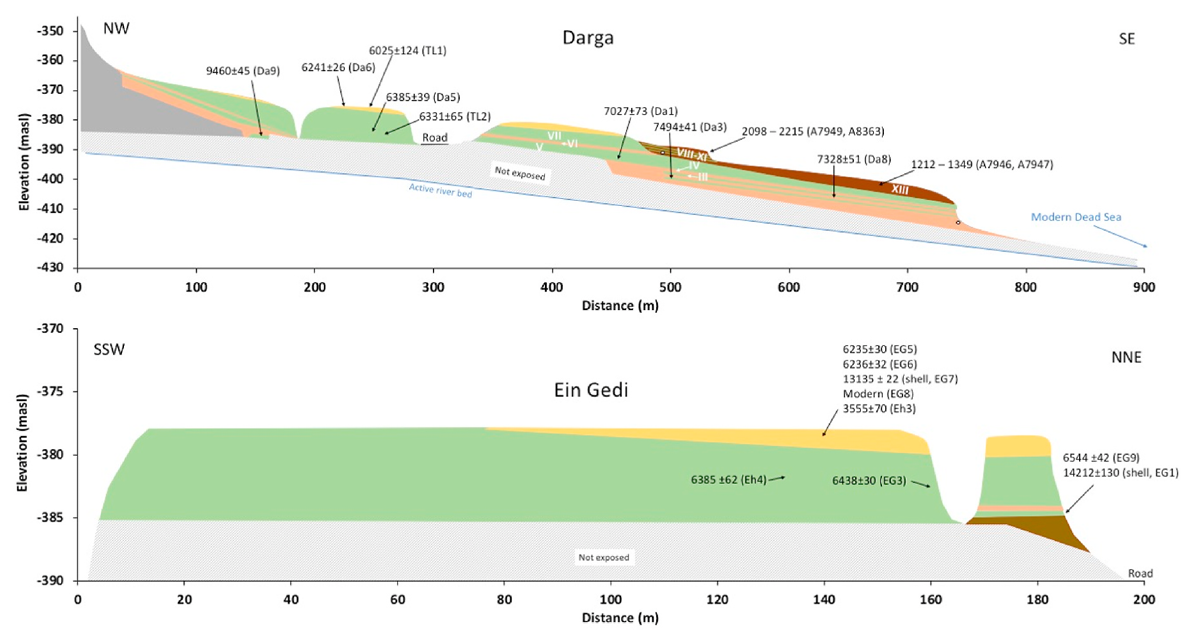
Sedimentary sections of Darga (top) and Ein Gedi (bottom). Darga: The base of the section is composed of sediments of an unknown age (gray), above this unit, on an angular unconformity, are middle Holocene (7.5–6.3 kyr cal BP) thick brown laminated lake sediments (green), with syndepositional beach-ridges (orange) and capped by a middle Holocene (6.2–6.0 kyr cal BP) beach-ridge (yellow). Above the middle Holocene sequence in an angular unconformity with late Holocene beach-ridges (brown) and syndepositional lake sediments (light green) (2.2–1.2 kyr cal BP). Road and bridge landfill sediments and talus (hatched gray lines) extend from the exposure to the active river bed (blue) and obscure the stratigraphy. Original units defined by Kadan (1997) (white roman numerals) and calibrated (yr cal BP) radiocarbon ages (black) from Kadan (1997, A#, where # stands for the sample number), Liu et al. (2013, TL#) and this study (Da#). Units that have more the one sample dated are shown as the calibrated range of the samples (e.g., the younger Darga units). There are two pipes that stick out of the section (black-white circles), these are drawn as geographical markers. Ein Gedi: The base of the section is composed of alluvial gravel (dark orange), above there is a lacustrine unit (green) with a syndepositional alluvial deposit (orange). Above are middle Holocene (6.4–6.3 kyr cal BP) thick brown laminated lake sediments (green). The section is capped by a middle Holocene (6.2 kyr cal BP) beach-ridge (yellow). At the base of the section there is a talus which obscures the lower part of the stratigraphy (hatched gray lines). Calibrated (cal BP) radiocarbon ages (black) are from Bartov (2004, Ehx) and this study (EGx). There are 5 ages from the upper beach-ridge, 2 are from charcoal, one is from a modern chard root and from a melanopsins shell. Bartov’s (2004) age from the beach-ridge (3.6 kyr cal BP) is an outlier, and could be a mixture of the charcoal (6.2 kyr cal BP) and chard root (modern). - Goldsmith et al. (2023)
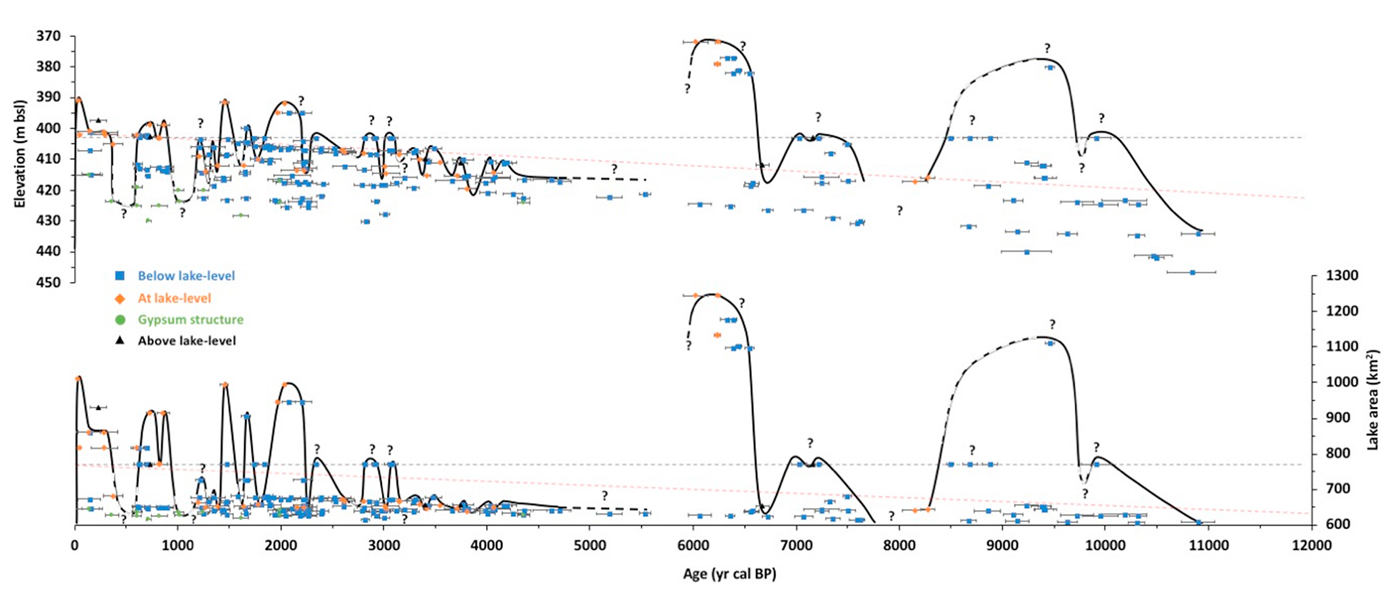
Dead Sea lake-level (top) and lake area (bottom). Dead Sea lake-level indicators
- blue square – below lake-level
- orange diamond – at lake-level
- black triangle – above lake-level
- green circle – gypsum structure
- solid black line for places where the lake-level is well constrained
- dashed lines for places where the lake level is less certain
- Question marks indicate places where the direction of the lake-level is known but the magnitude is not
Goldsmith et al. (2023)
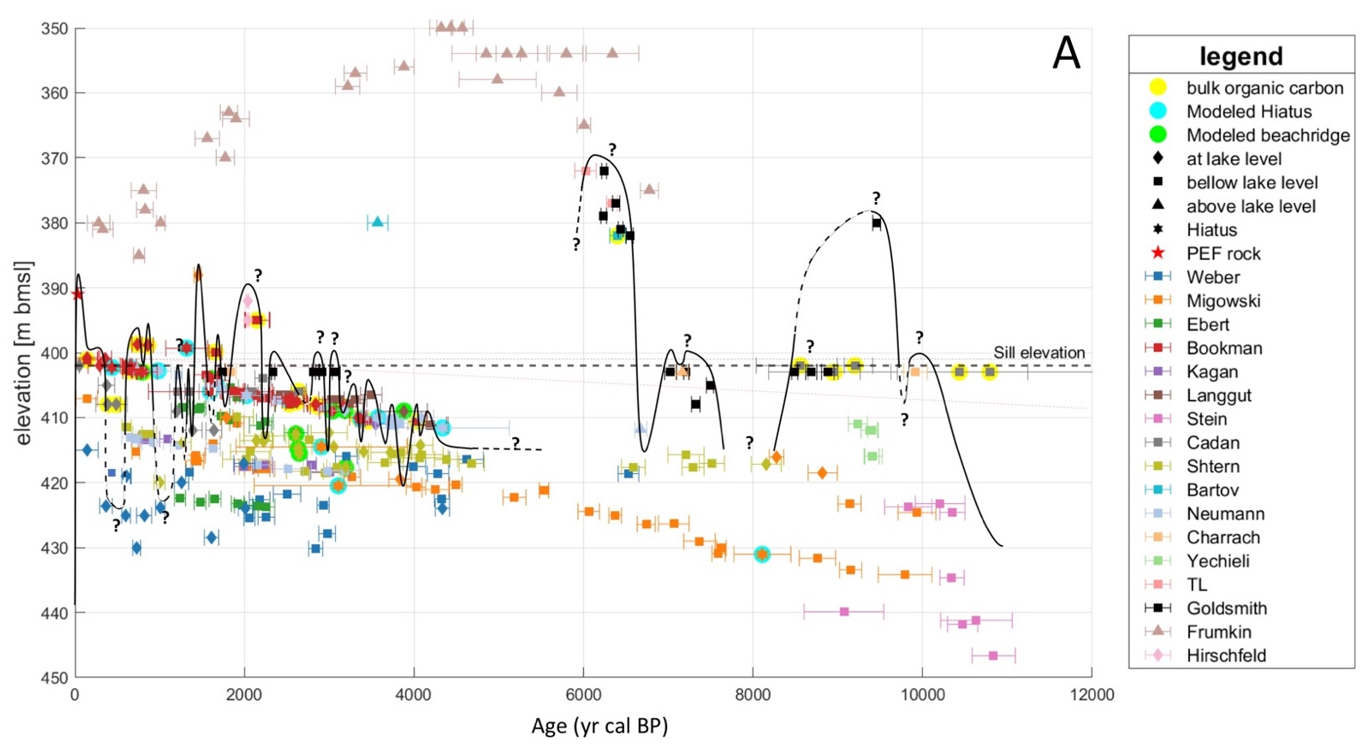
Dead Sea compiled lake-level indicators. This plot contains all radiocarbon dated DS samples (Bookman et al., 2004; Ebert et al., 2021; Enzel et al., 2003, 2000; Frumkin et al., 2001; Kadan, 1997; Kagan et al., 2011; Langgut et al., 2014; Liu et al., 2013; Migowski et al., 2006; Neumann et al., 2007; Stein et al., 2010; Weber et al., 2021). Samples that were dated on bulk sedimentary organics are highlighted in yellow. The ages are calibrated years before present, calibrated using Intcal20 in the Oxcal program (Reimer et al., 2020). Some of the samples come from a single sedimentary deposit and were calibrated as individual samples. Others, are part of a sedimentary sequence that contain a few sedimentary units and have a series of ages and replicate samples. In some sections there are reported hiatuses, their age was evaluated using the “Sequence” option in Oxcal and are highlighted in light blue. Ages of beach-ridges that were reported but not dated directly, were also evaluated using the “Sequence” option in Oxcal and are highlighted in light green. The full database is presented in Table S6.
Goldsmith et al. (2023)
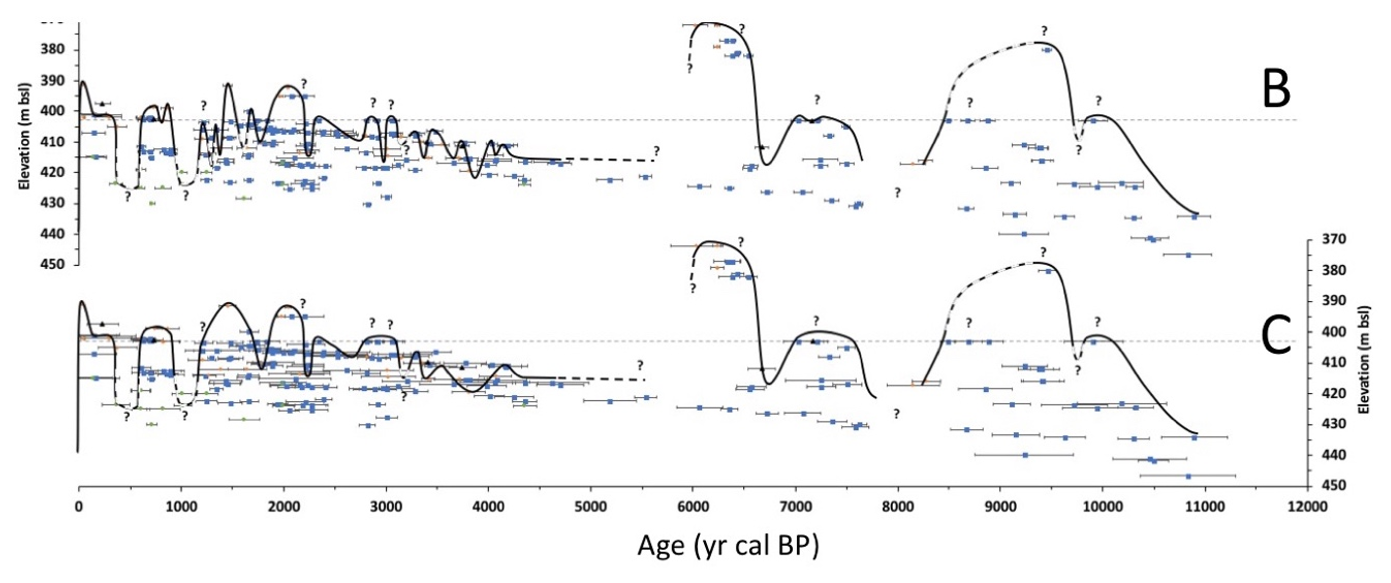
Dead Sea compiled lake-level indicators.
-
Same as Figure 4 in the main text using 1σ uncertainty for the calibrated radiocarbon ages
- blue square – bellow lake-level
- orange diamond – at lake-level
- black triangle – above lake-level
- green circle – gypsum structure
Interpreted lake-level
- solid black line for places where the lake-level is well constrained
- dashed lines for places were the lake level is less certain
- Same as B, for 2σ uncertainty. Using a larger uncertainty reduces some of the rapid lake-level changes and allows for a smoother record.
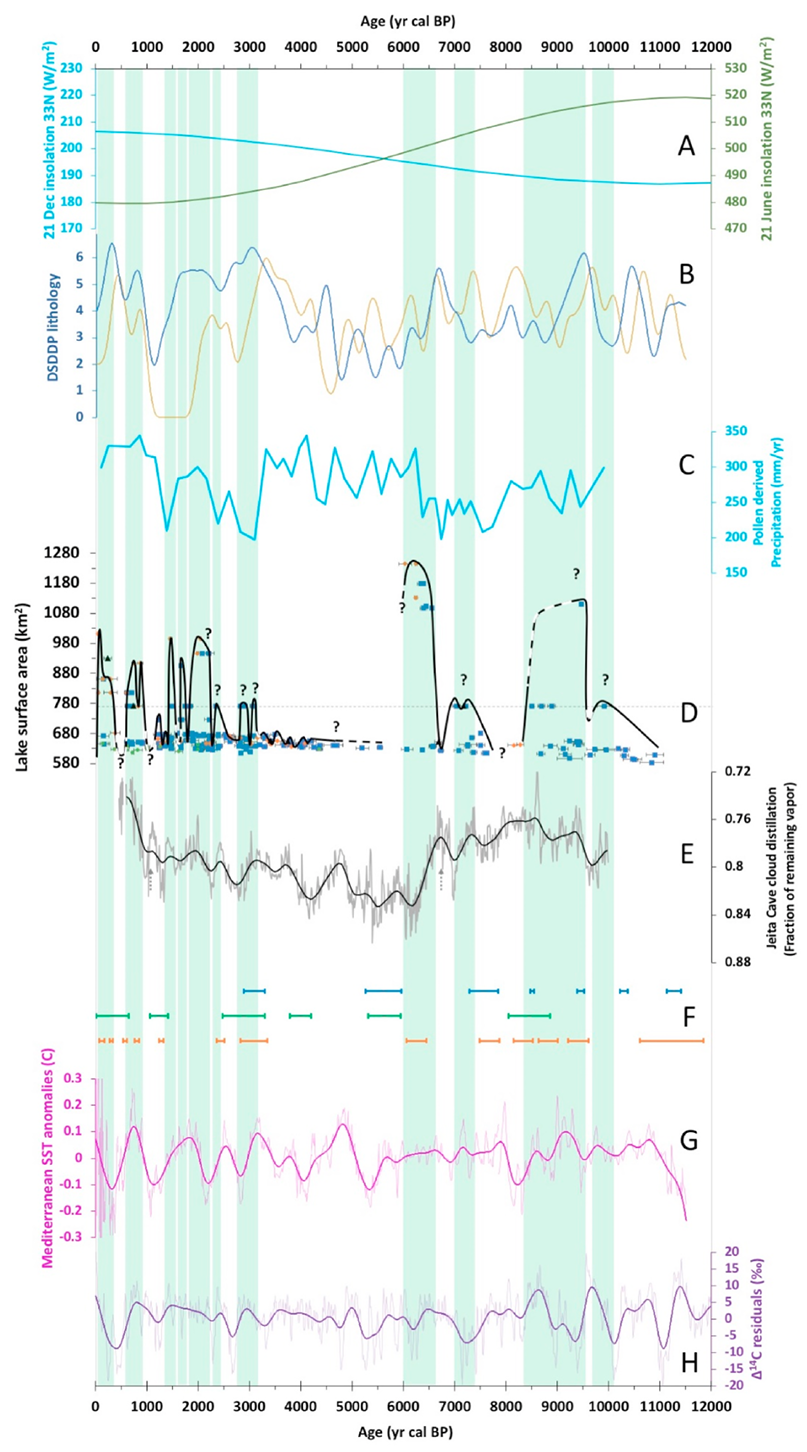
DS lake-level vs. regional and global records.
- Northern Hemisphere insolation at 33ᵒN during summer (green) and winter (blue)(Paillard et al., 1996)
- lithology of the DSDDP core (0 – air, 1 – gravel, 2 – halite, 3 – salty mud, 4 – gypsum, 5 – mud gypsum, 6 - mud, blue line from: Kiro et al., 2016; orange line from: Torfstein et al., 2015). The data was interpolated at 5 year increments and smoothed using a 100 year Gaussian filter. Kiro et al. (2016) created a series of salt sub-categories, for consistency, their li thology was redefined based on the lithological defi nitions of Torfstein et al. (2015)
- Rainfall reconstruction from DS pollen data (Litt et al., 2012)
- DS lake-surface area history, the data and sym bology are the same as in Fig. 4, the lake-area was calculated using the lake hypsometric curve from Fig. 1
- Jeita Cave cloud distillation (gray line) and 50 year Gaussian smooth (black line) (Gonen and Goldsmith, 2023). Gray arrows indicate times where the Jeita record deviates substantially from the DS lake-level
- RCC records: Bond cycle (blue lines, times when hematite stained grains from North Atlantic cores were >15%, Bond et al., 2001), periods of high K+ from GISP2 ice core (green lines, Mayewski et al., 2004), advancement of Alps glaciers (orange, times when Alps glaciers were larger than present, (Ivy-Ochs et al., 2009)
- Mediterranean SST residuals, calculated from the Marriner et al. (2022) data by subtracting the raw data from a 400 year Gaussian smooth of the data, and applying a 100 year Gaussian smooth
- Intcal20 Δ14C residuals (Reimer et al., 2020) calculated by subtracting the raw data from a 400 year Gaussian smooth of the data (after: Stuiver and Braziunas, 1989) and applying a 100 year Gaussian smooth. Time when the lake was above the sill are marked by green vertical bars
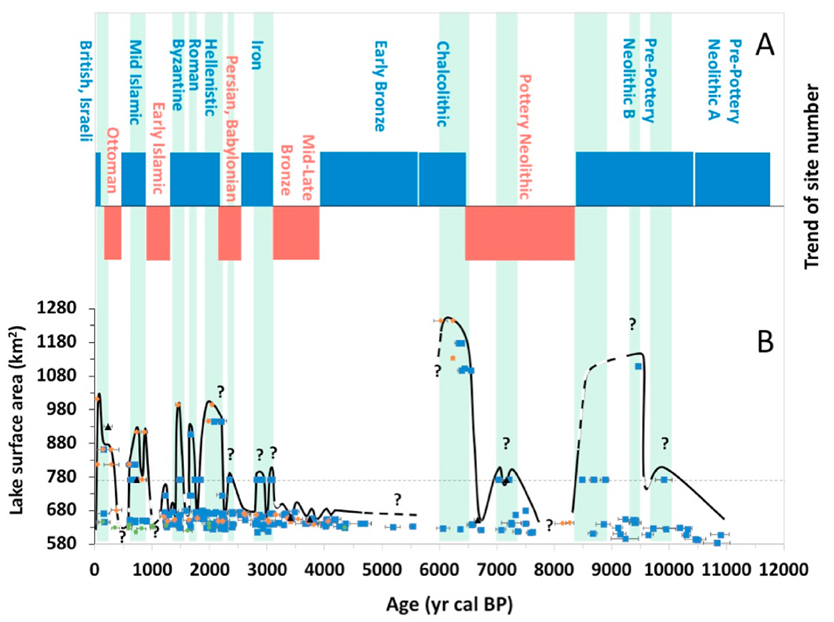 Figure 6
DS lake-level data vs. trend of archaeological site number in the Levant.
- The trend of archaeological site number in the Levant (after: Palmisano et al., 2019). For each cultural entity, we evaluate whether the number of sites increased (blue) or decreased (red), in respect to the previous entity.
- Dead Sea lake-level, see Fig. 4 for details
Goldsmith et al. (2023)
The Levant, a locus of some of the most dramatic cultural changes in human history (e.g. the onset of sedentism, agriculture and urbanization, Bar-Yosef and Belfer-Cohen, 1989; Greenberg, 2019), is located at the northern boundary of the global desert belt, and is characterized by high spatial variability of storms and annual rainfall totals (e.g., Enzel et al., 2008) making it a climatically fragile region (Ellenblum, personal communication). In such a region, small changes in water availability could incur substantial ecological and agricultural changes across the landscape and in turn, cultural responses (Peleg et al., 2012). The DS provides a quantitative hydroclimate record of the Levant and thus can be used to assess the potential role of climate in the region’s cultural evolution. As we are not archaeologists, we will not try to interpret the material culture in light of the hydroclimate reconstruction; however, we would like to evaluate whether there are possible relations between regional water availability and population dynamics.
To assess the history of cultural change in the Levant, we use the results of the archaeological site number database (Palmisano et al., 2019), which contains 20,688 sites of the different cultural entities throughout the Holocene (12–0.5 kyr cal BP)(Fig. 6). We acknowledge that the number of sites is probably not the best metric for evaluating population size because (Drennan et al., 2015):
- it does not account for the size of the sites
- it might be biased towards time intervals that are more highly studied (e.g., the “Biblical Period” of the Iron Age)
- it does not consider the potential destruction of sites through time (i.e., the older the site, the higher the chances it will be destroyed)
- the site number data compiled is based on many surveys that did not use a standardized definition of a “site” (e.g., is a site defined as a scatter of pottery or as a city?), and therefore, the self-consistency is unclear.
Figure 6DS lake-level data vs. trend of archaeological site number in the Levant.
- The trend of archaeological site number in the Levant (after: Palmisano et al., 2019). For each cultural entity, we evaluate whether the number of sites increased (blue) or decreased (red), in respect to the previous entity.
- Dead Sea lake-level, see Fig. 4 for details
Goldsmith et al. (2023)
The site number trend, qualitatively compared with the DS lake-area (Fig. 6), shows an overall relation. During intervals when the lake is large there is a site increase (during the Pre-pottery Neolithic B, Chalcolithic, Iron, Hellenistic - Roman – Byzantine, Middle Islamic, and British – Israeli) and during intervals when the lake is low there is a site decrease (during the Pottery Neolithic, Persian – Babylonian, Early Islamic and Ottoman). There are also exceptions that do not fit this relation (the Pre-Pottery Neolithic A and the Early Bronze Age). The relation presented, though crude, does suggest potential linkages between population dynamics and hydroclimate variability. More detailed and nuanced information pertaining to temporal leads or lags between the two datasets and a better quantification of both datasets is required to better understand this relation through time.
An additional important observation that is evident from this comparison, regards the collapse of the Late Bronze Age at 3200 years BP, which has been suggested to have been driven by a climatic shift (e.g., Langgut et al., 2014). This suggestion was supported by the DS lake-level record, and in particular the earlier interpretation and dating (of ~3.6 kyr cal BP) of the Ein Gedi high-stand sequence (Bartov, 2004; Langgut et al., 2014; Migowski et al., 2006). Our reevaluation of the ages from the Ein Gedi sequence questions the 3.6 kyr cal BP age (Bartov, 2004), and thus, we did not use this data point. Without this single point, it can be concluded that the lake-level begun rising at 4 kyr cal BP and over topped the sill at 3.1 kyr cal BP. A similar pattern is identified in the Jeita Cave record, where lower distillation characterized the first half of the Late Bronze Age, and a gradual distillation increase occurred throughout the Late Bronze Age and into Iron Age I. Thus, the transition from the Late Bronze Age into Iron Age I in the Levant was characterized by a wetting trend, and not drying.
- from Bookman et al (2004)
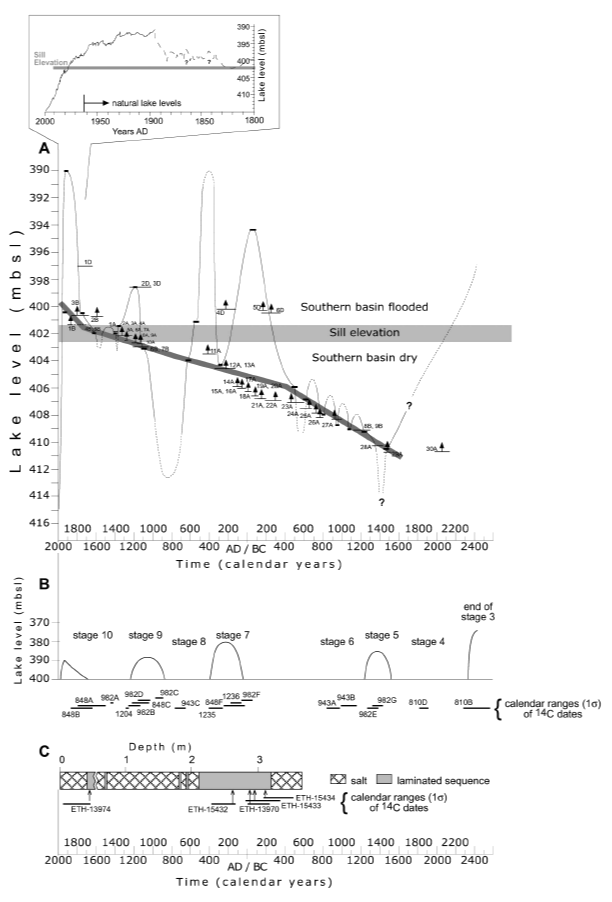
(A) The composite lake-level curve of the Dead Sea during the past 4000 yr. Calibrated radiocarbon dates with 1σ ranges are marked on the curve at the absolute elevation of the samples. Sample numbers marked by A, B, and D are referenced from Table 1 (Ze'elim A site), Table 2 (Ze'elim B site), and Table 3 (David site), respectively. The thick line at the bottom of the curve emphasizes the sediment accumulation at the Ze'elim site (see text). The inset at the top shows the measured historic lake-level curve since A.D. 1800 (modified from Klein, 1986, and extended to the year 2000 by using the Hydrological Service data)
(B) The Dead Sea lake-level curve reconstructed according to Mount Sedom caves (Fig. 1C) and assuming a diapir rising rate of 6 mm/yr (Frumkin, 1997; Frumkin et al., 2001). The radiocarbon dates adjusted to the calendar range are marked with horizontal bars and their sample number (Table 11.1 in Frumkin, 1992)
(C) Core DS 7-1 SC drilled offshore Ein Gedi in the deep northern basin (Fig. 1C). The horizontal extension of the core represents its depth in meters. Calibrated radiocarbon dates are marked with horizontal bars and the sample number (Heim et aL, 1997). Their locations in the core are marked with arrows, and they are adjusted to the calendar range of the Dead Sea curve.
Bookman et al (2004)
- from Kagan et al (2015)
 Figure 4
Dead Sea levels during the Bronze and Iron Ages. Lake levels are based on previous works by Bookman (Ken-Tor) et al. (2004) [Ze'elim and Nahal David (Ein Gedi) outcrops], Bartov (2004) [Arugot and Darga outcrops], Migowski et al. (2006) [DS cores], Stern (2010) [Ein Qedem outcrop], Kushnir and Stein (2010)'s interpretation, and on new data (Ze'elim outcrops) and interpretations from this study. References for some specific parts of the curve
- Bartov et al. 2007
- Frumkin et al. 1991; Migowski et al. 2006
- Stern 2010
- this study
- Bartov 2004
- Stern 2010
- beach ridge, this study and Bookman (Ken-Tor) et al. 2004
- Bookman (Ken-Tor) et al. 2004
Kagan et al (2015)
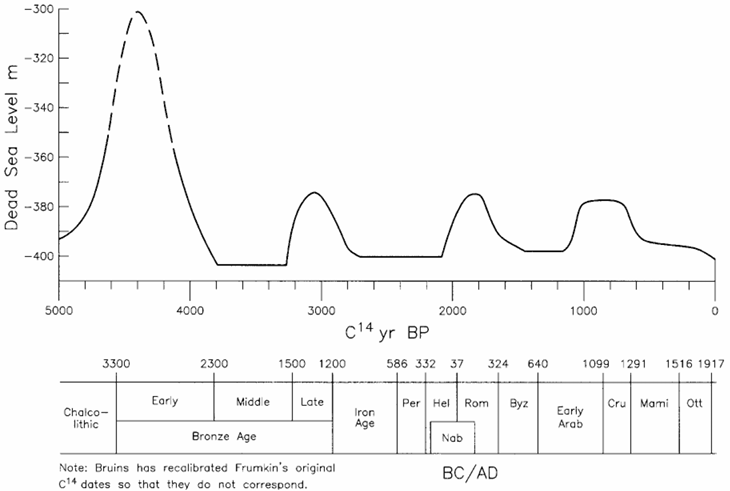 Fig. 2.14
Dead Sea level curve proposed by Bruins (1994). This curve shows a lake level high stand during EB II time with water levels being as high as -300 m asl. The curve is based mainly on the previous curve generated by Frumkin (1991).
Rast and Schaub (2003)
- from Hazan et al (2004)
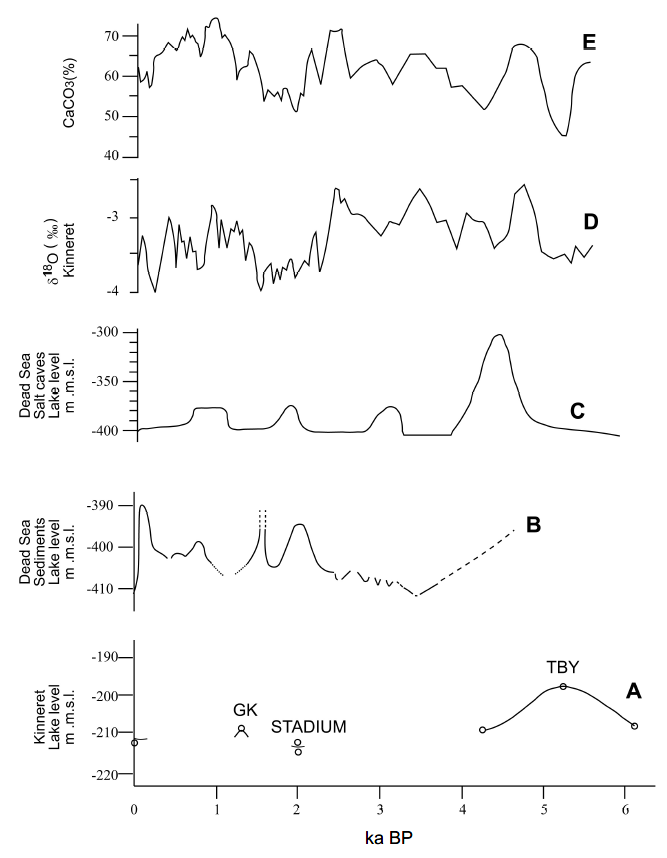 Figure 2
Comparison diagrams in the last 6,000 years.
- Kinneret Lake level curve (Hazan, 2003)
- Dead Sea level curve, made from lake sediments (Bookman et al., 2004)
- Dead Sea level curve made from Mt. Sedom salt caves (Frumkin et al., 1991)
- δ18O‰ of carbonate fraction in Lake Kinneret sediments (Stiller et al., 1984)
- % CaCO3 in Lake Kinneret sediments (Stiller et al., 1984)
- TBY = Tel Bet Yerach
- GK = Galei Kinneret
Hazan et al (2004)
- from Hazan et al (2005)

Reconstruction of the Lake Kinneret level curve during the past 40,000 yr. Filled diamonds mark lake level. They were determined by identification of beach sediments and 14C dating (see text). Open squares mark below-lake levels that were evaluated by the location and ages of lacustrine marls. Open circles mark above-lake levels. These points were determined by the occurrence of fluvial sediments and by archeological sites. The numbers on the diagram match those on the location map (Fig. 1) and the description of lake-level reconstruction in the text. During most of the last 40,000 yr, Lake Kinneret level was around 212 m bsl, with some prominent high-stand and low-stand excursions.
The two prominent high stands are:
- at 26,000–24,000 cal yr B.P., lake level reached its highest stand of >174 m bsl and the Kinneret converged with the Southern Lake Lisan.
- At 5200 cal yr B.P., lake level exceeded the altitude of 200 m bsl. The stands are reflected by several gaps in the curve.
- Before 41,000 cal yr B.P.
- between 40,000 and 36,000 cal yr B.P.
- between33,000 and 27,000 cal yr B.P.
- between 14,000 and 10,000 cal yr B.P.
Hazan et al (2005)
- from Hazan et al (2005)
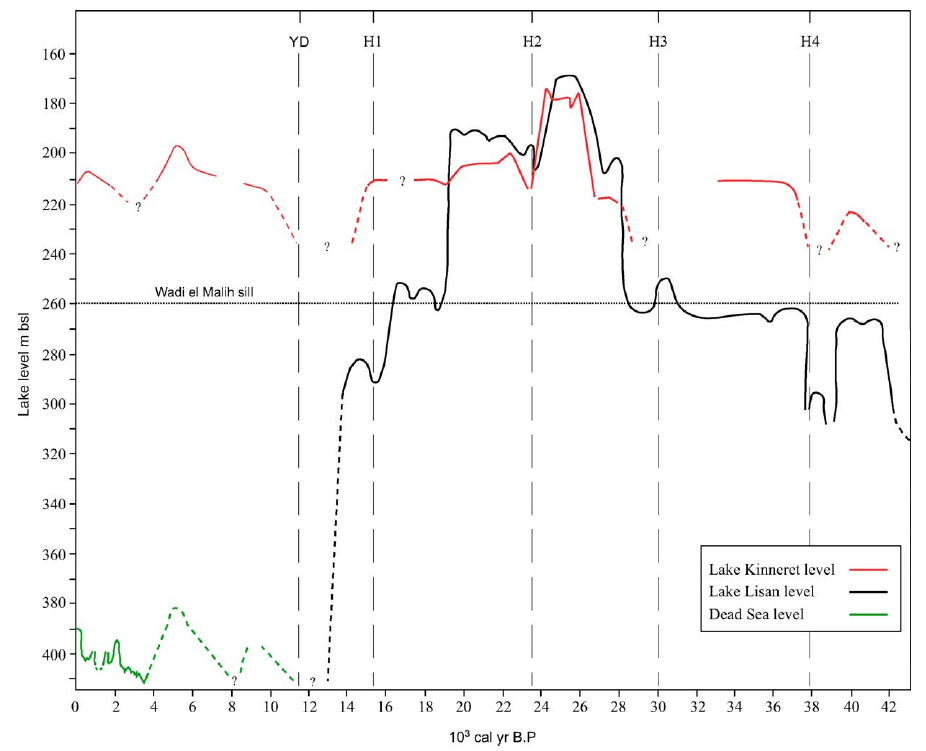
Comparison between Lisan (black), Dead Sea (green), and Kinneret (red) level curves. Note the good agreement between the Lisan and Kinneret curves at periods of high or significantly low stands. Low stands are expressed as hiatuses in the Kinneret curve, and they coincide with the timing of H events in the North Atlantic. The difference between the amplitudes of lake level is significantly larger in the late Pleistocene period (Lisan and Kinneret diagrams) as compared to the Holocene period (Kinneret and Dead Sea diagrams). The Lisan diagram is after Bartov et al. (2003), the Dead sea diagram is after Bookman (Ken-Tor) et al., 2004 and Migowski et al. (2004).
Hazan et al (2005)
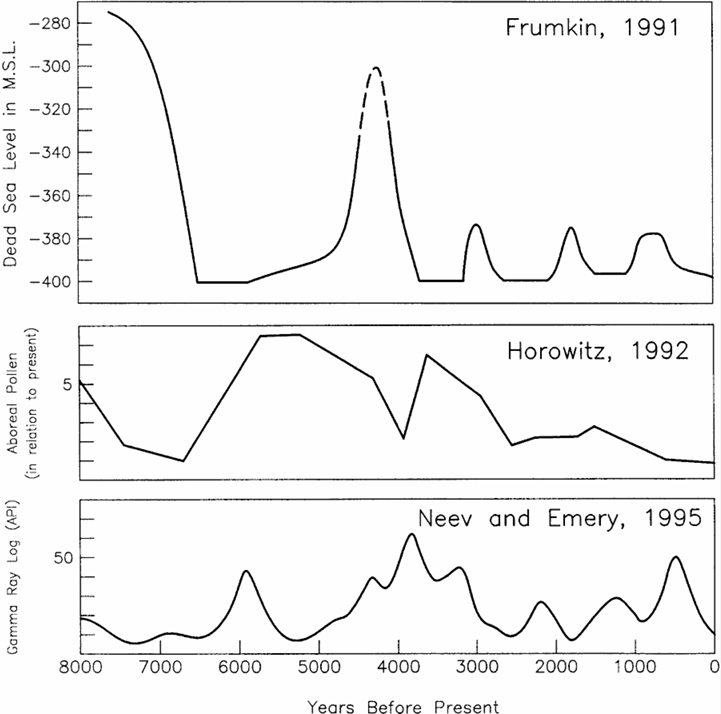 Fig. 2.8
Climatic fluctuation as suggested from three different data sets: Frumkin and others (1991), Horowitz (1992), and Neev and Emery (1995).
Rast and Schaub (2003)

Simplified pollen diagram of the Ze’elim composite sequence. A 10-fold exaggeration is used to show changes in low taxa percentages. Chronology and the division into historical periods are based on carbon-14 (14C) dates, calibrated in 2 σ-range. The Carduus-Centaurea group includes thistle taxa Crisium, Carduus, Carthamus, Xanthium and Echinops, and different species of Centaurea. The cereal-type pollen is distinguished from other grasses by its larger size (at least 37 mm; e.g. Beug 2004) and includes wild and cultivated cereals. However, a rise in the cereal curve with no ecological explanation might be connected to agricultural activities. At right: ZA-Pcomp, composite sedimentary profile from two nearby outcrops (FD/ZA3 and ZA2; more details in Kagan et al. 2015). The Late Bronze beach ridge has been reduced to about a third of its thickness for clarity of the pollen diagram. Ages at right of sedimentary section are given in Table 2. Ages for the Middle Bronze period are from Neumann et al. 2007a.
Langgut et al (2014)
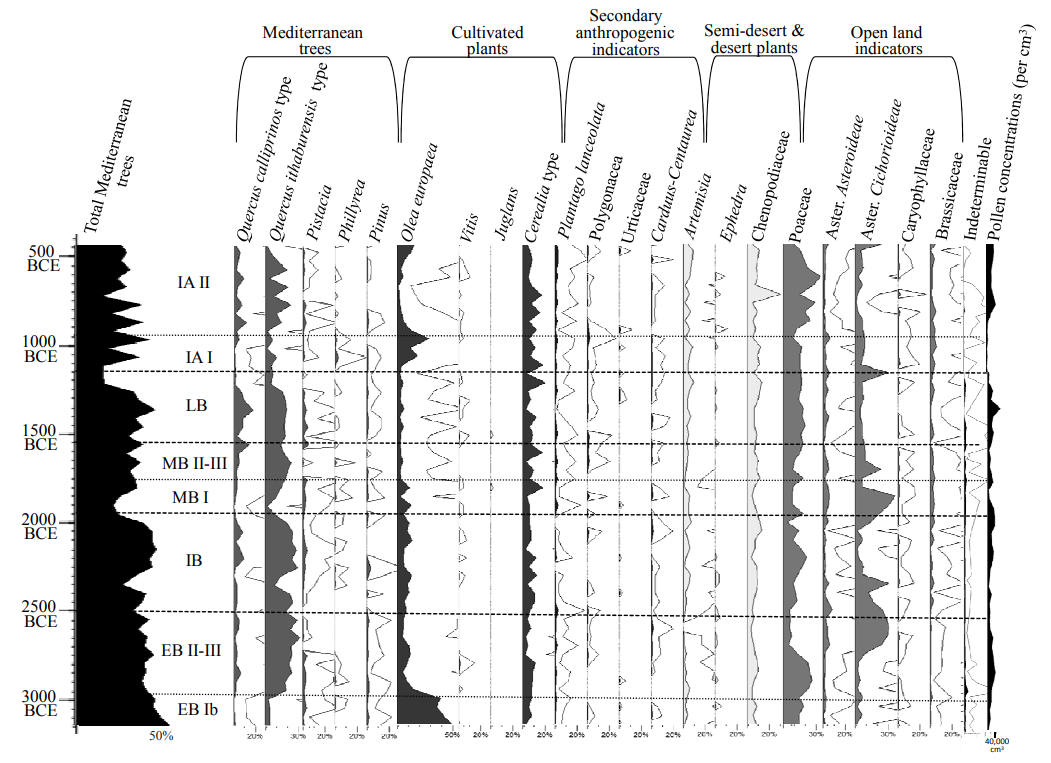 Figure 3
Simplified pollen diagram of the Sea of Galilee record during the Bronze and Iron Ages. A 10-fold exaggeration is used to show changes in low taxa percentages. he palynological diagram was divided into five main groups based on taxa geographical origin and on ecological and cultural characteristics (see online Appendix).
- EB = Early Bronze Age
- IB = Intermediate Bronze Age
- MB = Middle Bronze Age
- LB = Late Bronze Age
- IA = Iron Age
Langgut et al (2015)
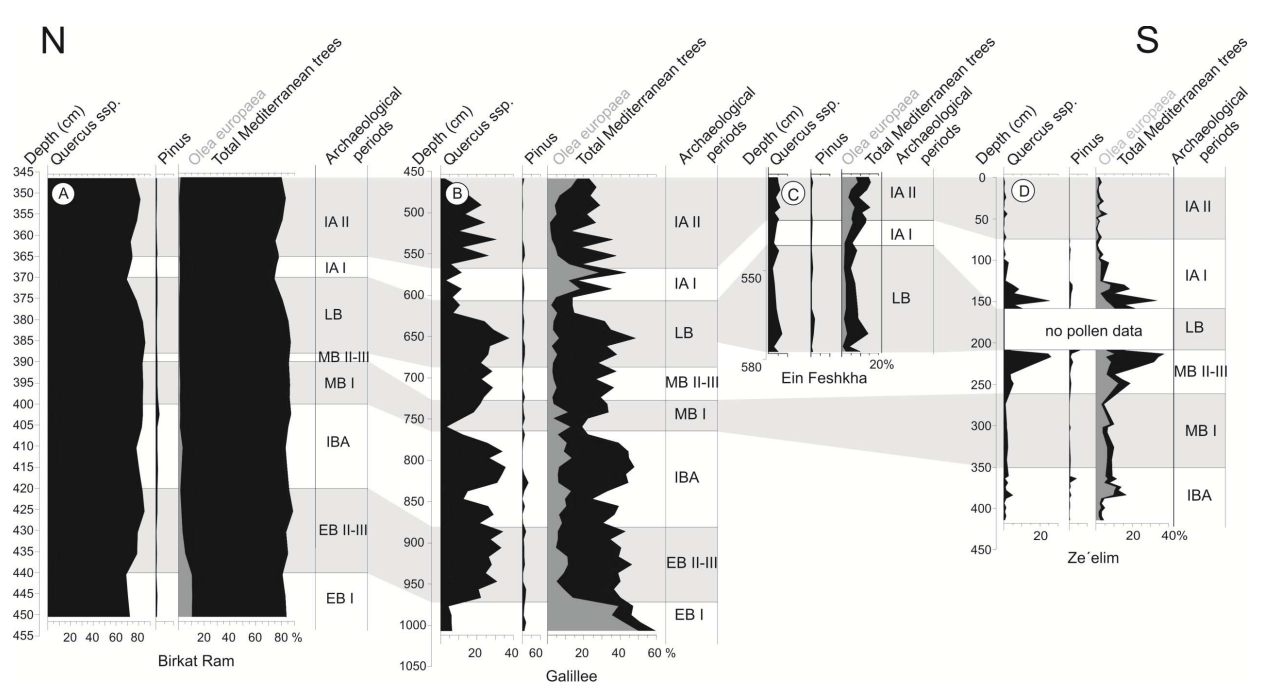 Figure 4
A north-south transect of 220 km along the southern Levant during the Bronze and Iron Ages composed of the pollen records from Birkat Ram, Sea of Galilee, Ein Feshkha, and the Ze’elim Gully (references in Figure 1a). Four main pollen curves are given:
- Quercus (oak)
- Pinus halepensis (pine)
- Olea europaea (olive)
- total tree pollen of the Mediterranean maquis/forest
Langgut et al (2015)
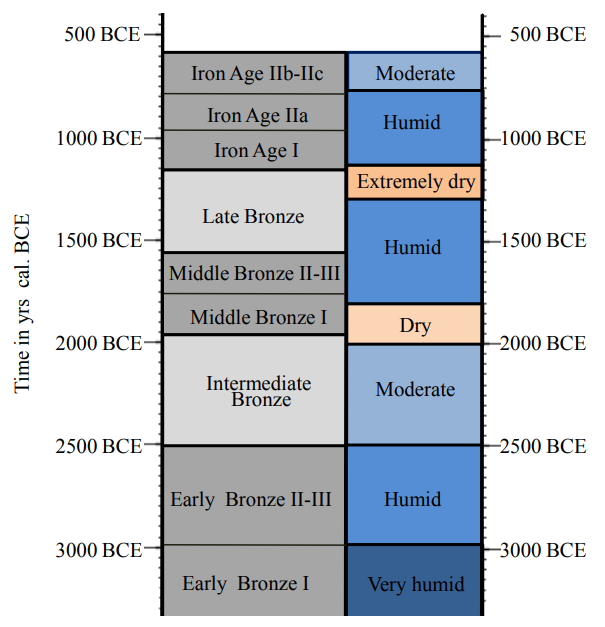 Figure 5
Summary of the climate history of the southern Levant during the Bronze and Iron Ages based on the palynological evidence
Langgut et al (2015)
Fig. 2.8Climatic fluctuation as suggested from three different data sets: Frumkin and others (1991), Horowitz (1992), and Neev and Emery (1995).
Rast and Schaub (2003)