Seismic Events at Jarmaq Trench
Location
see site in Google EarthSources and Links
Nemer, T. and M. Meghraoui (2006). "Evidence of coseismic ruptures along the Roum fault (Lebanon): a possible source for the AD 1837 earthquake." Journal of Structural Geology 28(8): 1483-1495.
| Description | Image | Source | Comments |
|---|---|---|---|
| Trench Location |
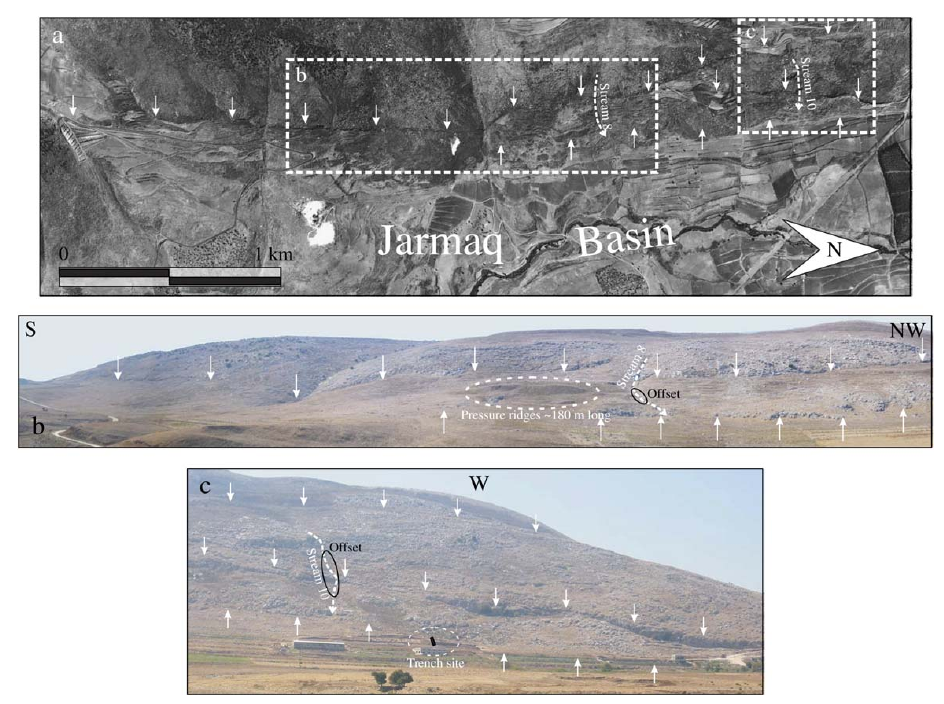 Fig. 5
Nemer and Meghraoui (2006) |
Nemer and Meghraoui (2006) | Figure 5 |
| Trench Photo and Log |
 Fig. 6
Nemer and Meghraoui (2006) |
Nemer and Meghraoui (2006) | Figure 6 |
| Schematic Reconstruction of paleoseismic events |
 Fig. 8
Schematic reconstruction of the palaeoseismic events as observed in the trench (Fig. 6a). Steps 1 to 12 illustrate the relationships between the 5 faulting episodes and successive alluvial-colluvial deposits. The white caliche units ( g and e) mark the stratigraphic succession and point out the rupture locations. Event Z is covered by unit a, which corresponds to a thick colluvial unit visible on the western edge of the trench. Nemer and Meghraoui (2006) |
Nemer and Meghraoui (2006) | Figure 8 |