Seismic Events at Faqaa Trench
Sources and Links
Nemer, T., et al. (2008). "The Rachaya-Serghaya fault system (Lebanon): Evidence of coseismic ruptures, and the AD 1759 earthquake sequence." Journal of Geophysical Research: Solid Earth 113(B5)
| Description | Image | Source | Comments |
|---|---|---|---|
| Large Location Map |
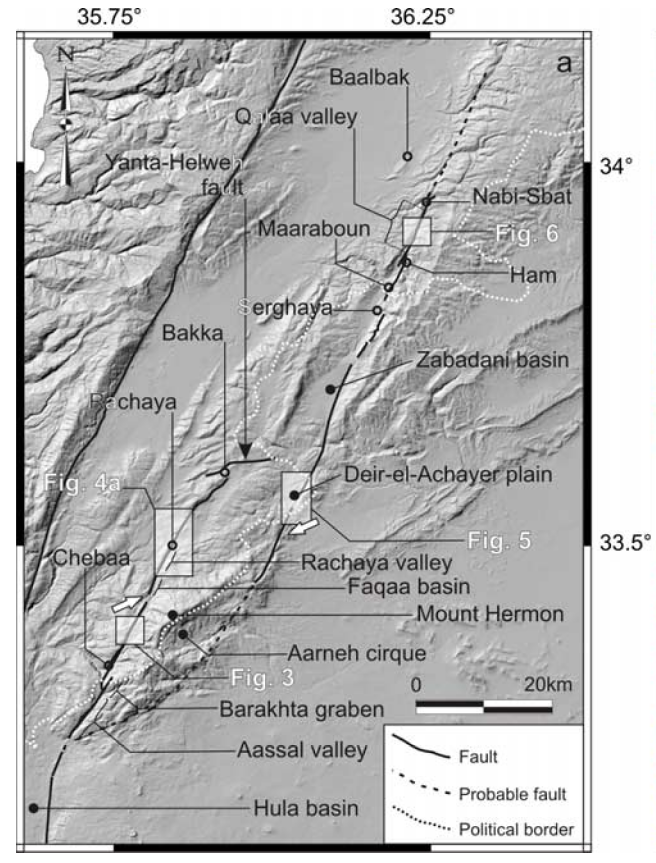 Fig. 2a
Digital elevation model of the RcF-SF (Rachaya Fault - Serghaya Fault) area (location on Figure 1b) showing the different places referred to throughout the text. White boxes indicate the locations of subsequent figures. White arrows indicate the slope break at the base of the northern flank of Mount Hermon. Probable faulting (broken line southwest and northeast) of SF (Serghaya Fault) is after Gomez et al. [2003]. Nemer et al (2008) |
Nemer et al (2008) | Figure 2a |
| Faqaa Trench Location Map |
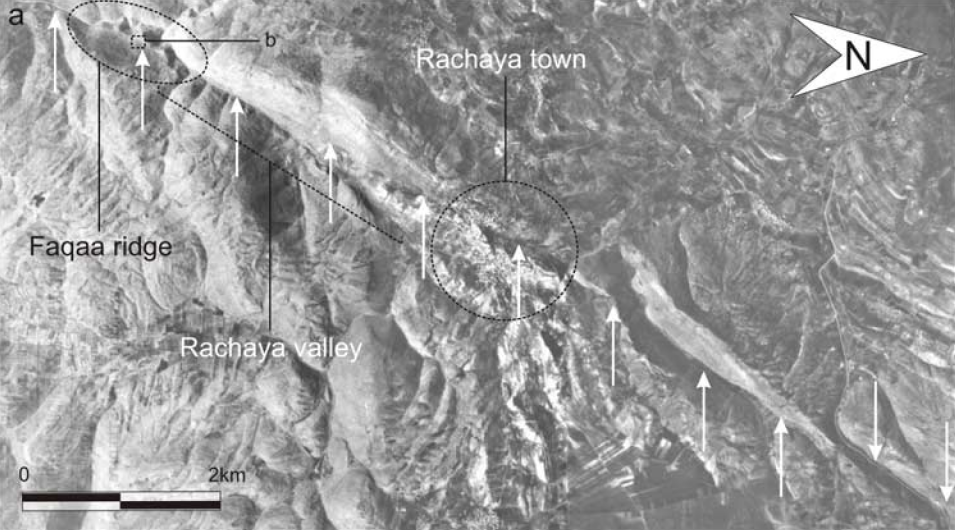 Fig. 4a
Aerial photograph showing the Rachaya fault (indicated with arrows) in the Rachaya area (see Figure 2a for location). JW: Box marked b shows location of Faqaa Trench Nemer et al (2008) |
Nemer et al (2008) | Figure 4a |
| Faqaa Trench Site Photo |
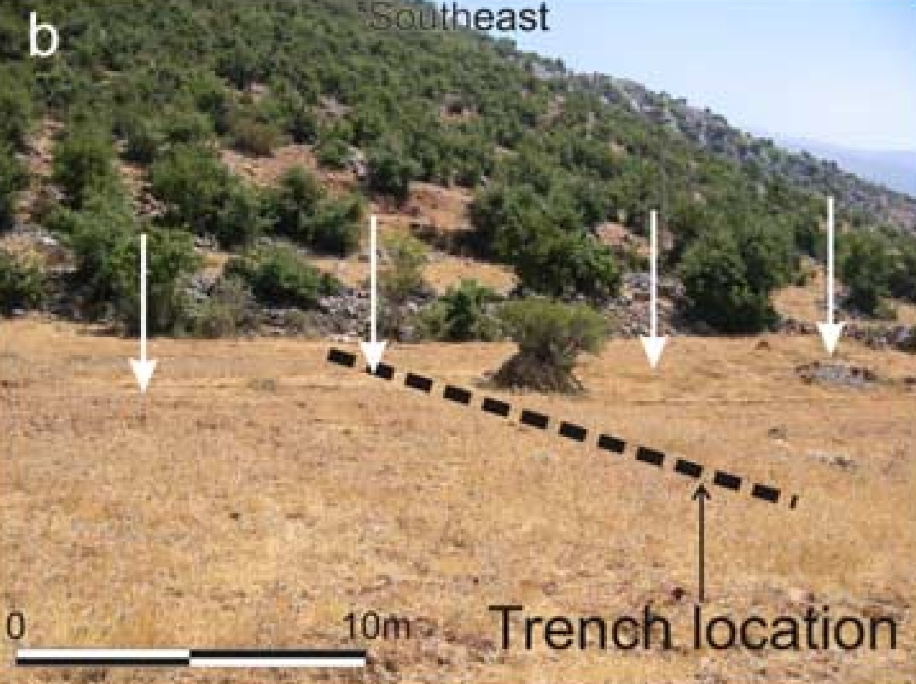 Fig. 4b
Fresh fault scarp (indicated with arrows) detected along the Faqaa ridge. Dashed line indicates the location of the paleoseismic trench (section 5.1; Figure 7). View SE. Nemer et al (2008) |
Nemer et al (2008) | Figure 4b |
| Trench Log and Photomosaic of Faqaa Trench |
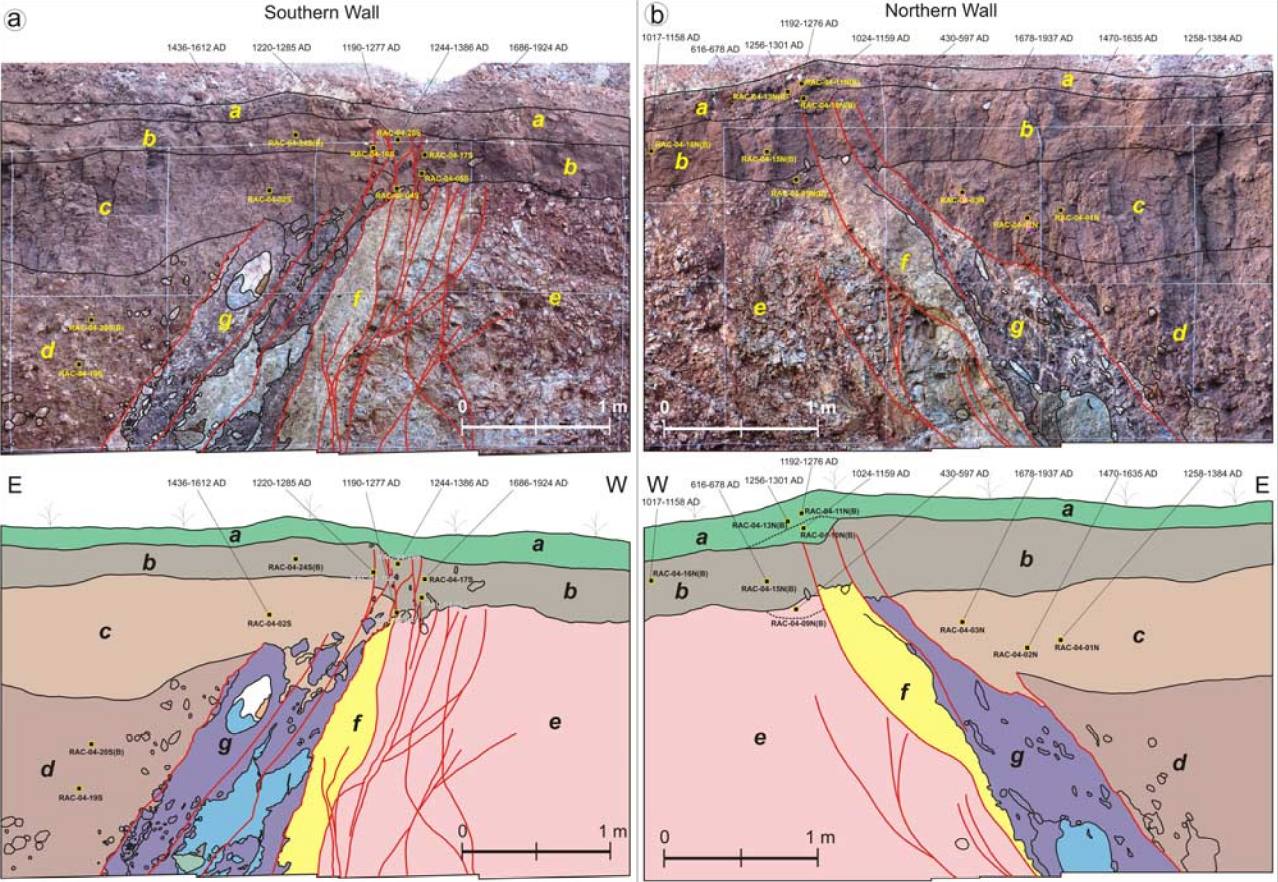 Fig. 7
Photo-mosaics and traces of the southern (a) and northern (b) walls of the Faqaa trench. Stratigraphic and shear units are labeled a-g (see text for details). Red lines indicate the fault branches. Black squares are the locations of the 14C samples with their corresponding names and age ranges. Nemer et al (2008) |
Nemer et al (2008) | Figure 7 |
| Trench Log and Photomosaic of Faqaa Trench South Wall |
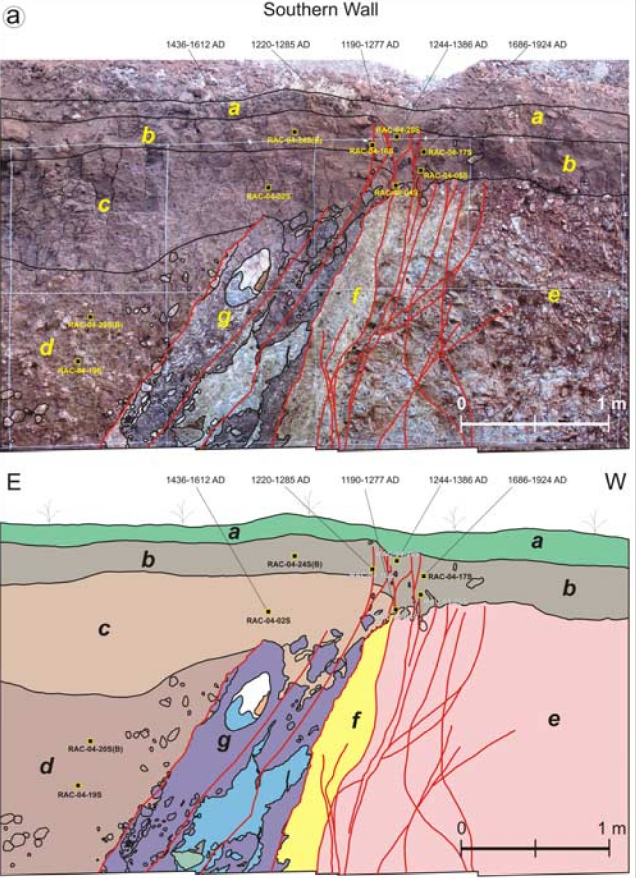 Fig. 7a
Photo-mosaics and traces of the southern wall of the Faqaa trench. Stratigraphic and shear units are labeled a-g (see text for details). Red lines indicate the fault branches. Black squares are the locations of the 14C samples with their corresponding names and age ranges. Nemer et al (2008) |
Nemer et al (2008) | Figure 7a |
| Trench Log and Photomosaic of Faqaa Trench North Wall |
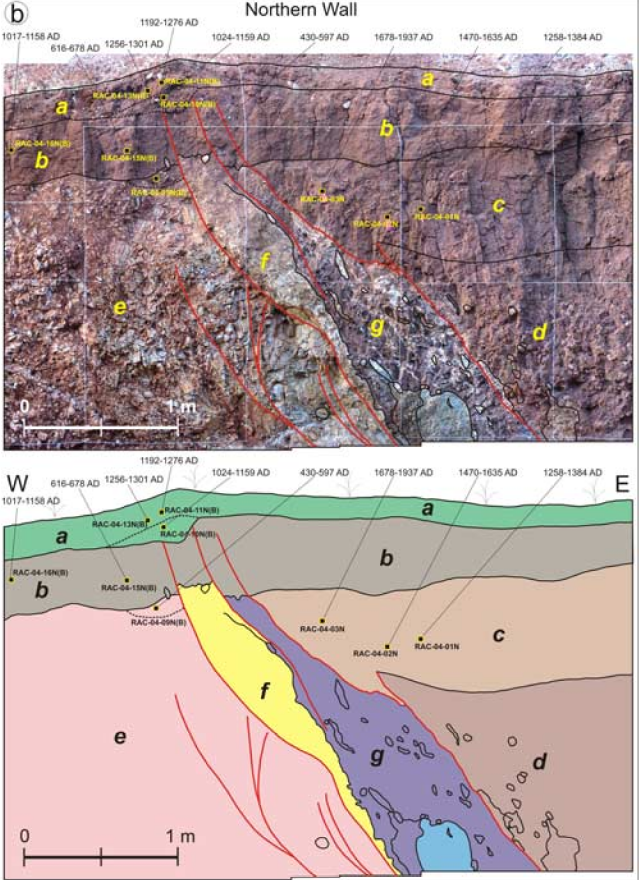 Fig. 7b
Photo-mosaics and traces of the northern wall of the Faqaa trench. Stratigraphic and shear units are labeled a-g (see text for details). Red lines indicate the fault branches. Black squares are the locations of the 14C samples with their corresponding names and age ranges. Nemer et al (2008) |
Nemer et al (2008) | Figure 7b |
| Age Depth Model |
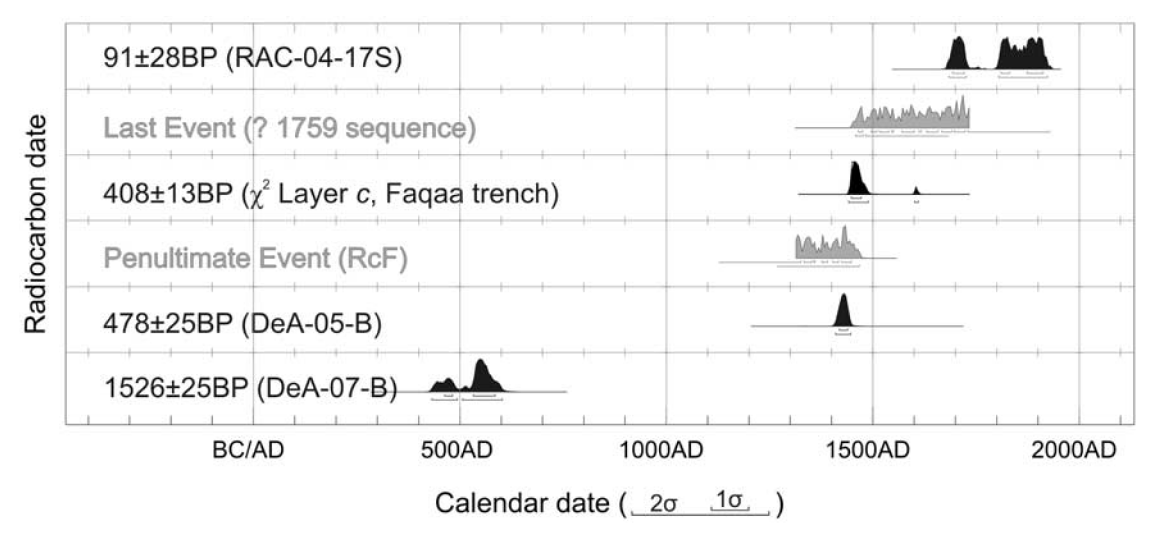 Fig. 8
Probability distribution of 14C (Table 1) obtained from sequential radiocarbon dates automatically performed by the OxCal 3.10 Program (Bronk Ramsey, 1998). Calibrated dates (black) are presented with 1σ and 2σ age ranges (68.3% and 95.4% density, respectively). Age ranges of seismic events (grey) are determined using Bayesian distribution and related conditional probability imposed by the stratigraphic sequence and 14C dating of the Faqaa trench. Nemer et al (2008) |
Nemer et al (2008) | Figure 8 |