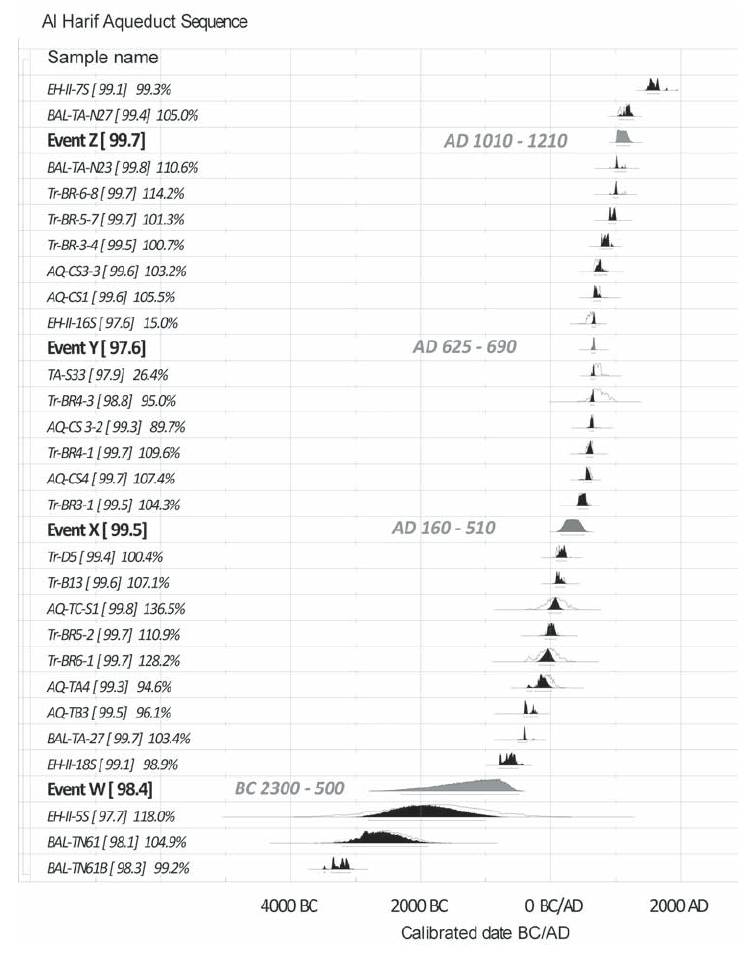
Figure 12. (A) Calibrated dating of sam-ples (with calibration curve INTCAL04 from Reimer et al. [2004] with 2 sigma age range and 95.4% probability)
and sequential distribution from Oxcal pro¬gram (see also Table 1; Bronk Ramsey, 2001). The Bayesian distribution com¬putes the time range of
large earthquakes (events W, X, Y, and Z) at the Al Harif aqueduct according to faulting events, construction and repair of walls, and starts and
interruptions of the tufa deposits (see text for explanation). Number in brackets (in %) indicates how much the sample is in sequence; the number in
% indicates an agreement index of overlap with prior distribution.
Sbeinati et al (2010)
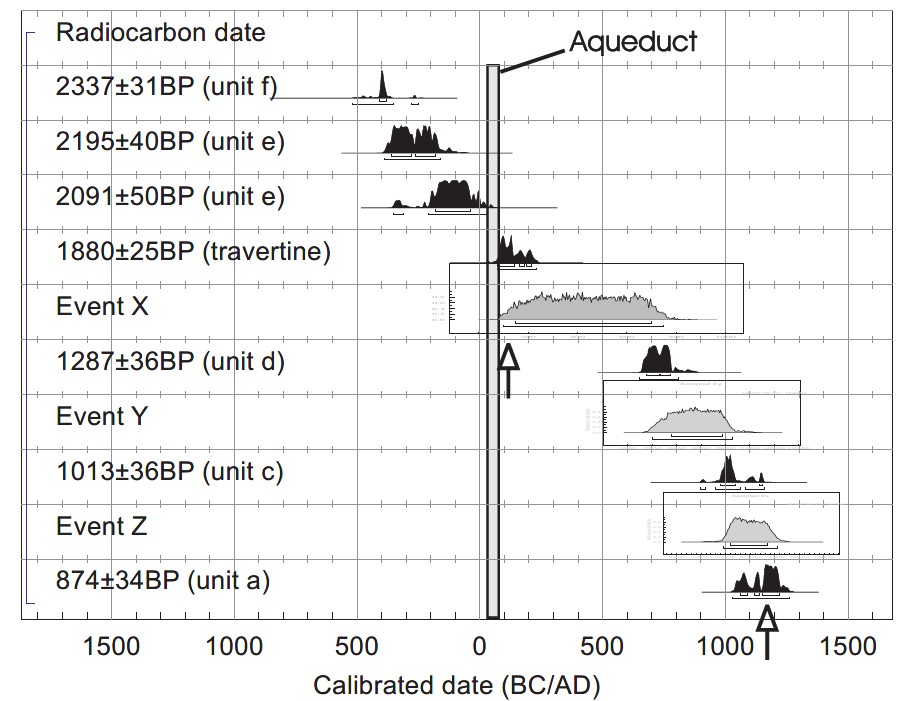
Table 3. Probability distribution of calibrated C14 ages (in calendar years BC/AD) obtained from sequential radiocarbon dates (BP) using Oxcal v3.5 [24] and INTCAL98 calibration curve [25].
As indicated in Table 2, calibrated dates are presented with 2-age range (95.4% density). The age of the aqueduct is estimated considering unit e that predates the building
(see text for explanation) and the travertine age that postdate the building. Age ranges of seismic events X (AD 100-750), Y (AD 700-1030) and Z (AD 990-1210) are determined
using the Bayesian analysis (probability distribution of the ages). Arrows show our preferred ages associated with two historical large earthquakes in AD 115 and AD 1170.
Meghraoui et al (2003)